Business Diagram Colored Graph For Business And Finance Data Analysis Presentation Template
- Google Slides is a new FREE Presentation software from Google.
- All our content is 100% compatible with Google Slides.
- Just download our designs, and upload them to Google Slides and they will work automatically.
- Amaze your audience with SlideGeeks and Google Slides.
-
Want Changes to This PPT Slide? Check out our Presentation Design Services
- WideScreen Aspect ratio is becoming a very popular format. When you download this product, the downloaded ZIP will contain this product in both standard and widescreen format.
-

- Some older products that we have may only be in standard format, but they can easily be converted to widescreen.
- To do this, please open the SlideGeeks product in Powerpoint, and go to
- Design ( On the top bar) -> Page Setup -> and select "On-screen Show (16:9)” in the drop down for "Slides Sized for".
- The slide or theme will change to widescreen, and all graphics will adjust automatically. You can similarly convert our content to any other desired screen aspect ratio.
Compatible With Google Slides

Get This In WideScreen
 Instant
 Download
 100%
100% Editable
google slide
Features of these PowerPoint presentation slides:
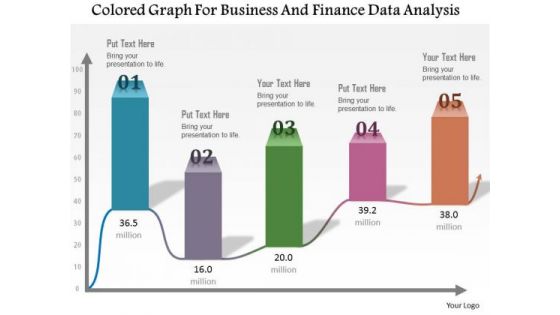
This Power Point template has been designed with graphic of colored bar graph. Use this slide to represent five steps of any business process. Use this diagram for your business presentations and get exclusive comments on your efforts.
People who downloaded this PowerPoint presentation also viewed the following :
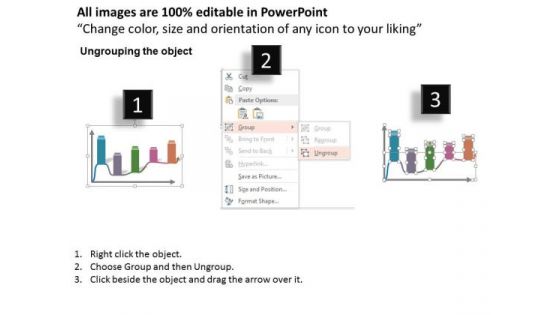
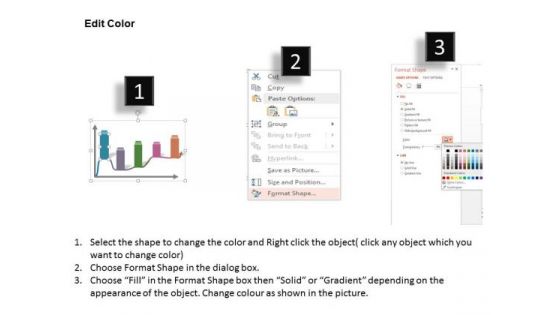
Business Diagram Colored Graph For Business And Finance Data Analysis Presentation Template with all 3 slides:
Most Relevant Reviews
-
Excellent template with unique design.
-
Good research work and creative work done on every template.

 Home
Home 


