AI PPT Maker
 Templates
 PPT Bundles
 Design Services
 Business PPTs
 Business Plan
 Management
 Strategy
 Introduction PPT
 Roadmap
 Self Introduction
 Timelines
 Process
 Marketing
 Agenda
 Technology
 Medical
 Startup Business Plan
 Cyber Security
 Dashboards
 SWOT
SWOT Proposals
 Education
 Pitch Deck
 Digital Marketing
 KPIs
KPIs Project Management
 Product Management
 Artificial Intelligence
 Target Market
 Communication
 Supply Chain
 Google Slides
 Research Services
 One Pagers
 All Categories
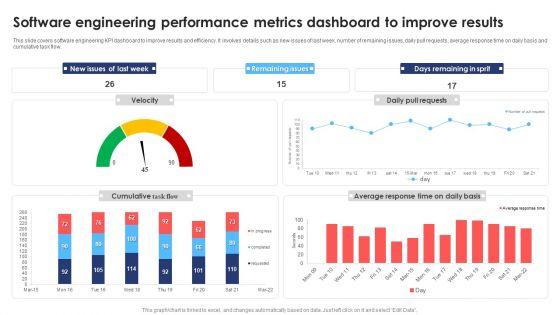
Software Engineering Performance Metrics Dashboard To Improve Results Infographics PDF


Features of these PowerPoint presentation slides:
This slide covers software engineering KPI dashboard to improve results and efficiency. It involves details such as new issues of last week, number of remaining issues, daily pull requests, average response time on daily basis and cumulative task flow. Pitch your topic with ease and precision using this Software Engineering Performance Metrics Dashboard To Improve Results Infographics PDF. This layout presents information on Software Engineering Performance, Metrics Dashboard Improve Results. It is also available for immediate download and adjustment. So, changes can be made in the color, design, graphics or any other component to create a unique layout.
People who downloaded this PowerPoint presentation also viewed the following :
Related Products
Software Engineering Performance Metrics Dashboard To Improve Results Infographics PDF with all 2 slides: