Financial analysis PowerPoint Templates
-
Executive Summary Template Ppt PowerPoint Presentation Slides Themes
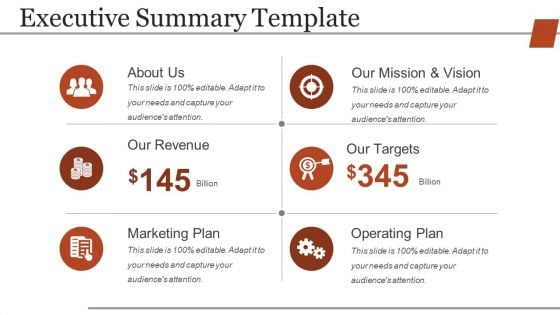
This is a executive summary template ppt powerpoint presentation slides themes. This is a six stage process. The stages in this process are about us, our revenue, marketing plan, our mission and vision, our targets, operating plan.
-
Executive Dashboard Ppt PowerPoint Presentation Introduction
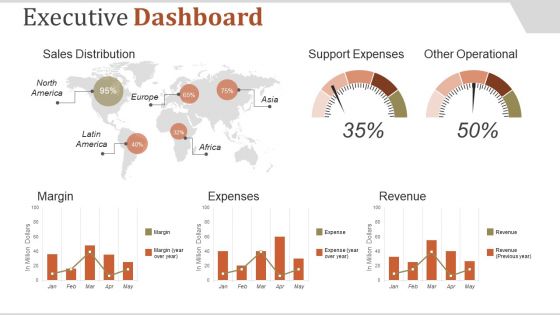
This is a executive dashboard ppt powerpoint presentation introduction. This is a five stage process. The stages in this process are sales distribution, support expenses, other operational, margin, expenses.
-
Executive Dashboard Ppt PowerPoint Presentation Graphics
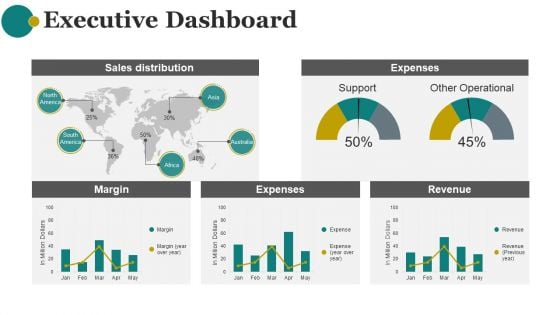
This is a executive dashboard ppt powerpoint presentation graphics. This is a five stage process. The stages in this process are sales distribution, expenses, margin, expenses, revenue.
-
Four Stages Corporate Acquisition Process Ppt PowerPoint Presentation Outline Guide
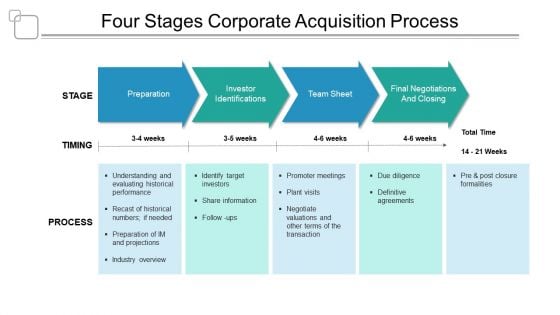
This is a four stages corporate acquisition process ppt powerpoint presentation outline guide. This is a four stage process. The stages in this process are investment, funding, private equity, venture capital.
-
Four Steps Pie Charts For Financial Analysis Powerpoint Slides
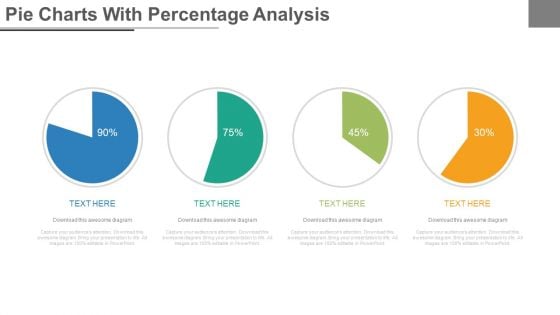
Four pie charts have been displayed in this business slide. This PowerPoint template helps to exhibit financial ratio analysis. Use this diagram slide to build an exclusive presentation.
-
Business Diagram Four Colored Pie Charts For Result Analysis Data Driven PowerPoint Slide
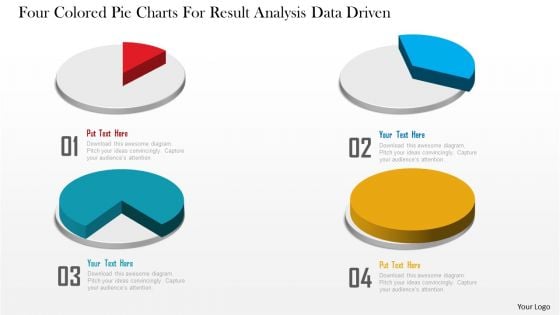
This business diagram displays graphic of pie charts. This business slide is suitable to present and compare business data. Use this diagram to build professional presentations for your viewers.
-
Dashboard Ppt PowerPoint Presentation Shapes
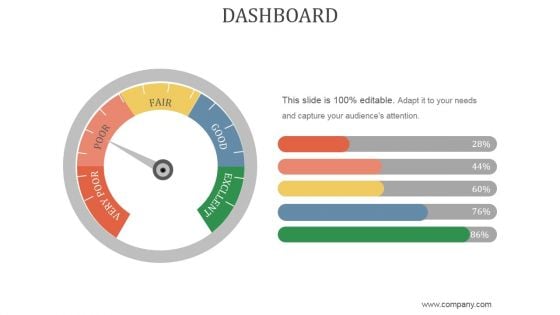
This is a dashboard ppt powerpoint presentation shapes. This is a five stage process. The stages in this process are very poor, poor, fair, good, excllent.
-
Business Operations Summary Ppt PowerPoint Presentation Summary Design Inspiration
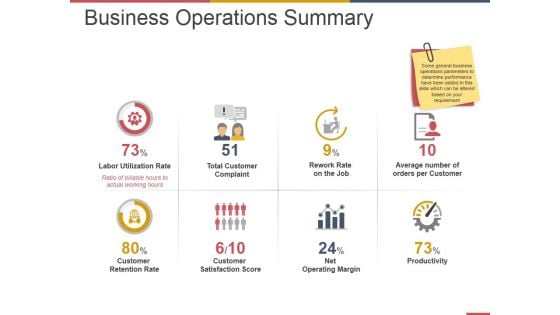
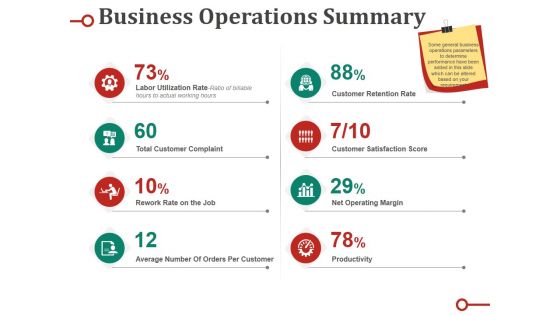
This is a business operations summary ppt powerpoint presentation summary design inspiration. This is a eight stage process. The stages in this process are labor utilization rate, total customer, complaint, rework rate on the job, average number of orders per customer, customer retention rate, customer satisfaction score, net operating margin.
-
Investor Pitch Ppt PowerPoint Presentation Complete Deck With Slides
This is a investor pitch ppt powerpoint presentation complete deck with slides. This is a one stage process. The stages in this process are business, marketing, finance, currency, management.
-
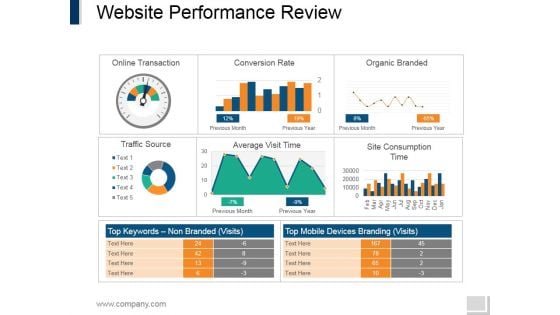
Website Performance Review Ppt PowerPoint Presentation Icon Deck
This is a website performance review ppt powerpoint presentation icon deck. This is a three stage process. The stages in this process are conversion rate, average visit value goal, visits.
-
Company Introduction Ppt PowerPoint Presentation Tips
This is a company introduction ppt powerpoint presentation tips. This is a one stage process. The stages in this process are business, about us, company introduction, marketing, strategy.
-
Executive Summary Ppt PowerPoint Presentation Styles Professional
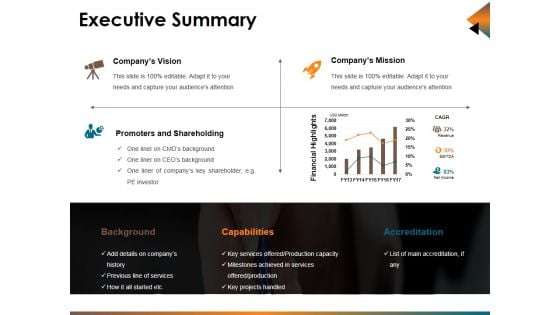
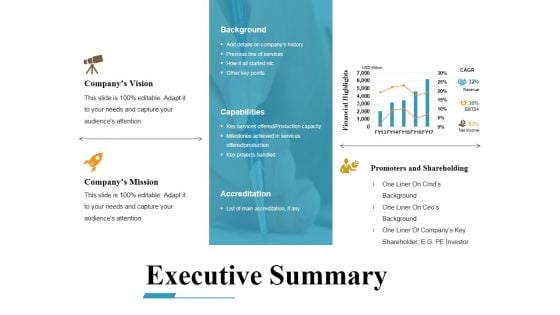
This is a executive summary ppt powerpoint presentation styles professional. This is a four stage process. The stages in this process are company vision, promoters and shareholding, company mission, financial highlights.
-
Budgeting And Forecasting In Accounting Ppt PowerPoint Presentation Complete Deck With Slides
This is a Budgeting and forecasting in accounting ppt powerpoint presentation complete deck with slides. This is a one stage process. The stages in this process are graph, finance, analysis, marketing, business.
-
Business Operations Summary Ppt PowerPoint Presentation Infographics Infographic Template
This is a business operations summary ppt powerpoint presentation infographics infographic template. This is a eight stage process. The stages in this process are labor utilization rate, customer retention rate, total customer complaint, customer satisfaction score, rework rate on the job.
-
Management Financial Report Ppt PowerPoint Presentation Diagrams
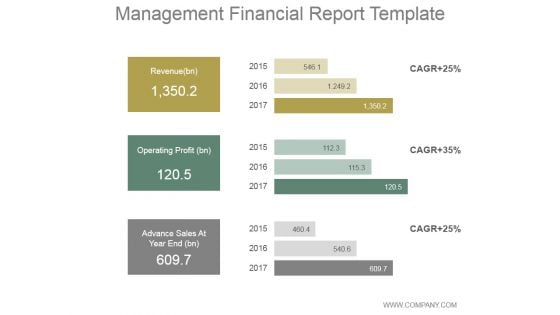
This is a management financial report ppt powerpoint presentation diagrams. This is a three stage process. The stages in this process are revenue, operating profit, advance sales at year end.
-
Call Center Metrics Ppt PowerPoint Presentation Complete Deck With Slides
If designing a presentation takes a lot of your time and resources and you are looking for a better alternative, then this Call Center Metrics Ppt PowerPoint Presentation Complete Deck With Slides is the right fit for you. This is a prefabricated set that can help you deliver a great presentation on the topic. All the thirteen slides included in this sample template can be used to present a birds eye view of the topic. These slides are also fully editable, giving you enough freedom to add specific details to make this layout more suited to your business setting. Apart from the content, all other elements like color, design, theme are also replaceable and editable. This helps in designing a variety of presentations with a single layout. Not only this, you can use this PPT design in formats like PDF, PNG, and JPG once downloaded. Therefore, without any further ado, download and utilize this sample presentation as per your liking.
-
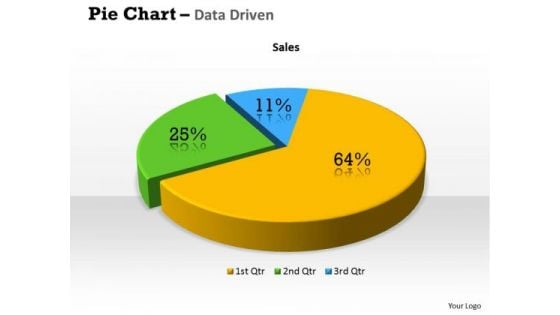
Quantitative Data Analysis 3d Pie Chart For Business Process PowerPoint Templates
Put Them On The Same Page With Our quantitative data analysis 3d pie chart for business process Powerpoint Templates . Your Team Will Sing From The Same Sheet.
-
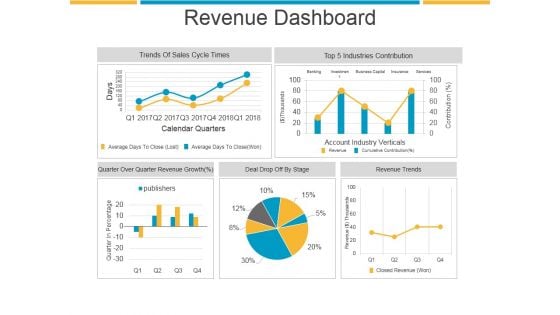
Revenue Dashboard Ppt PowerPoint Presentation Sample
This is a revenue dashboard ppt powerpoint presentation sample. This is a five stage process. The stages in this process are trends of sales cycle times, industries contribution, revenue trends, deal drop off by stage.
-
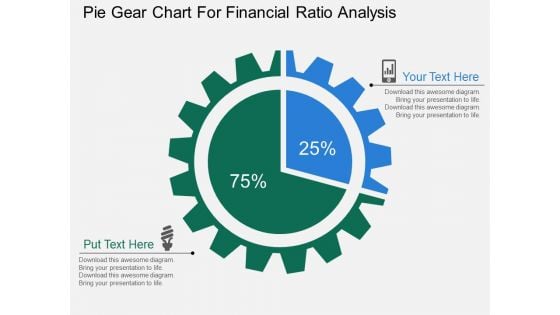
Pie Gear Chart For Financial Ratio Analysis Powerpoint Templates
This PPT slide displays diagram of pie gear chart. This PowerPoint template has been designed to exhibit financial ratio analysis. You can present your opinions using this impressive slide
-
Start Up Business Proposal Ppt PowerPoint Presentation Complete Deck With Slides
This is a start up business proposal ppt powerpoint presentation complete deck with slides. This is a one stage process. The stages in this process are business, proposal, management, marketing, success.
-
Financial Analysis Module PPT PowerPoint Presentation Complete Deck With Slides
This is a financial analysis module ppt powerpoint presentation complete deck with slides. This is a one stage process. The stages in this process are table, business, finance, analysis, percentage.
-
Business Strategy Marketing Plans And Strategies Ppt PowerPoint Presentation Complete Deck With Slides
This is a business strategy marketing plans and strategies ppt powerpoint presentation complete deck with slides. This is a one stage process. The stages in this process are business, marketing, finance, analysis, sales.
-
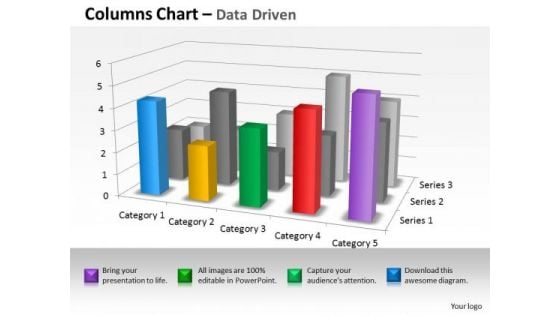
Quantitative Data Analysis 3d Interpretation Of Statistical Quality Control PowerPoint Templates
Land The Idea With Our quantitative data analysis 3d interpretation of statistical quality control Powerpoint Templates . Help It Grow With Your Thoughts.
-
Crm Planning And Implementation Procedures And Practices PPT PowerPoint Presentation Complete Deck With Slides
This is a crm planning and implementation procedures and practices ppt powerpoint presentation complete deck with slides. This is a one stage process. The stages in this process are finance, success, process, planning, graph analysis.
-
Executive Summary Ppt PowerPoint Presentation Ideas Example File
This is a executive summary ppt powerpoint presentation ideas example file. This is a three stage process. The stages in this process are company vision, company mission, promoters and shareholding, financial highlights.
-
Business Diagram Multiple Meters On Dashboard For Speed Measurement PowerPoint Slide
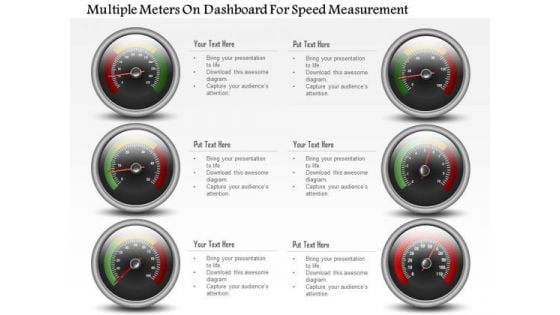
This business diagram has been designed with multiple meters on dashboard. This slide can be used for business planning and progress. Use this diagram for your business and success milestones related presentations.
-
Comparison Ppt PowerPoint Presentation Inspiration Structure
This is a comparison ppt powerpoint presentation inspiration structure. This is a two stage process. The stages in this process are compare, measure, finance, percentage, business.
-
Workforce Annual Analysis Ppt PowerPoint Presentation Complete Deck With Slides
Presenting this set of slides with name Workforce Annual Analysis Ppt PowerPoint Presentation Complete Deck With Slides. The topics discussed in these slides are workforce annual analysis, financial, business, marketing, planning. This is a completely editable PowerPoint presentation and is available for immediate download. Download now and impress your audience.
-
Business Data Analysis Chart Shows Changes Over The Time PowerPoint Templates
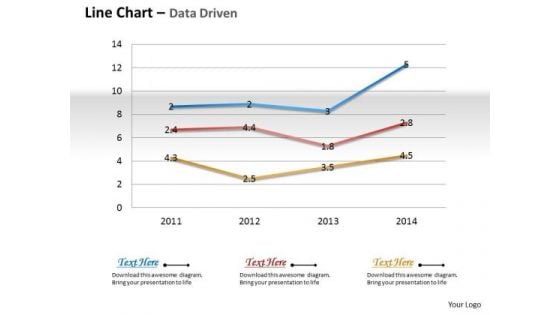
Document The Process On Our business data analysis chart shows changes over the time Powerpoint Templates. Make A Record Of Every Detail.
-
Financial Ratio Analysis Ppt PowerPoint Presentation Complete Deck With Slides
This is a financial ratio analysis ppt powerpoint presentation complete deck with slides. This is a one stage process. The stages in this process are business, strategy, analysis, pretention, finance.
-
Sample Financial Analysis Report Manufacturing Ppt PowerPoint Presentation Complete Deck With Slides
This is a sample financial analysis report manufacturing ppt powerpoint presentation complete deck with slides. This is a one stage process. The stages in this process are sample, financial, analysis, report, manufacturing.
-
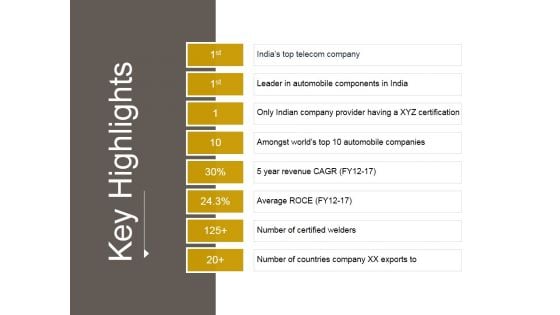
Key Highlights Ppt PowerPoint Presentation Show
This is a key highlights ppt powerpoint presentation show. This is a eight stage process. The stages in this process are india top telecom company, leader in automobile components in india, number of certified welders, average roce, number of countries company xx exports to.
-
Data Analysis Techniques 3d In Segments Pie Chart PowerPoint Templates
Drink To The Success Of Your Campaign. Our data analysis techniques 3d in segments pie chart Powerpoint Templates Will Raise A Toast.
-
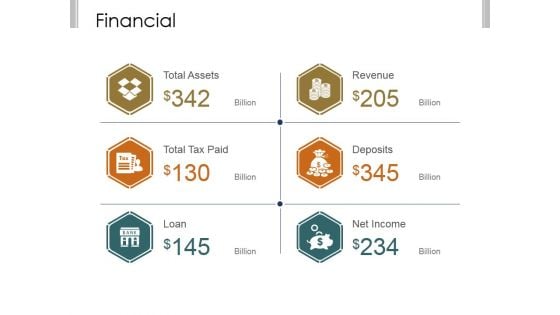
Financial Ppt PowerPoint Presentation Inspiration
This is a financial ppt powerpoint presentation inspiration. This is a six stage process. The stages in this process are total assets, total tax paid, loan, revenue, deposits, net income.
-
Segmentation Targeting And Positioning Ppt PowerPoint Presentation Complete Deck
This is a segmentation targeting and positioning ppt powerpoint presentation complete deck. This is a one stage process. The stages in this process are business, strategy, marketing, finance, work management.
-
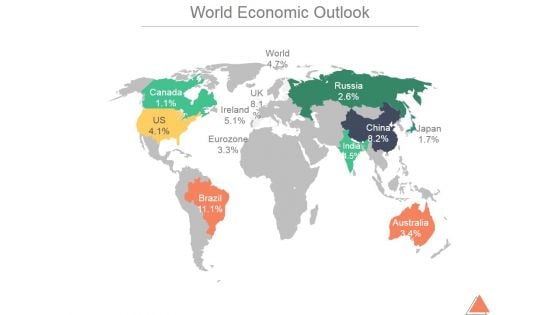
World Economic Outlook Ppt PowerPoint Presentation Background Image
This is a world economic outlook ppt powerpoint presentation background image. This is a twelve stage process. The stages in this process are business, marketing, management, location, outlook.
-
Market Expansion And Growth Editable World Map Ppt PowerPoint Presentation Portfolio Format Ideas
This is a market expansion and growth editable world map ppt powerpoint presentation portfolio format ideas. This is a five stage process. The stages in this process are business, strategy, marketing, analysis, finance, location.
-
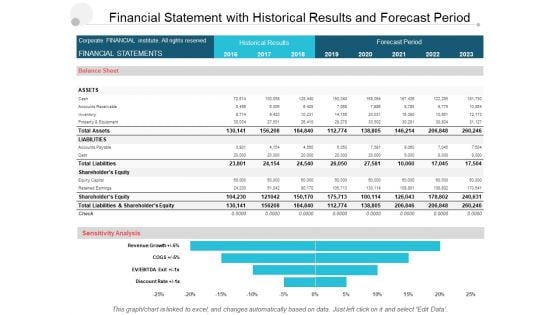
Financial Statement With Historical Results And Forecast Period Ppt PowerPoint Presentation Styles Graphics
Presenting this set of slides with name financial statement with historical results and forecast period ppt powerpoint presentation styles graphics. The topics discussed in these slides are financial analysis, balance sheet, income statement. This is a completely editable PowerPoint presentation and is available for immediate download. Download now and impress your audience.
-
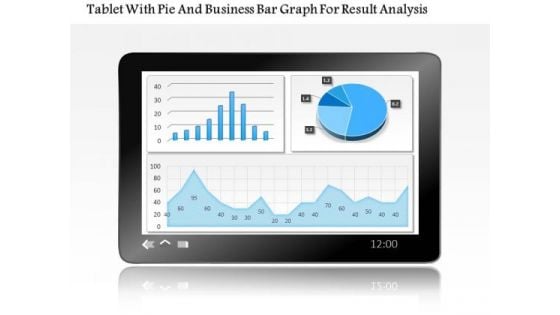
Business Diagram Tablet With Pie And Business Bar Graph For Result Analysis PowerPoint Slide
This PowerPoint template displays technology gadgets with various business charts. Use this diagram slide, in your presentations to make business reports for statistical analysis. You may use this diagram to impart professional appearance to your presentations.
-
Assets And Revenue Financial Summary Ppt PowerPoint Presentation Icon Picture
This is a assets and revenue financial summary ppt powerpoint presentation icon picture. This is a six stage process. The stages in this process are business, strategy, marketing, finance, analysis.
-
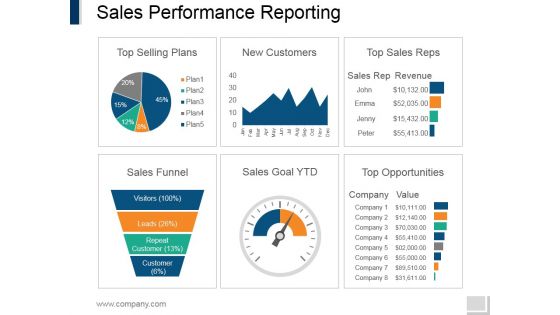
Sales Performance Reporting Ppt PowerPoint Presentation Model Summary
This is a sales performance reporting ppt powerpoint presentation model summary. This is a six stage process. The stages in this process are top selling plans, new customers, top sales reps, sales funnel, sales goal ytd, top opportunities.
-
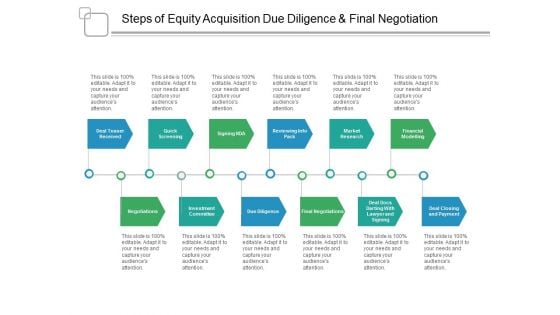
Steps Of Equity Acquisition Due Diligence And Final Negotiation Ppt PowerPoint Presentation Slides Master Slide
This is a steps of equity acquisition due diligence and final negotiation ppt powerpoint presentation slides master slide. This is a twelve stage process. The stages in this process are investment, funding, private equity, venture capital.
-
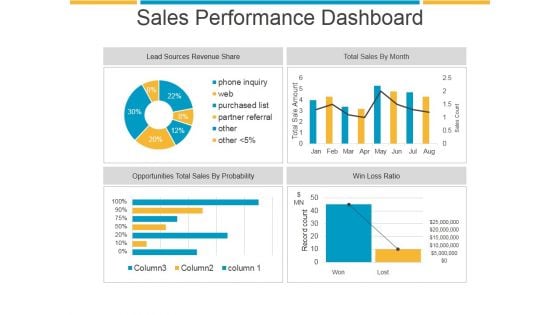
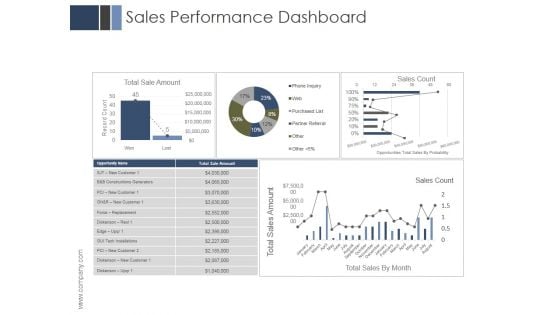
Sales Performance Dashboard Ppt PowerPoint Presentation Show
This is a sales performance dashboard ppt powerpoint presentation show. This is a four stage process. The stages in this process are lead sources revenue share, total sales by month, opportunities total sales by probability, win loss ratio.
-
Business Plan Venture Capital Funding Ppt PowerPoint Presentation Complete Deck With Slides
This is a business plan venture capital funding ppt powerpoint presentation complete deck with slides. This is a one stage process. The stages in this process are finance, business, capital, money, management.
-
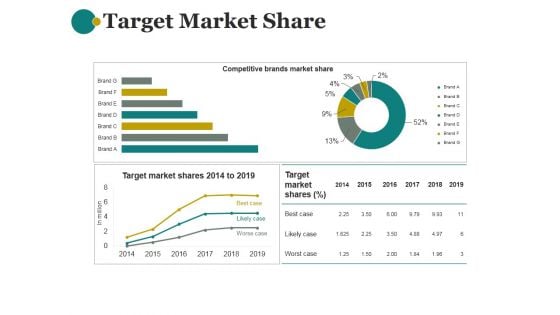
Target Market Share Ppt PowerPoint Presentation Introduction
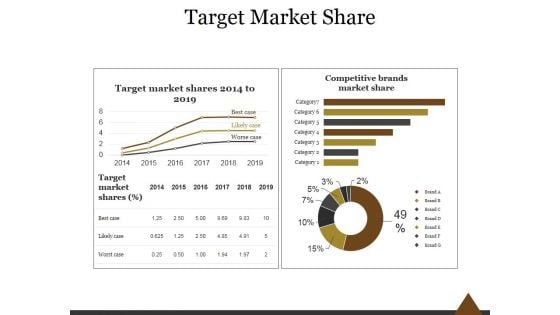
This is a target market share ppt powerpoint presentation introduction. This is a four stage process. The stages in this process are finance, marketing, planning ,business, management, strategy.
-
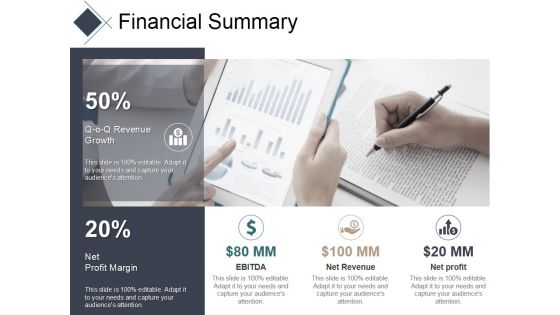
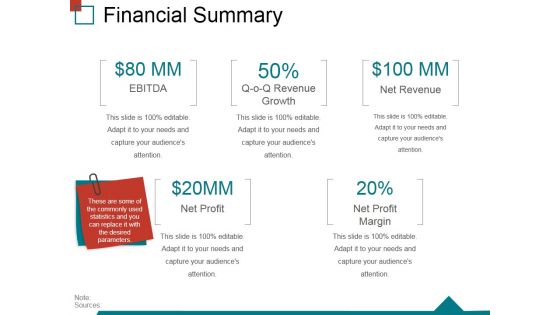
Financial Summary Ppt PowerPoint Presentation Professional Template
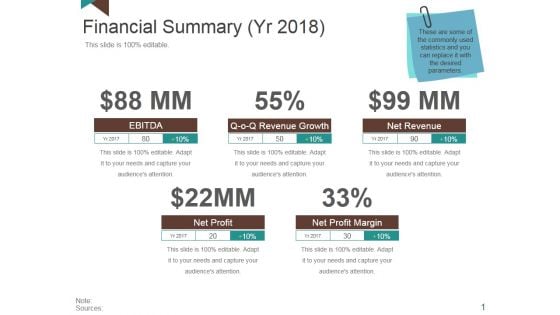
This is a financial summary ppt powerpoint presentation professional template. This is a two stage process. The stages in this process are revenue growth, net, profit margin, ebitda, net revenue, net profit.
-
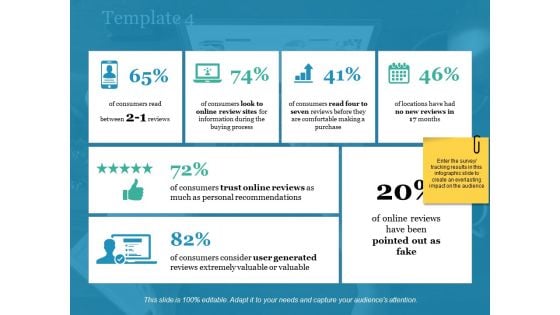
Template 4 Ppt PowerPoint Presentation Summary Demonstration
This is a template 4 ppt powerpoint presentation summary demonstration. This is a six stage process. The stages in this process are look to online review sites, read four to seven reviews before, no new reviews in 17, pointed out as fake.
-
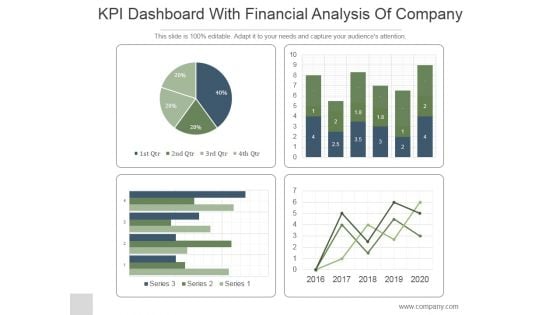
KPI Dashboard With Financial Analysis Of Company Ppt PowerPoint Presentation Backgrounds
This is a kpi dashboard with financial analysis of company ppt powerpoint presentation backgrounds. This is a four stage process. The stages in this process are business, strategy, marketing, line graph, finance.
-
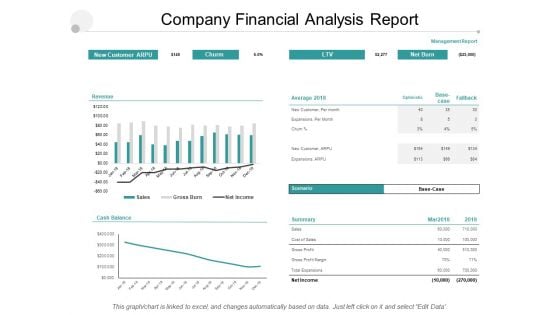
Company Financial Analysis Report Ppt PowerPoint Presentation Styles Diagrams
Presenting this set of slides with name company financial analysis report ppt powerpoint presentation styles diagrams. The topics discussed in these slides are financial analysis, balance sheet, income statement. This is a completely editable PowerPoint presentation and is available for immediate download. Download now and impress your audience.
-
Business Diagram Colored Column Chart For Result Analysis PowerPoint Slide
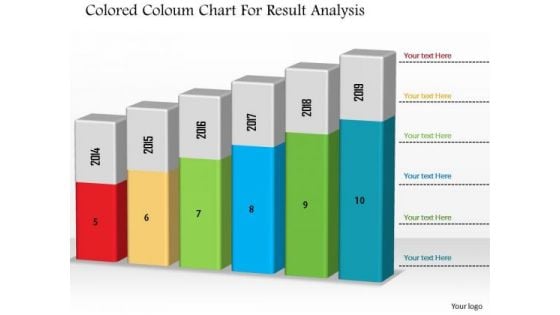
This Power Point diagram has been designed with graphic of column chart. It contains diagram of bar char depicting annual business progress report. Use this diagram to build professional presentations for your viewers.
-
Funding Pitch Deck Ppt PowerPoint Presentation Complete Deck With Slides
This complete deck acts as a great communication tool. It helps you in conveying your business message with personalized sets of graphics, icons etc. Comprising a set of twenty eight slides, this complete deck can help you persuade your audience. It also induces strategic thinking as it has been thoroughly researched and put together by our experts. Not only is it easily downloadable but also editable. The color, graphics, theme any component can be altered to fit your individual needs. So grab it now.
-
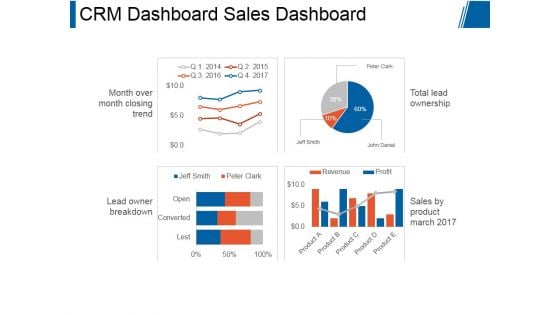
Crm Dashboard Sales Dashboard Template Ppt PowerPoint Presentation Microsoft
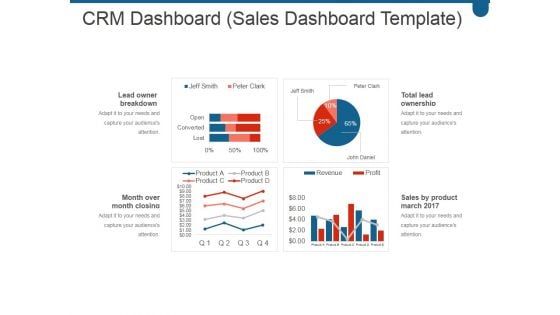
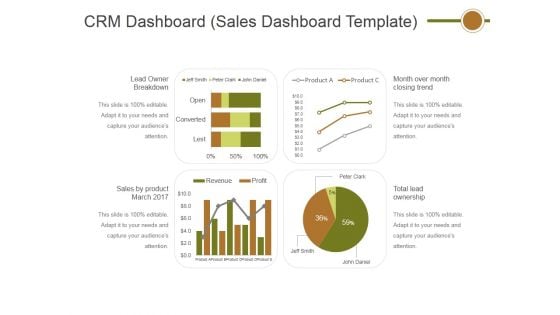
This is a crm dashboard sales dashboard template ppt powerpoint presentation microsoft. This is a four stage process. The stages in this process are lead owner breakdown, month over month closing trend, total lead ownership, sales by product march 2017.
-
Data Analysis Techniques 3d Bar Chart For Modification PowerPoint Templates
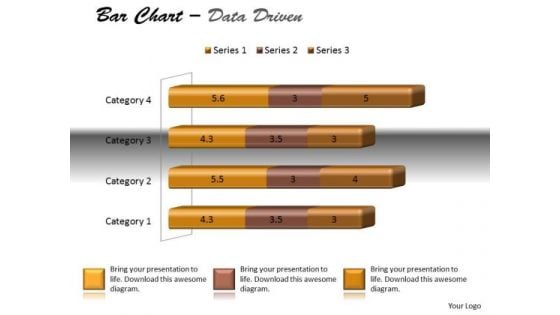
Dreams Generate Thoughts, Thoughts Generate Ideas. Give Them Life With Our data analysis techniques 3d bar chart for modification Powerpoint Templates .
-
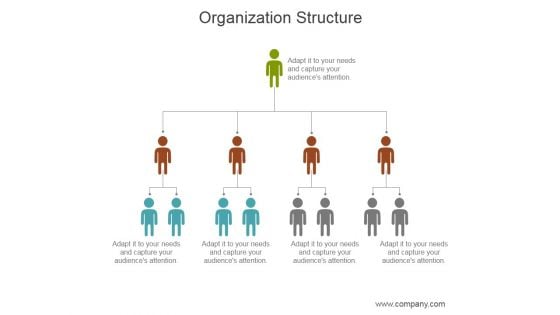
Organization Structure Ppt PowerPoint Presentation Inspiration
This is a organization structure ppt powerpoint presentation inspiration. This is a three stage process. The stages in this process are business, marketing, management, organization structure, analysis.
-
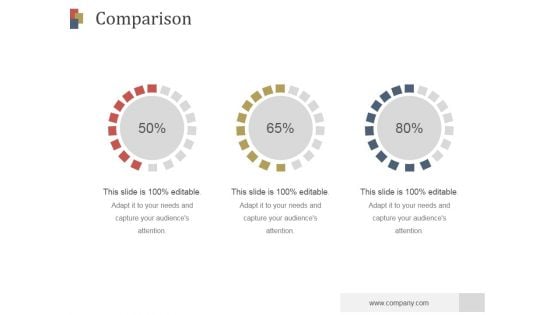
Comparison Ppt PowerPoint Presentation Guidelines
This is a comparison ppt powerpoint presentation guidelines. This is a three stage process. The stages in this process are finance, business, marketing, percentage, compare.
-
Data Analysis Excel Bar Graph To Compare PowerPoint Templates
Get The Domestics Right With Our data analysis excel bar graph to compare Powerpoint Templates. Create The Base For Thoughts To Grow.
-
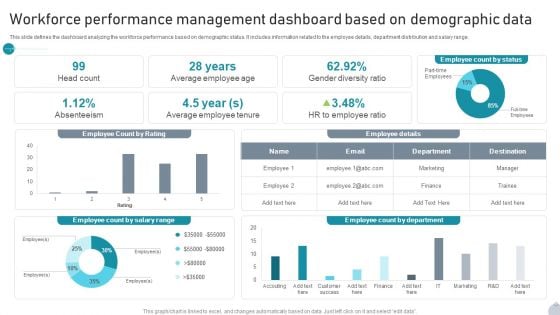
Workforce Performance Management Dashboard Based On Demographic Data Information PDF
This slide defines the dashboard analyzing the workforce performance based on demographic status. It includes information related to the employee details, department distribution and salary range. Showcasing this set of slides titled Workforce Performance Management Dashboard Based On Demographic Data Information PDF. The topics addressed in these templates are Employee Details, Department, Gender Diversity Ratio All the content presented in this PPT design is completely editable. Download it and make adjustments in color, background, font etc. as per your unique business setting.
-
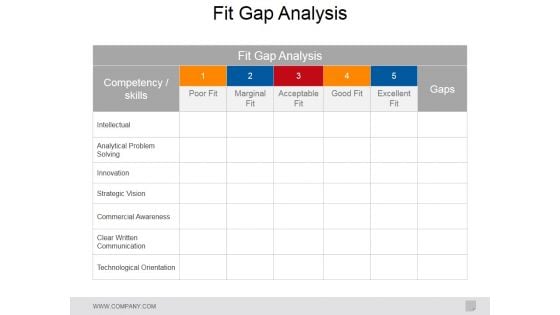
Fit Gap Analysis Ppt PowerPoint Presentation File Graphics Tutorials
This is a fit gap analysis ppt powerpoint presentation file graphics tutorials. This is a five stage process. The stages in this process are intellectual, analytical problem solving, innovation, strategic vision, commercial awareness, clear written communication, technological orientation.
-
Crm Dashboard Sales Dashboard Ppt PowerPoint Presentation Themes
This is a crm dashboard sales dashboard ppt powerpoint presentation themes. This is a four stage process. The stages in this process are month over month closing trend, lead owner breakdown, total lead ownership, sales by product march 2017.
-
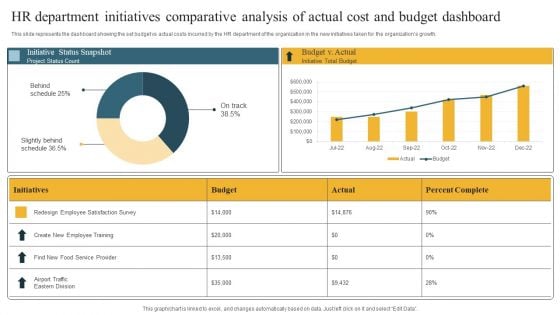
HR Department Initiatives Comparative Analysis Of Actual Cost And Budget Dashboard Introduction PDF
This slide represents the dashboard showing the set budget vs actual costs incurred by the HR department of the organization in the new initiatives taken for the organizations growth. Showcasing this set of slides titled HR Department Initiatives Comparative Analysis Of Actual Cost And Budget Dashboard Introduction PDF. The topics addressed in these templates are Behind Schedule, Slightly Behind Schedule, Initiative Status Snapshot. All the content presented in this PPT design is completely editable. Download it and make adjustments in color, background, font etc. as per your unique business setting.
-
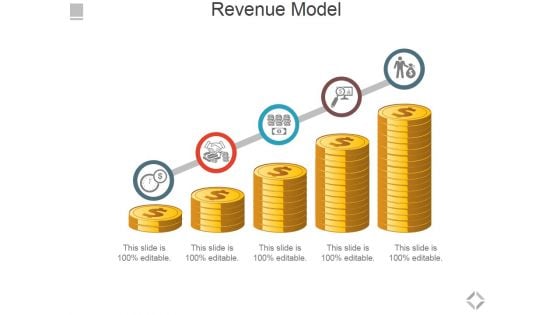
Revenue Model Ppt PowerPoint Presentation Slides Format
This is a revenue model ppt powerpoint presentation slides format. This is a five stage process. The stages in this process are business, financials, currency, growth, marketing.
-
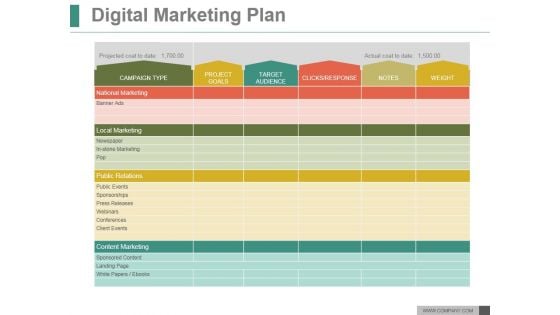
Digital Marketing Plan Ppt PowerPoint Presentation Example
This is a digital marketing plan ppt powerpoint presentation example. This is a five stage process. The stages in this process are national marketing, local marketing, public relations, content marketing.
-
Investment Strategies For Stock Portfolio Management Ppt PowerPoint Presentation Complete Deck With Slides
This is a investment strategies for stock portfolio management ppt powerpoint presentation complete deck with slides. This is a one stage process. The stages in this process are portfolio, management, business, growth, strategy.
-
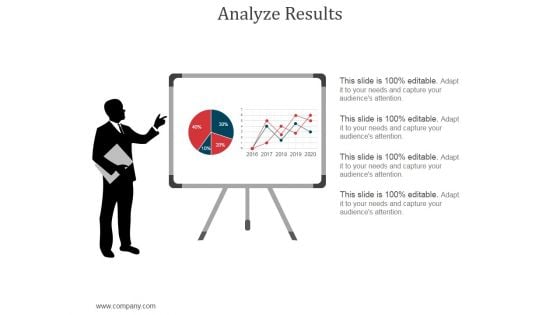
Analyze Results Ppt PowerPoint Presentation Slide
This is a analyze results ppt powerpoint presentation slide. This is a two stage process. The stages in this process are analysis, business, marketing, finance, pie chart.
-
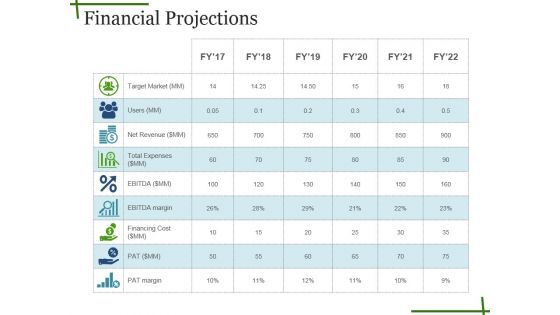
Financial Projections Ppt PowerPoint Presentation Show Format
This is a financial projections ppt powerpoint presentation show format. This is a six stage process. The stages in this process are total assets, total tax paid, loan, revenue, deposits.
-
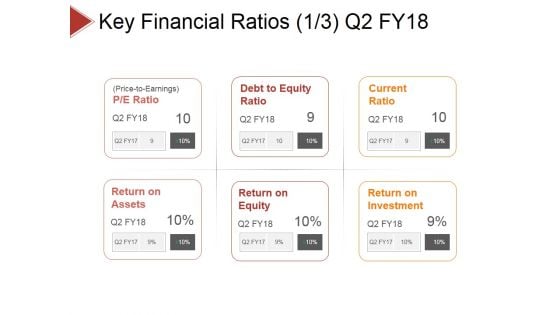
Key Financial Ratios Template 1 Ppt PowerPoint Presentation Layouts Guidelines
This is a key financial ratios template 1 ppt powerpoint presentation layouts guidelines. This is a six stage process. The stages in this process are price to earnings, debt to equity ratio, current ratio, return on, equity, return on , assets, return on investment.
-
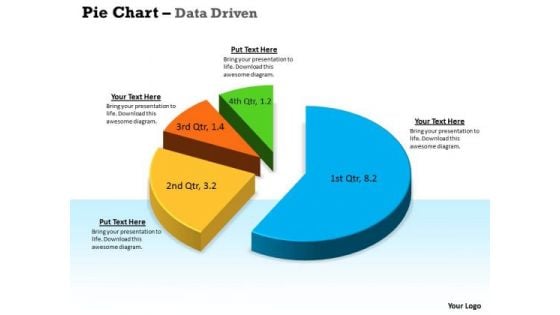
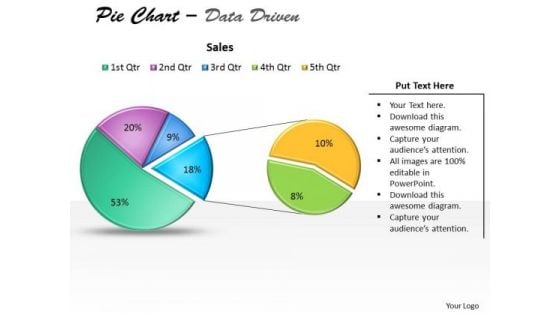
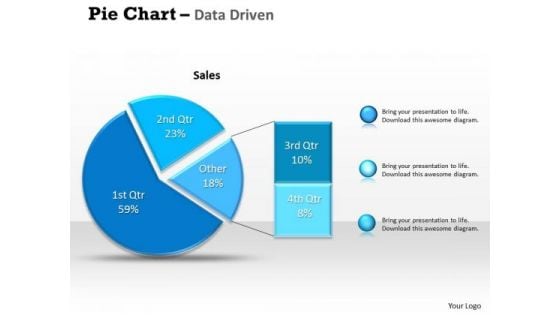
Data Analysis Excel Driven Pie Chart For Business Stratregy PowerPoint Slides Templates
Open Up Doors That Lead To Success. Our data analysis excel driven pie chart for business stratregy powerpoint slides Templates Provide The Handles.
-
Financial Summary Ppt PowerPoint Presentation Layouts Portrait
This is a financial summary ppt powerpoint presentation layouts portrait. This is a four stage process. The stages in this process are ebitda, revenue growth, net revenue, net profit margin, net profit.
-
Product Pricing Template 2 Ppt PowerPoint Presentation Themes
This is a product pricing template 2 ppt powerpoint presentation themes. This is a four stage process. The stages in this process are regular, advanced, ultimate, thrifty.
-
Crowd Funding For Business Startups Ppt PowerPoint Presentation Complete Deck With Slides
This is a crowd funding for business startups ppt powerpoint presentation complete deck with slides. This is a one stage process. The stages in this process are business, strategy, finance, planning, management.
-
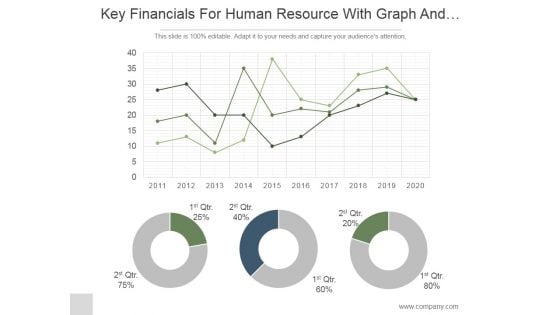
Key Financials For Human Resource With Graph And Pie Chart Ppt PowerPoint Presentation Ideas
This is a key financials for human resource with graph and pie chart ppt powerpoint presentation ideas. This is a three stage process. The stages in this process are business, strategy, marketing, analysis, donut, growth.
-
Business Data Analysis Chart For Case Studies PowerPoint Templates
Get Out Of The Dock With Our business data analysis chart for case studies Powerpoint Templates. Your Mind Will Be Set Free.
-
Data Analysis Excel 3d Pie Chart For Marketing Process PowerPoint Templates
Our data analysis excel 3d pie chart for marketing process Powerpoint Templates Team Are A Dogged Lot. They Keep At It Till They Get It Right.
-
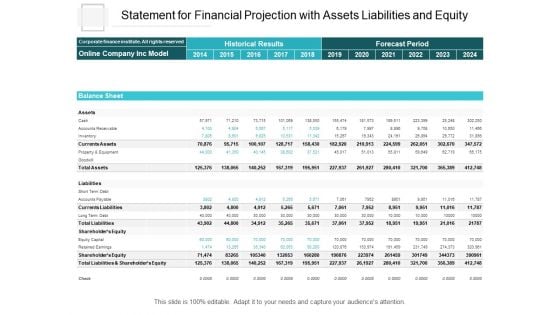
Statement For Financial Projection With Assets Liabilities And Equity Ppt PowerPoint Presentation Styles Designs
Presenting this set of slides with name statement for financial projection with assets liabilities and equity ppt powerpoint presentation styles designs. The topics discussed in these slides are financial analysis, balance sheet, income statement. This is a completely editable PowerPoint presentation and is available for immediate download. Download now and impress your audience.
-
Financial Plan Ppt PowerPoint Presentation Complete Deck With Slides
This is a financial plan ppt powerpoint presentation complete deck with slides. This is a one stage process. The stages in this process are business, marketing, finance, planning, analysis.
-
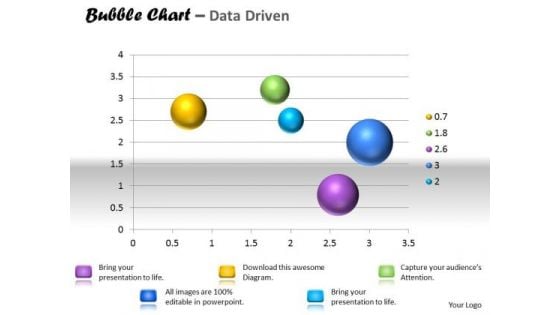
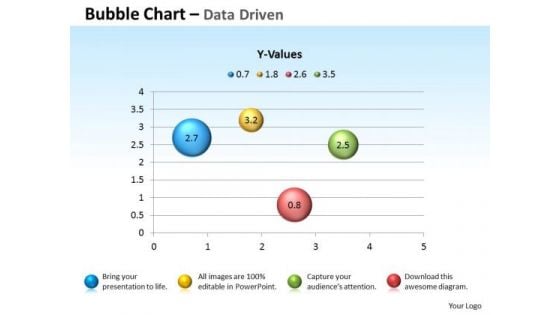
Data Analysis Template Interactive Bubble Chart PowerPoint Templates
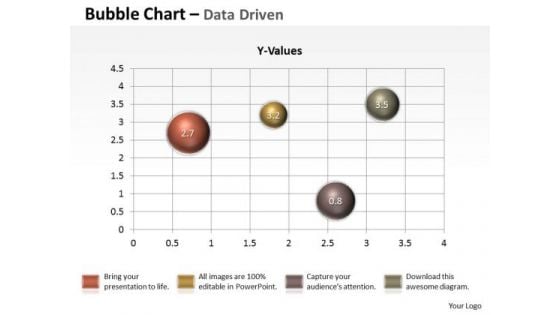
Our data analysis template interactive bubble chart Powerpoint Templates Are A Wonder Drug. They Help Cure Almost Any Malaise.
-
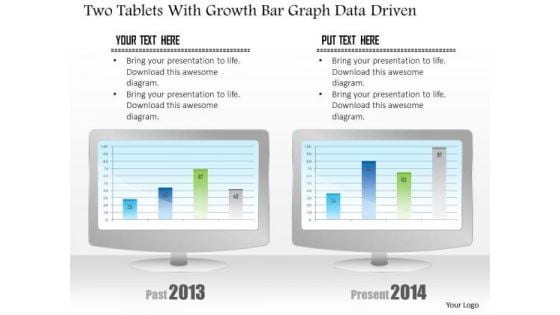
Business Diagram Two Tablets With Growth Bar Graph Data Driven PowerPoint Slide
This business diagram has been designed with comparative charts on tablets. This slide suitable for data representation. You can also use this slide to present business reports and information. Use this diagram to present your views in a wonderful manner.
-
Business Diagram Four Pie Chart For Data Driven Result Analysis Of Business PowerPoint Slide
This business diagram displays graphic of pie charts in shape of flasks. This business slide is suitable to present and compare business data. Use this diagram to build professional presentations for your viewers.
-
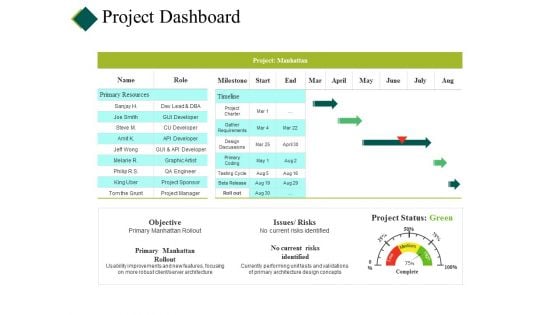
Project Dashboard Ppt PowerPoint Presentation Pictures Backgrounds
This is a project dashboard ppt powerpoint presentation pictures backgrounds. This is a four stage process. The stages in this process are cost, planning, table, project report, data management.
-
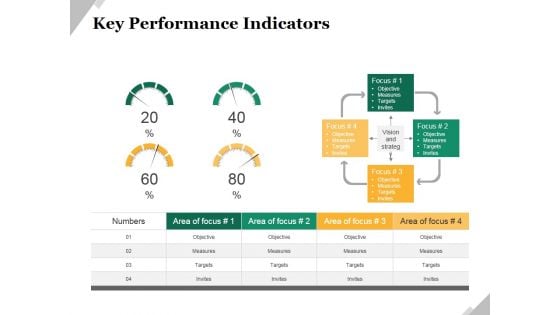
Key Performance Indicators Template 2 Ppt PowerPoint Presentation Model Example
This is a key performance indicators template 2 ppt powerpoint presentation model example. This is a four stage process. The stages in this process are objective, measures, targets, invites, indicators.
-
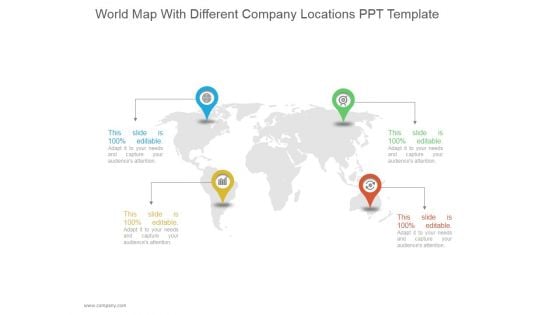
World Map With Different Company Locations Ppt PowerPoint Presentation Templates
This is a world map with different company locations ppt powerpoint presentation templates. This is a four stage process. The stages in this process are business, strategy, location, map, geography, icons, analysis.
-
Decision Making Process In Managerial Economics PPT PowerPoint Presentation Complete Deck With Slides
This is a decision making process in managerial economics ppt powerpoint presentation complete deck with slides. This is a one stage process. The stages in this process are financial, financial analysis, economics, decision, process making.
-
Quantitative Data Analysis 3d Percentage Ratio Pie Chart PowerPoint Templates
Plan Your Storyboard With Our quantitative data analysis 3d percentage ratio pie chart Powerpoint Templates . Give An Outline To The Solutions You Have.
-
Data Analysis Techniques 3d Effective Display Chart PowerPoint Templates
Dribble Away With Our data analysis techniques 3d effective display chart Powerpoint Templates . Score A Goal With Your Ideas.
-
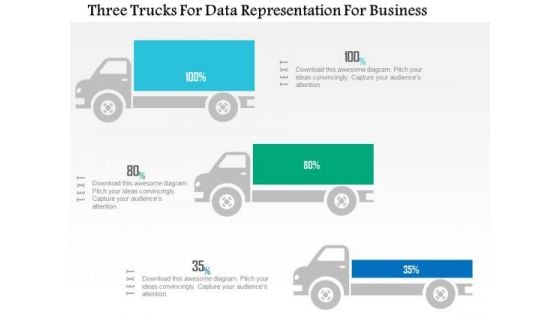
Business Diagram Three Trucks For Data Representation For Business PowerPoint Slide
This business diagram displays three trucks graphic. This diagram contains trucks for percentage value growth. Use this diagram to display business growth over a period of time.
-
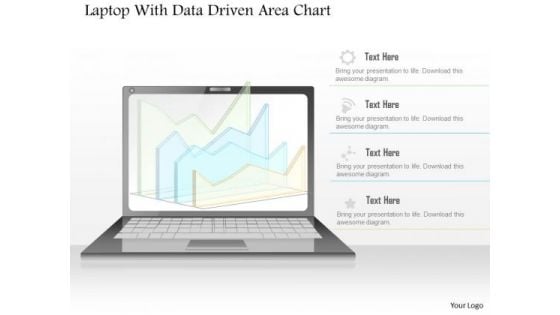
Business Diagram Laptop With Data Driven Area Chart PowerPoint Slide
This diagram has been designed with laptop and data driven area chart. Download this diagram to give your presentations more effective look. It helps in clearly conveying your message to clients and audience.
-
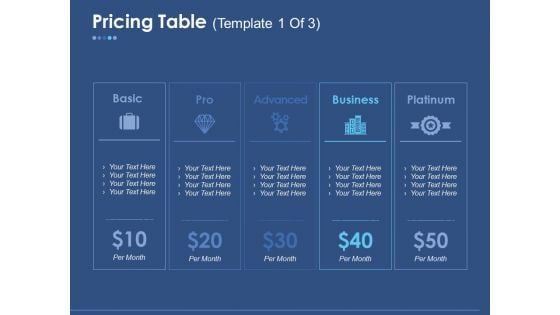
Pricing Table Ppt PowerPoint Presentation Slides Graphics
This is a pricing table ppt powerpoint presentation slides graphics. This is a three stage process. The stages in this process are basic, pro, advanced, business, platinum.
-
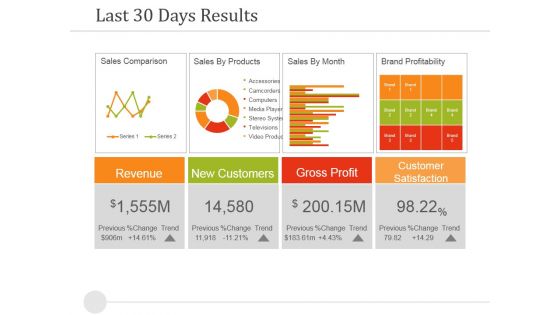
Last 30 Days Results Ppt PowerPoint Presentation Summary Brochure
This is a last 30 days results ppt powerpoint presentation summary brochure. This is a four stage process. The stages in this process are revenue, new customers, gross profit, customer satisfaction.
-
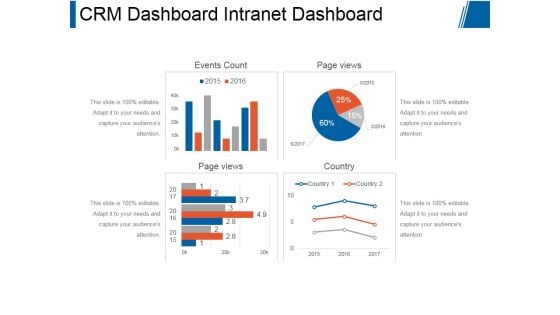
Crm Dashboard Intranet Dashboard Ppt PowerPoint Presentation Model
This is a crm dashboard intranet dashboard ppt powerpoint presentation model. This is a four stage process. The stages in this process are events count, page views, page views, country.
-
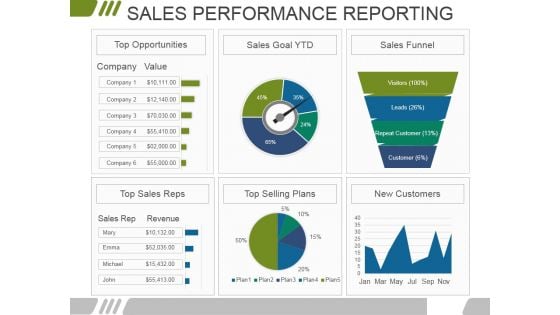
Sales Performance Reporting Ppt PowerPoint Presentation Ideas Pictures
This is a sales performance reporting ppt powerpoint presentation ideas pictures. This is a six stage process. The stages in this process are top opportunities, sales goal, sales funnel, new customers, top selling plans, top sales reps.
-
Data Analysis Techniques 3d Grouped Bar Chart PowerPoint Templates
Place The Orders With Your Thoughts. Our data analysis techniques 3d grouped bar chart Powerpoint Templates Know The Drill.
-
Excel Data Analysis Data Tools Data Methods Statistical Chart For Process PowerPoint Templates
Blend Your Views With Our excel data analysis data tools data methods statistical chart for process Powerpoint Templates . They Are Made For Each Other.
-
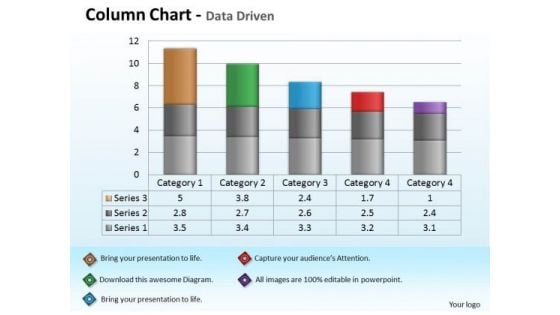
Quantitative Data Analysis Driven Economic With Column Chart PowerPoint Slides Templates
Add Some Dramatization To Your Thoughts. Our quantitative data analysis driven economic with column chart powerpoint slides Templates Make Useful Props.
-
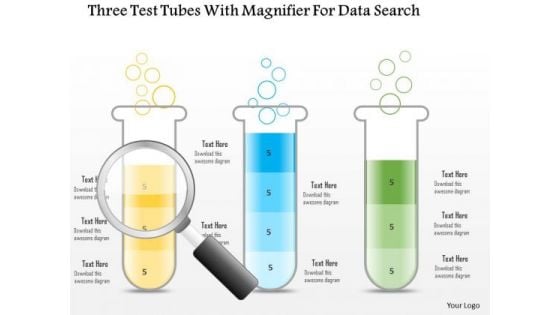
Business Diagram Three Test Tubes With Magnifier For Data Search PowerPoint Slide
This business diagram displays three test tubes with magnifying glass. This diagram is suitable to depict flow of business activities or steps. Download this professional slide to present information in an attractive manner.
-
Business Diagram Six Staged Pie Charts For Text Representation PowerPoint Slide
This slide displays graphic six staged pie charts. Download this diagram to present and compare business data. Use this diagram to display business process workflows in any presentation.
-
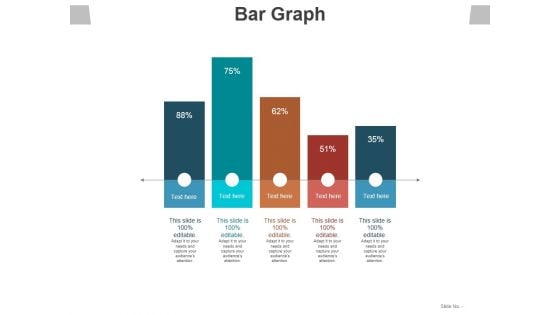
Bar Graph Ppt PowerPoint Presentation Slides Designs
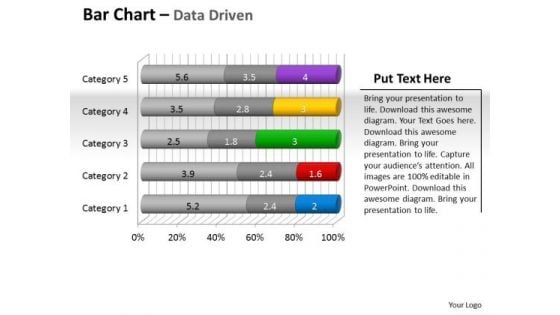
This is a bar graph ppt powerpoint presentation slides designs. This is a five stage process. The stages in this process are bar graph, business, marketing, plan, financial.
-
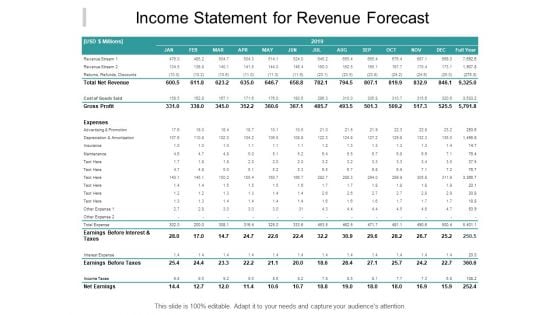
Income Statement For Revenue Forecast Ppt PowerPoint Presentation Show Display
Presenting this set of slides with name income statement for revenue forecast ppt powerpoint presentation show display. The topics discussed in these slides are financial analysis, balance sheet, income statement. This is a completely editable PowerPoint presentation and is available for immediate download. Download now and impress your audience.
-
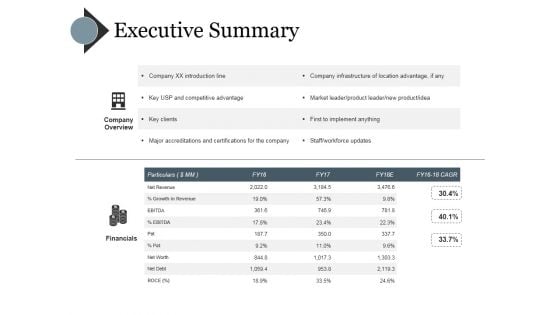
Executive Summary Ppt PowerPoint Presentation Outline Elements
This is a executive summary ppt powerpoint presentation outline elements. This is a two stage process. The stages in this process are company xx introduction line, key usp and competitive advantage, key clients, major accreditations and certifications for the company, company infrastructure of location advantage, if any.
-
Financial Analysis Asset Allocation Report Ppt PowerPoint Presentation Slides Objects
Presenting this set of slides with name financial analysis asset allocation report ppt powerpoint presentation slides objects. The topics discussed in these slides are financial analysis, balance sheet, income statement. This is a completely editable PowerPoint presentation and is available for immediate download. Download now and impress your audience.
-
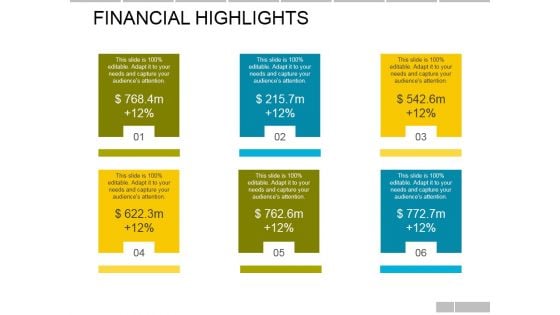
Financial Highlights Ppt PowerPoint Presentation Portfolio Show
This is a financial highlights ppt powerpoint presentation portfolio show. This is a three stage process. The stages in this process are business, marketing, finance, analysis, planning.
-
Examples Of Data Analysis Market 3d Business Trend Series Chart PowerPoint Templates
Duct It Through With Our examples of data analysis market 3d business trend series chart Powerpoint Templates . Your Ideas Will Reach Into Their Minds Intact.
-
Crm Dashboard Sales Dashboard Template Ppt PowerPoint Presentation Professional Layout
This is a crm dashboard sales dashboard template ppt powerpoint presentation professional layout. This is a four stage process. The stages in this process are lead owner breakdown, sales by product march 2017, total lead ownership, month over month closing trend.
-
Client Planner Comparison Worksheet For Establishing Financial Direction Ppt PowerPoint Presentation Deck
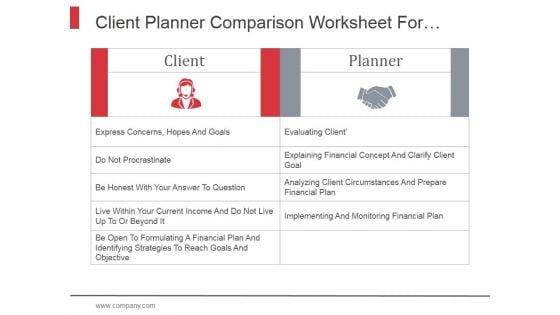
This is a client planner comparison worksheet for establishing financial direction ppt powerpoint presentation deck. This is a two stage process. The stages in this process are worksheet, financial direction, communication, financial analysis.
-
Funnel Ppt PowerPoint Presentation Slides
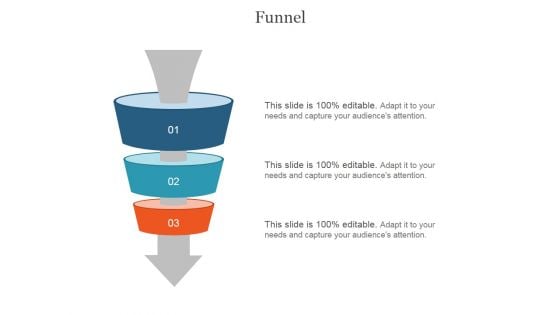
This is a funnel ppt powerpoint presentation slides. This is a three stage process. The stages in this process are business, marketing, management, funnel, process.
-
Financial Ppt PowerPoint Presentation Summary Background Designs
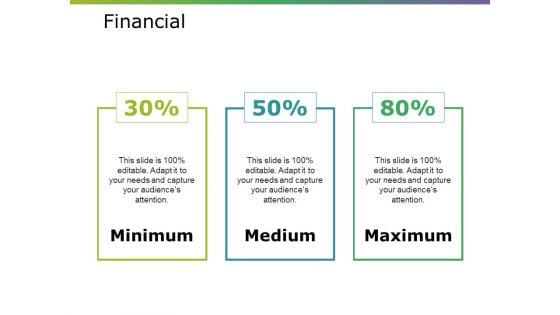
This is a financial ppt powerpoint presentation summary background designs. This is a three stage process. The stages in this process are minimum, medium, maximum.
-
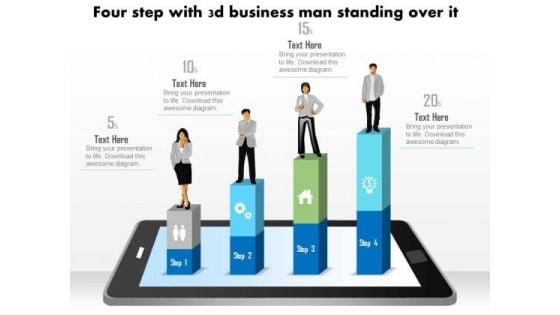
Business Diagram Four Steps With 3d Business Person Standing Over It PowerPoint Slide
This business diagram displays bar graph with business person standing on it. This Power Point template has been designed to display personal growth. You may use this diagram to impart professional appearance to your presentations.
-
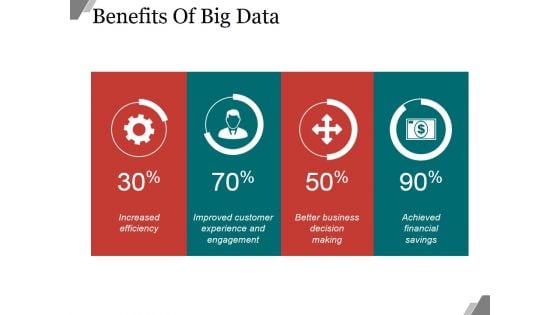
Benefits Of Big Data Ppt PowerPoint Presentation Example 2015
This is a benefits of big data ppt powerpoint presentation example 2015. This is a four stage process. The stages in this process are business, marketing, success, finance, analysis.
-
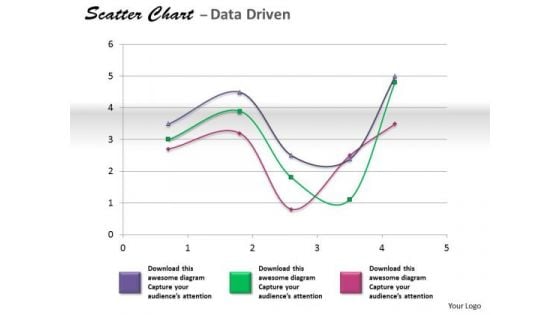
Financial Data Analysis Coordinate With Scatter Chart PowerPoint Templates
Get The Doers Into Action. Activate Them With Our financial data analysis coordinate with scatter chart Powerpoint Templates .
-
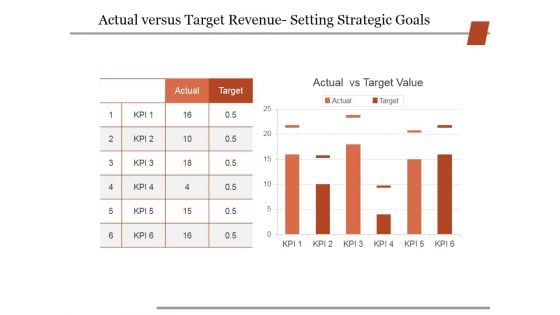
Actual Versus Target Revenue Setting Strategic Goals Ppt PowerPoint Presentation Outline Show
This is a actual versus target revenue setting strategic goals ppt powerpoint presentation outline show. This is a two stage process. The stages in this process are business, strategy, marketing, finance, analysis.
-
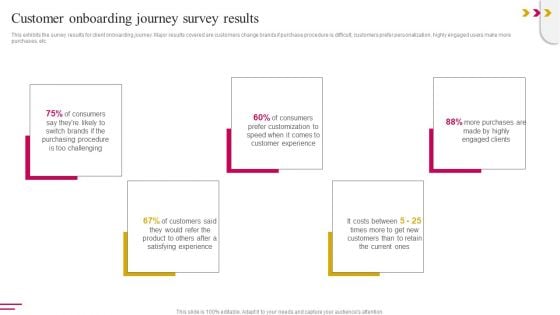
Customer Onboarding Journey Survey Results Clipart PDF
This exhibits the survey results for client onboarding journey. Major results covered are customers change brands if purchase procedure is difficult, customers prefer personalization, highly engaged users make more purchases, etc. Crafting an eye-catching presentation has never been more straightforward. Let your presentation shine with this tasteful yet straightforward Customer Onboarding Journey Survey Results Clipart PDF template. It offers a minimalistic and classy look that is great for making a statement. The colors have been employed intelligently to add a bit of playfulness while still remaining professional. Construct the ideal Customer Onboarding Journey Survey Results Clipart PDF that effortlessly grabs the attention of your audience Begin now and be certain to wow your customers
-
Quantitative Methods In Investment Management Ppt PowerPoint Presentation Complete Deck With Slides
This is a quantitative methods in investment management ppt powerpoint presentation complete deck with slides. This is a one stage process. The stages in this process are methods, investment, management, currency, finance.
-
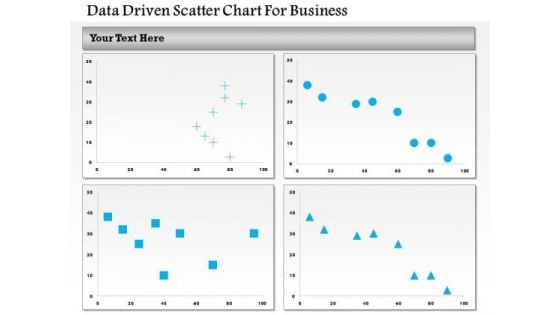
Business Diagram Data Driven Scatter Chart For Business PowerPoint Slide
This business diagram has been designed with four comparative charts. This slide suitable for data representation. You can also use this slide to present business analysis and reports. Use this diagram to present your views in a wonderful manner.
-
Business Diagram 3d Capsule With Multiple Icons For Business Data Flow PowerPoint Slide
This diagram has been designed with 3d graphic of capsule with multiple icons. This data driven PowerPoint slide can be used to give your presentations more effective look. It helps in clearly conveying your message to clients and audience.
-
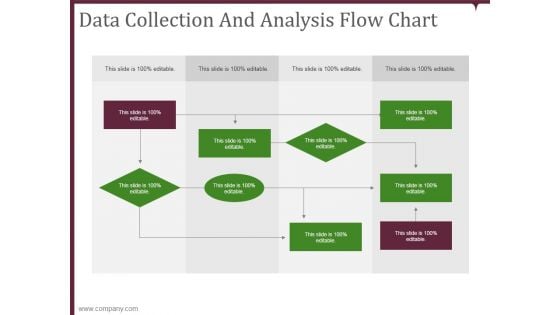
data collection and analysis flow chart ppt powerpoint presentation microsoft
This is a data collection and analysis flow chart ppt powerpoint presentation microsoft. This is a nine stage process. The stages in this process are business, planning, marketing, strategy, management.
-
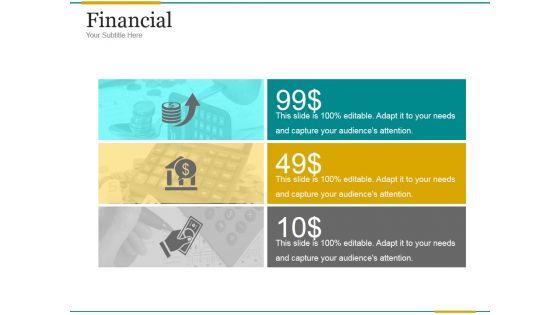
Financial Ppt PowerPoint Presentation Designs Download
This is a financial ppt powerpoint presentation designs download. This is a three stage process. The stages in this process are business, finances, success, strategy, management.
-
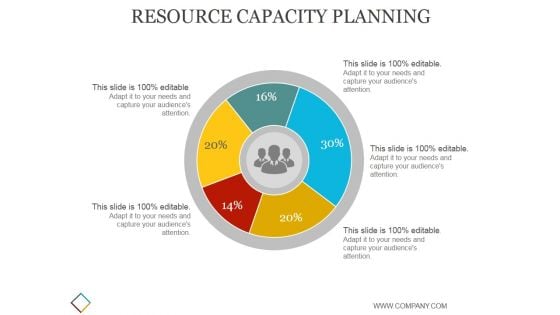
Resource Capacity Planning Ppt PowerPoint Presentation Diagrams
This is a resource capacity planning ppt powerpoint presentation diagrams. This is a five stage process. The stages in this process are business, strategy, marketing, analysis, finance.
-
Data Analysis Excel Driven Percentage Breakdown Pie Chart PowerPoint Slides Templates
Be A Donor Of Great Ideas. Display Your Charity On Our data analysis excel driven percentage breakdown pie chart powerpoint slides Templates.
-
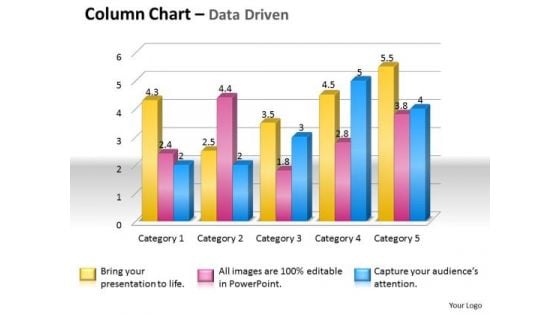
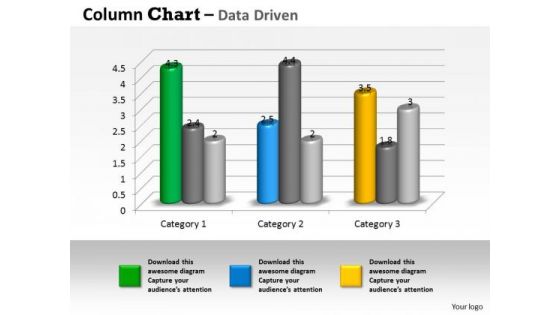
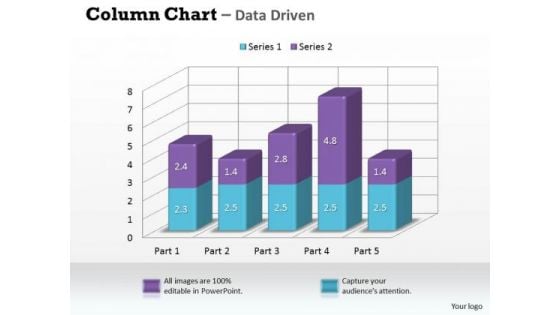
Data Analysis In Excel 3d Column Chart For Market Surveys PowerPoint Templates
Our data analysis in excel 3d column chart for market surveys Powerpoint Templates Leave No One In Doubt. Provide A Certainty To Your Views.
-
Data Analysis In Excel 3d Column Chart To Represent Information PowerPoint Templates
Rake In The Dough With
-
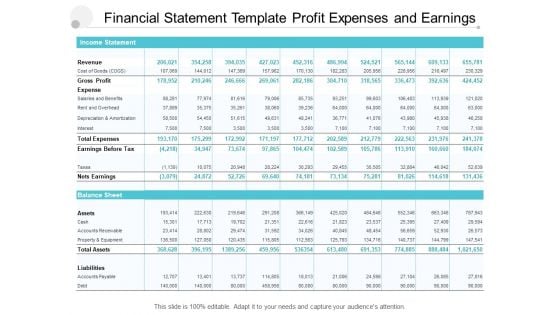
Financial Statement Template Profit Expenses And Earnings Ppt PowerPoint Presentation Model Inspiration
Presenting this set of slides with name financial statement template profit expenses and earnings ppt powerpoint presentation model inspiration. The topics discussed in these slides are financial analysis, balance sheet, income statement. This is a completely editable PowerPoint presentation and is available for immediate download. Download now and impress your audience.
-
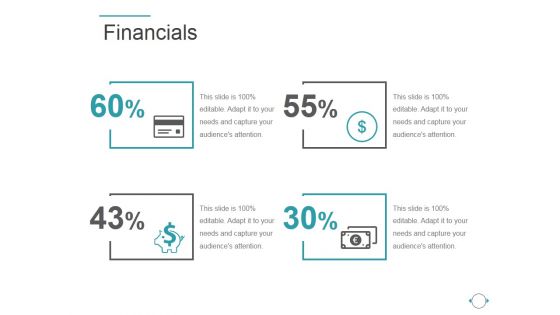
Financials Ppt PowerPoint Presentation Clipart
This is a financials ppt powerpoint presentation clipart. This is a four stage process. The stages in this process are icons, percentage, finance, success, strategy.
-
Website Performance Review Template 1 Ppt PowerPoint Presentation Model Guidelines
This is a website performance review template 1 ppt powerpoint presentation model guidelines. This is a six stage process. The stages in this process are online transaction, conversion rate, traffic source, site consumption time, top mobile devices branding.
-
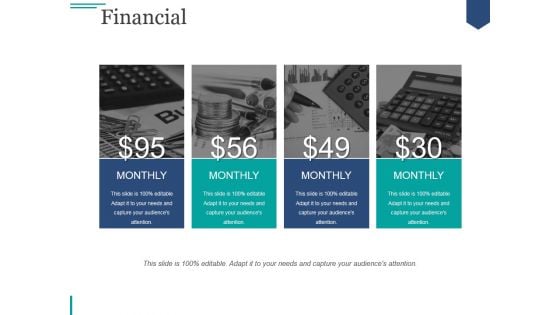
Financial Ppt PowerPoint Presentation Introduction
This is a financial ppt powerpoint presentation introduction. This is a four stage process. The stages in this process are business, marketing, finance, management, monthly.
-
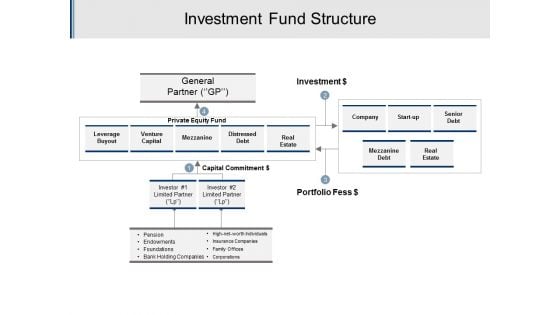
Investment Fund Structure Ppt PowerPoint Presentation Model Summary
This is a investment fund structure ppt powerpoint presentation model summary. This is a four stage process. The stages in this process are investment, funding, private equity, venture capital.
-
Financial Summary Ppt PowerPoint Presentation Ideas Slide Portrait
This is a financial summary ppt powerpoint presentation ideas slide portrait. This is a five stage process. The stages in this process are ebitda, revenue growth, net revenue, net profit, net profit, margin.
-
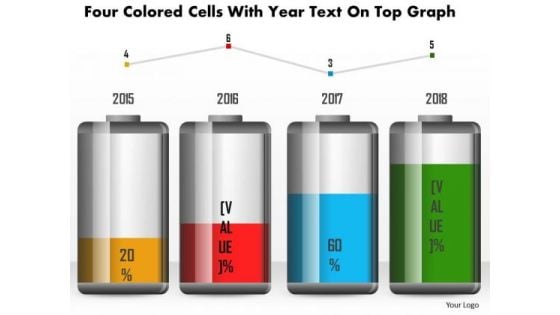
Business Diagram Four Colored Cells With Year Text On Top Graph PowerPoint Slide
This business diagram has been designed with battery cell graphic for business timeline. This slide can be used for business planning and management. Use this diagram for your business and success milestones related presentations.
-
Business Diagram Data Driven Pie Chart Inside The Magnifier PowerPoint Slide
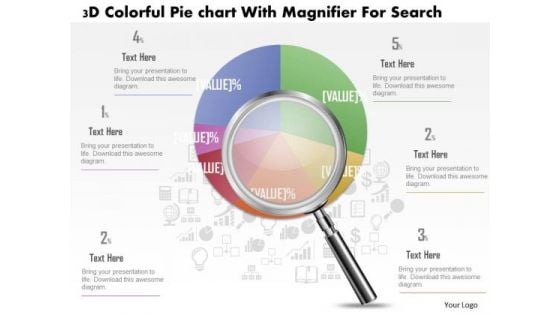
This business slide displays 3d colorful pie graph with magnifier. This diagram is a data visualization tool that gives you a simple way to present statistical information. This slide helps your audience examine and interpret the data you present.
-
Business Diagram Data Driven Bar Graph And Pie Chart For Analysis PowerPoint Slide
This PowerPoint template displays technology gadgets with various business charts. Use this diagram slide, in your presentations to make business reports for statistical analysis. You may use this diagram to impart professional appearance to your presentations.
-
Business Diagram 3d Colorful Pie Graph With Magnifier Data Search PowerPoint Slide
This business slide displays 3d colorful pie graph with magnifier. This diagram is a data visualization tool that gives you a simple way to present statistical information. This slide helps your audience examine and interpret the data you present.
-
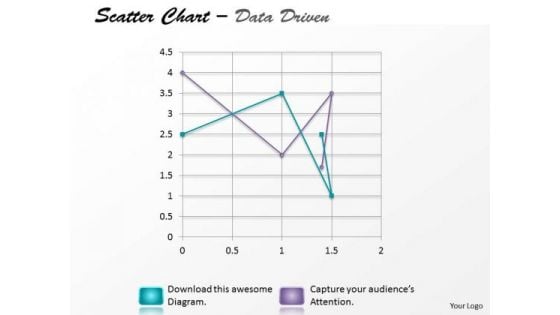
Data Analysis Excel Driven Multiple Series Scatter Chart PowerPoint Slides Templates
Your Listeners Will Never Doodle. Our data analysis excel driven multiple series scatter chart powerpoint slides Templates Will Hold Their Concentration.
-
Data Analysis Programs 3d Bar Chart To Put Information PowerPoint Templates
Draw Up Your Agenda On Our data analysis programs 3d bar chart to put information Powerpoint Templates . Coax Your Audience Into Acceptance.
-
Data Analysis Techniques 3d Graphical Presentation Of PowerPoint Templates
Our data analysis techniques 3d graphical presentation of Powerpoint Templates Will Follow The Drill. They Accomplish The Task Assigned To Them.
-
Microsoft Excel Data Analysis 3d Area Chart For Time Based PowerPoint Templates
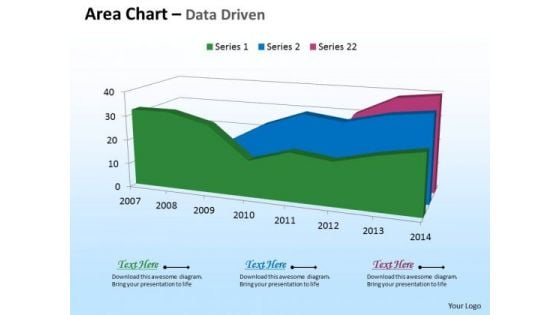
Deliver The Right Dose With Our microsoft excel data analysis 3d area chart for time based Powerpoint Templates . Your Ideas Will Get The Correct Illumination.
-
Microsoft Excel Data Analysis Bar Chart To Handle PowerPoint Templates
Our microsoft excel data analysis bar chart to handle Powerpoint Templates And Your Ideas Make A Great Doubles Pair. Play The Net With Assured Hands.
-
Summary Financials Revenue Ebitda Pat Ppt PowerPoint Presentation Layout
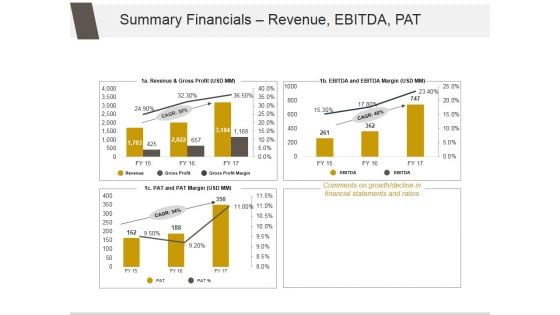
This is a summary financials revenue ebitda pat ppt powerpoint presentation layout. This is a three stage process. The stages in this process are comments on growth decline in financial statements and ratios.
-
Target Market Ppt PowerPoint Presentation Sample
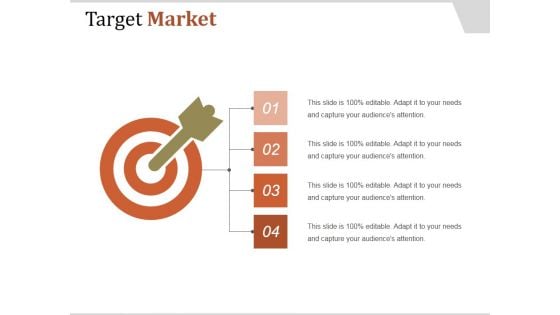
This is a target market ppt powerpoint presentation sample. This is a four stage process. The stages in this process are competitive brands market share, target market shares, financial years.
-
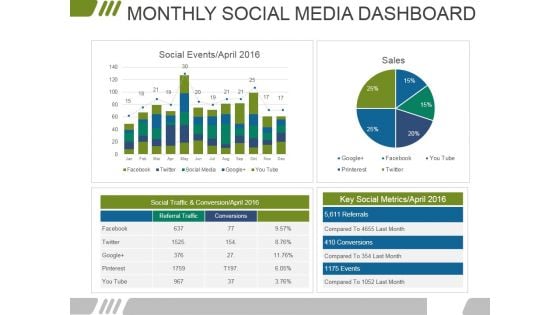
Monthly Social Media Dashboard Ppt PowerPoint Presentation Infographics Files
This is a monthly social media dashboard ppt powerpoint presentation infographics files. This is a four stage process. The stages in this process are marketing, business, financial, data analysis, management.
-
Sales Performance Dashboard Ppt PowerPoint Presentation Example 2015
This is a sales performance dashboard ppt powerpoint presentation example 2015. This is a four stage process. The stages in this process are business, marketing, management, finance, dashboard.
-
Crm Dashboard Current Lead Status Ppt PowerPoint Presentation Guide
This is a crm dashboard current lead status ppt powerpoint presentation guide. This is a six stage process. The stages in this process are business, marketing, success, presentation, financial.
-
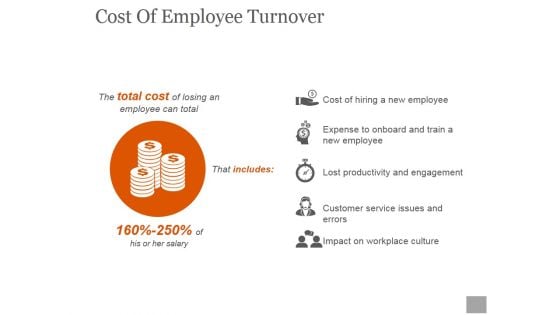
Cost Of Employee Turnover Ppt PowerPoint Presentation Deck
This is a cost of employee turnover ppt powerpoint presentation deck. This is a five stage process. The stages in this process are cost of hiring a new employee, expense to onboard and train a new employee, lost productivity and engagement, customer service issues and errors, impact on workplace culture.
-
Competitor Analysis 2 X 2 Matrix Ppt PowerPoint Presentation Deck
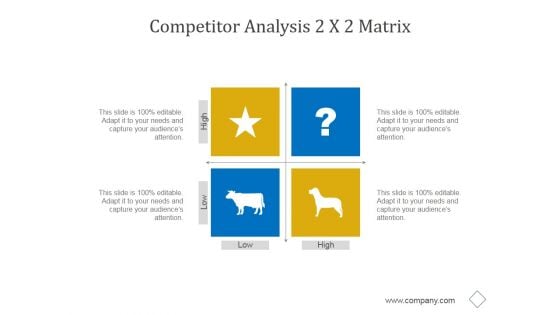
This is a competitor analysis 2 x 2 matrix ppt powerpoint presentation deck. This is a four stage process. The stages in this process are business, marketing, management, matrix, analysis.
-
Helping Clients Develop A Household Budget Ppt PowerPoint Presentation Complete Deck With Slides
This is a helping clients develop a household budget ppt powerpoint presentation complete deck with slides. This is a one stage process. The stages in this process are business, analysis, technology, management, finance.
-
Customer Satisfaction Ppt PowerPoint Presentation Gallery Rules
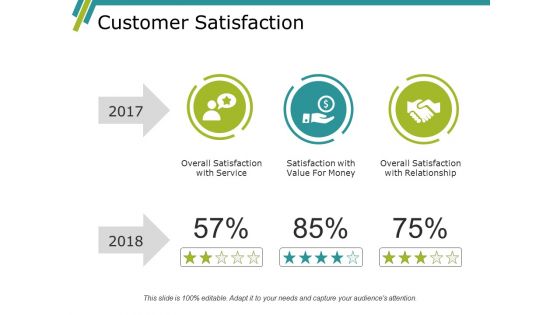
This is a customer satisfaction ppt powerpoint presentation gallery rules. This is a three stage process. The stages in this process are business, marketing, strategy, planning, finance.
-
Business Diagram Flask And Test Tubes For Data Driven PowerPoint Slide
This data driven diagram has been designed with flask and test tubes. Download this diagram to give your presentations more effective look. It helps in clearly conveying your message to clients and audience.
-
KPI Dashboard To Assess Deals In Mergers And Acquisitions Strategy Rules PDF
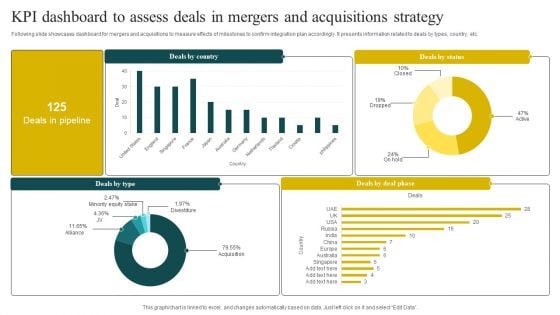
Following slide showcases dashboard for mergers and acquisitions to measure effects of milestones to confirm integration plan accordingly. It presents information related to deals by types, country, etc. Pitch your topic with ease and precision using this KPI Dashboard To Assess Deals In Mergers And Acquisitions Strategy Rules PDF. This layout presents information on Status, Strategy, Minority Equity Stake. It is also available for immediate download and adjustment. So, changes can be made in the color, design, graphics or any other component to create a unique layout.
-
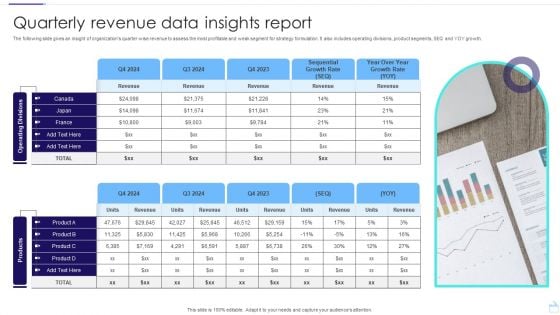
Quarterly Revenue Data Insights Report Template PDF
The following slide gives an insight of organizations quarter wise revenue to assess the most profitable and weak segment for strategy formulation. It also includes operating divisions, product segments, SEQ and YOY growth. Showcasing this set of slides titled Quarterly Revenue Data Insights Report Template PDF. The topics addressed in these templates are Operating, Divisions products, Insights Report. All the content presented in this PPT design is completely editable. Download it and make adjustments in color, background, font etc. as per your unique business setting.
-
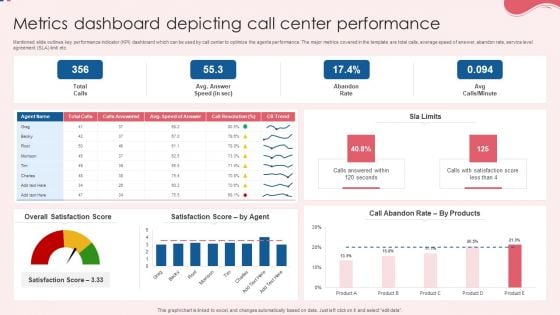
Metrics Dashboard Depicting Call Center Performance Pictures PDF
Mentioned slide outlines key performance indicator KPI dashboard which can be used by call center to optimize the agents performance. The major metrics covered in the template are total calls, average speed of answer, abandon rate, service level agreement SLA limit etc. Pitch your topic with ease and precision using this Metrics Dashboard Depicting Call Center Performance Pictures PDF. This layout presents information on Overall Satisfaction Score, Satisfaction Score, Performance. It is also available for immediate download and adjustment. So, changes can be made in the color, design, graphics or any other component to create a unique layout.
-
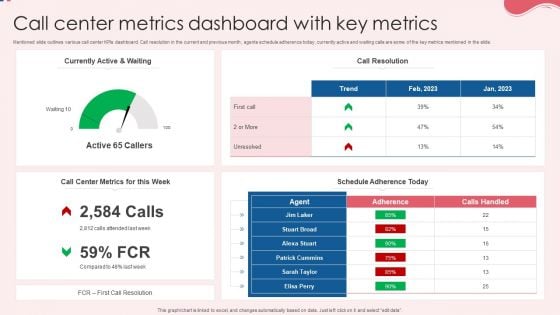
Call Center Metrics Dashboard With Key Metrics Information PDF
Mentioned slide outlines various call center KPIs dashboard. Call resolution in the current and previous month, agents schedule adherence today, currently active and waiting calls are some of the key metrics mentioned in the slide. Showcasing this set of slides titled Call Center Metrics Dashboard With Key Metrics Information PDF. The topics addressed in these templates are Currently Active, Call Resolution, Key Metrics. All the content presented in this PPT design is completely editable. Download it and make adjustments in color, background, font etc. as per your unique business setting.
-
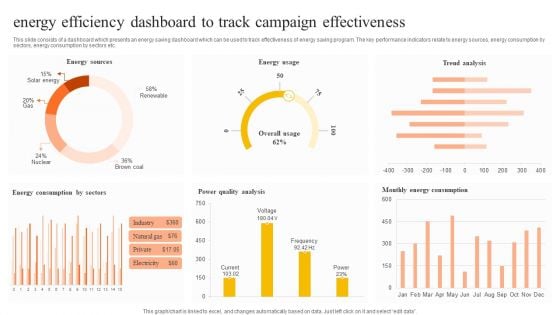
Energy Efficiency Dashboard To Track Campaign Effectiveness Pictures PDF
This slide consists of a dashboard which presents an energy saving dashboard which can be used to track effectiveness of energy saving program. The key performance indicators relate to energy sources, energy consumption by sectors, energy consumption by sectors etc. Pitch your topic with ease and precision using this Energy Efficiency Dashboard To Track Campaign Effectiveness Pictures PDF. This layout presents information on Energy Sources, Energy Usage, Trend Analysis. It is also available for immediate download and adjustment. So, changes can be made in the color, design, graphics or any other component to create a unique layout.
-
Integrated Digital Marketing Strategy Dashboard For Lead Conversion Icons PDF
Following slide illustrates integrated marketing campaign dashboard utilized by organizations to improve business agility and increase operational efficiency. This slide provides data regarding lead conversion by campaign and channel, amount spent per campaign, monthly lead generations, etc. Showcasing this set of slides titled Integrated Digital Marketing Strategy Dashboard For Lead Conversion Icons PDF. The topics addressed in these templates are Total Page Views, Average Session Duration, Conversion. All the content presented in this PPT design is completely editable. Download it and make adjustments in color, background, font etc. as per your unique business setting.
-
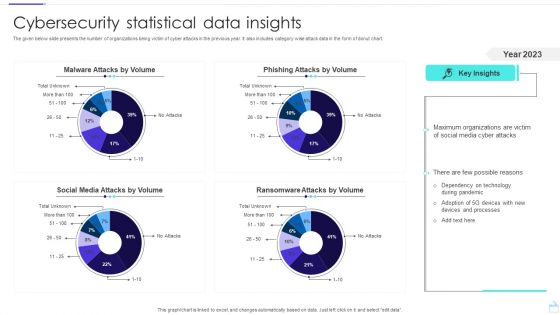
Cybersecurity Statistical Data Insights Sample PDF
The given below slide presents the number of organizations being victim of cyber attacks in the previous year. It also includes category wise attack data in the form of donut chart. Pitch your topic with ease and precision using this Cybersecurity Statistical Data Insights Sample PDF. This layout presents information on Social Media Attacks, Malware Attacks, Phishing Attacks. It is also available for immediate download and adjustment. So, changes can be made in the color, design, graphics or any other component to create a unique layout.
-
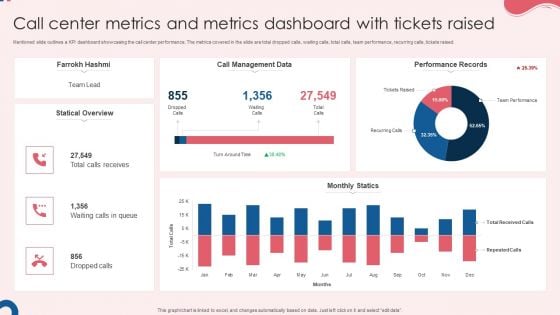
Call Center Metrics And Metrics Dashboard With Tickets Raised Graphics PDF
Mentioned slide outlines a KPI dashboard showcasing the call center performance. The metrics covered in the slide are total dropped calls, waiting calls, total calls, team performance, recurring calls, tickets raised. Showcasing this set of slides titled Call Center Metrics And Metrics Dashboard With Tickets Raised Graphics PDF. The topics addressed in these templates are Call Management Data, Monthly Statics, Performance Records. All the content presented in this PPT design is completely editable. Download it and make adjustments in color, background, font etc. as per your unique business setting.
-
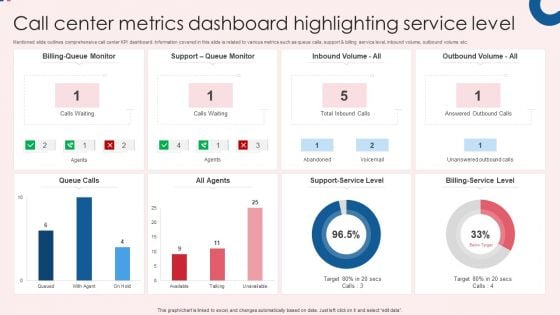
Call Center Metrics Dashboard Highlighting Service Level Infographics PDF
Mentioned slide outlines comprehensive call center KPI dashboard. Information covered in this slide is related to various metrics such as queue calls, support and billing service level, inbound volume, outbound volume etc. Pitch your topic with ease and precision using this Call Center Metrics Dashboard Highlighting Service Level Infographics PDF. This layout presents information on All Agents, Queue Calls, Billing Service Level. It is also available for immediate download and adjustment. So, changes can be made in the color, design, graphics or any other component to create a unique layout.
-
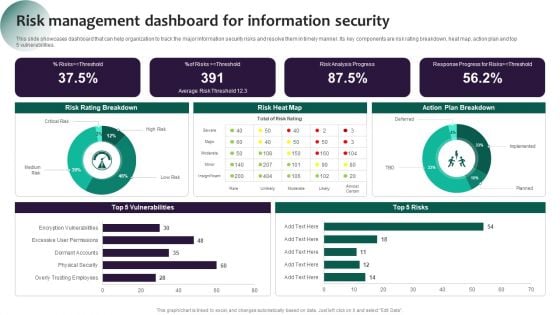
Information Systems Security And Risk Management Plan Risk Management Dashboard For Information Security Pictures PDF
This slide showcases dashboard that can help organization to track the major information security risks and resolve them in timely manner. Its key components are risk rating breakdown, heat map, action plan and top 5 vulnerabilities. The best PPT templates are a great way to save time, energy, and resources. Slidegeeks have 100 percent editable powerpoint slides making them incredibly versatile. With these quality presentation templates, you can create a captivating and memorable presentation by combining visually appealing slides and effectively communicating your message. Download Information Systems Security And Risk Management Plan Risk Management Dashboard For Information Security Pictures PDF from Slidegeeks and deliver a wonderful presentation.
-
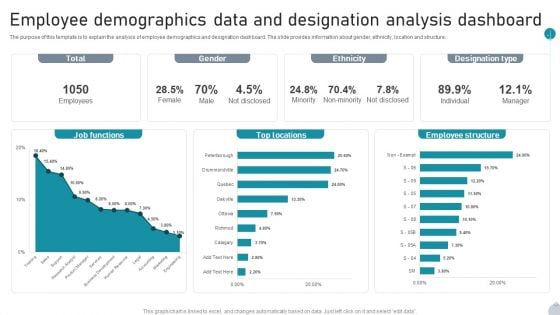
Employee Demographics Data And Designation Analysis Dashboard Introduction PDF
The purpose of this template is to explain the analysis of employee demographics and designation dashboard. The slide provides information about gender, ethnicity, location and structure. Pitch your topic with ease and precision using this Employee Demographics Data And Designation Analysis Dashboard Introduction PDF. This layout presents information on Job Functions, Top Locations, Employee Structure It is also available for immediate download and adjustment. So, changes can be made in the color, design, graphics or any other component to create a unique layout.
-
Data Insights Ppt PowerPoint Presentation Complete Deck With Slides
Improve your presentation delivery using this Data Insights Ppt PowerPoint Presentation Complete Deck With Slides. Support your business vision and objectives using this well structured PPT deck. This template offers a great starting point for delivering beautifully designed presentations on the topic of your choice. Comprising eleven this professionally designed template is all you need to host discussion and meetings with collaborators. Each slide is self explanatory and equipped with high quality graphics that can be adjusted to your needs. Therefore, you will face no difficulty in portraying your desired content using this PPT slideshow. This PowerPoint slideshow contains every important element that you need for a great pitch. It is not only editable but also available for immediate download and utilization. The color, font size, background, shapes everything can be modified to create your unique presentation layout. Therefore, download it now.
-
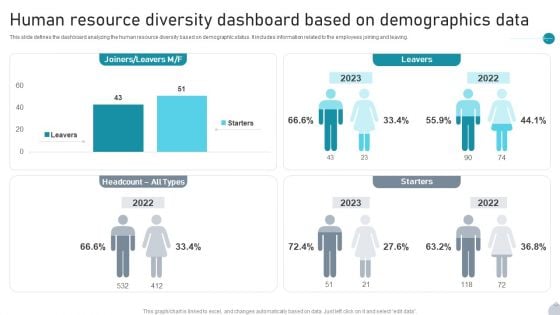
Human Resource Diversity Dashboard Based On Demographics Data Rules PDF
This slide defines the dashboard analyzing the human resource diversity based on demographic status. It includes information related to the employees joining and leaving. Pitch your topic with ease and precision using this Human Resource Diversity Dashboard Based On Demographics Data Rules PDF. This layout presents information on Starters, Leavers, Demographics Data It is also available for immediate download and adjustment. So, changes can be made in the color, design, graphics or any other component to create a unique layout.
-
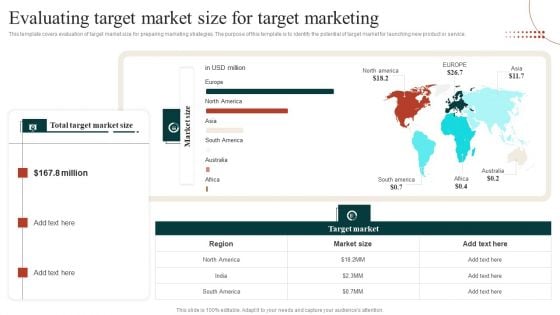
Target Marketing Techniques Evaluating Target Market Size For Target Marketing Mockup PDF
This template covers evaluation of target market size for preparing marketing strategies. The purpose of this template is to identify the potential of target market for launching new product or service. Create an editable Target Marketing Techniques Evaluating Target Market Size For Target Marketing Mockup PDF that communicates your idea and engages your audience. Whether you are presenting a business or an educational presentation, pre designed presentation templates help save time. Target Marketing Techniques Evaluating Target Market Size For Target Marketing Mockup PDF is highly customizable and very easy to edit, covering many different styles from creative to business presentations. Slidegeeks has creative team members who have crafted amazing templates. So, go and get them without any delay.
-
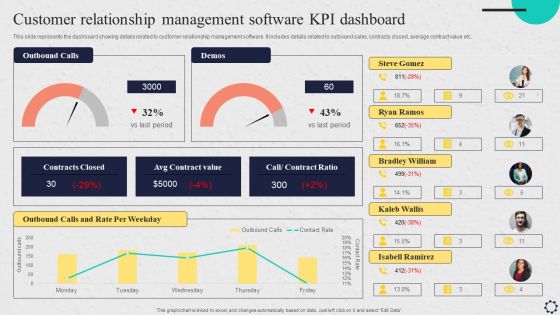
Software Implementation Strategy Customer Relationship Management Software Kpi Dashboard Clipart PDF
This slide represents the dashboard showing details related to customer relationship management software. It includes details related to outbound sales, contracts closed, average contract value etc. Are you in need of a template that can accommodate all of your creative concepts This one is crafted professionally and can be altered to fit any style. Use it with Google Slides or PowerPoint. Include striking photographs, symbols, depictions, and other visuals. Fill, move around, or remove text boxes as desired. Test out color palettes and font mixtures. Edit and save your work, or work with colleagues. Download Software Implementation Strategy Customer Relationship Management Software Kpi Dashboard Clipart PDF and observe how to make your presentation outstanding. Give an impeccable presentation to your group and make your presentation unforgettable.
-
Three Steps Of Optimizing Accountable Payable Ppt Powerpoint Presentation Summary Background Image
This is a three steps of optimizing accountable payable ppt powerpoint presentation summary background image. This is a three stage process. The stages in this process are accounting, three way match, three document.
-
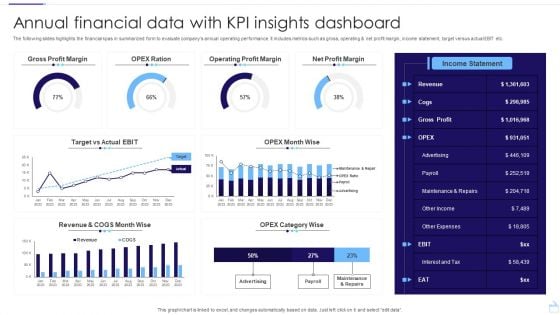
Annual Financial Data With KPI Insights Dashboard Structure PDF
The following slides highlights the financial kpas in summarized form to evaluate companys annual operating performance. It includes metrics such as gross, operating and net profit margin, income statement, target versus actual EBIT etc. Pitch your topic with ease and precision using this Annual Financial Data With KPI Insights Dashboard Structure PDF. This layout presents information on Gross Profit Margin, Operating Profit Margin, Net Profit Margin. It is also available for immediate download and adjustment. So, changes can be made in the color, design, graphics or any other component to create a unique layout.
-
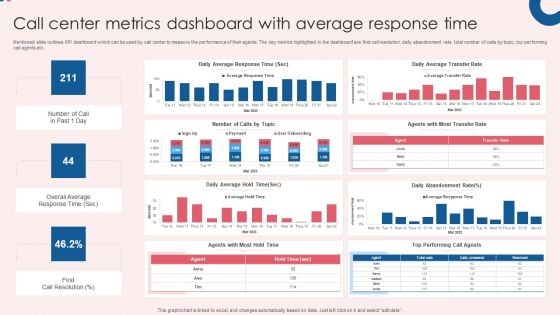
Call Center Metrics Dashboard With Average Response Time Inspiration PDF
Mentioned slide outlines KPI dashboard which can be used by call center to measure the performance of their agents. The key metrics highlighted in the dashboard are first call resolution, daily abandonment rate, total number of calls by topic, top performing call agents etc. Showcasing this set of slides titled Call Center Metrics Dashboard With Average Response Time Inspiration PDF. The topics addressed in these templates are Efficiency, Quality, Activity, Daily Average Response, Daily Average Transfer. All the content presented in this PPT design is completely editable. Download it and make adjustments in color, background, font etc. as per your unique business setting.
-
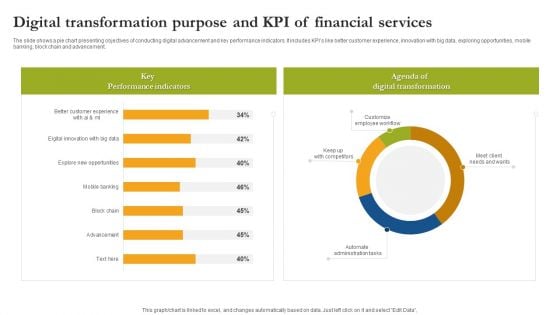
Digital Transformation Purpose And Kpi Of Financial Services Guidelines PDF
The slide shows a pie chart presenting objectives of conducting digital advancement and key performance indicators. It includes KPIs like better customer experience, innovation with big data, exploring opportunities, mobile banking, block chain and advancement. Showcasing this set of slides titled Digital Transformation Purpose And Kpi Of Financial Services Guidelines PDF. The topics addressed in these templates are Key Performance Indicators Digital Transformation, Customize Employee Workflow. All the content presented in this PPT design is completely editable. Download it and make adjustments in color, background, font etc. as per your unique business setting.
-
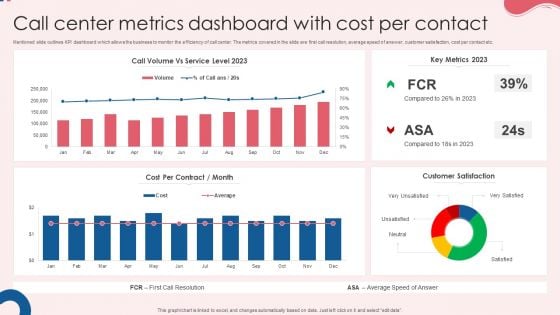
Call Center Metrics Dashboard With Cost Per Contact Rules PDF
Mentioned slide outlines KPI dashboard which allows the business to monitor the efficiency of call center. The metrics covered in the slide are first call resolution, average speed of answer, customer satisfaction, cost per contact etc. Pitch your topic with ease and precision using this Call Center Metrics Dashboard With Cost Per Contact Rules PDF. This layout presents information on Cost Per Contract, Key Metrics, Customer Satisfaction. It is also available for immediate download and adjustment. So, changes can be made in the color, design, graphics or any other component to create a unique layout.
-
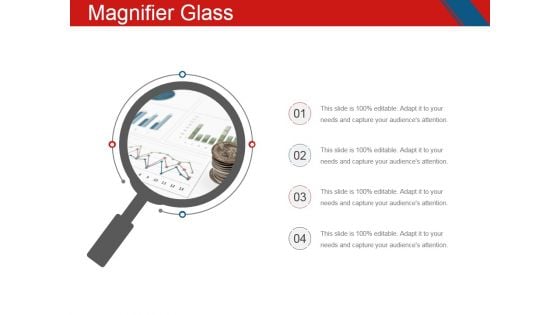
Magnifier Glass Ppt PowerPoint Presentation Inspiration Example
This is a magnifier glass ppt powerpoint presentation inspiration example. This is a four stage process. The stages in this process are magnifying glass, business, marketing, management, planning.
-
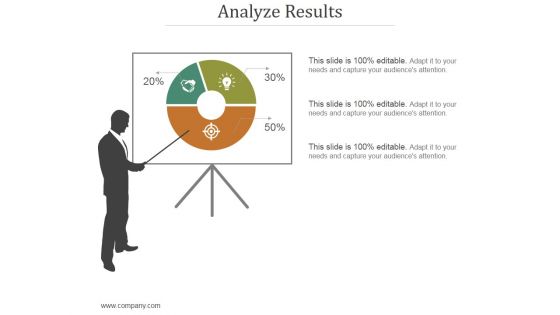
Analyze Results Ppt PowerPoint Presentation Guide
This is a analyze results ppt powerpoint presentation guide. This is a three stage process. The stages in this process are icon, percentage, finance, man, present.
-
Financial Highlights Template 1 Ppt PowerPoint Presentation Icon Brochure
This is a financial highlights template 1 ppt powerpoint presentation icon brochure. This is a eight stage process. The stages in this process are business, marketing, finance, management, analysis.
-
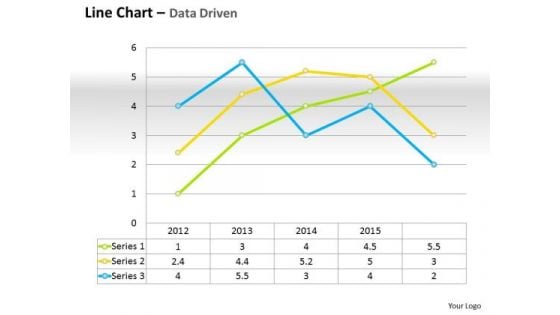
Data Analysis Template Driven Line Chart For Business Performance PowerPoint Slides Templates
Do Not Allow Things To Drift. Ring In Changes With Our data analysis template driven line chart for business performance powerpoint slides Templates .
-
Investor Personality Profile Ppt PowerPoint Presentation Complete Deck With Slides
This is a investor personality profile ppt powerpoint presentation complete deck with slides. This is a one stage process. The stages in this process are finance, analysis, marketing, management, business.
-
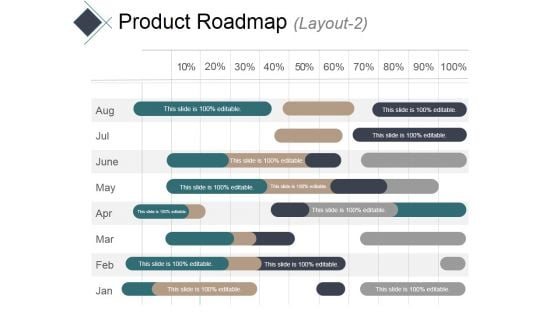
Product Roadmap Layout 2 Ppt PowerPoint Presentation Portfolio File Formats
This is a product roadmap layout 2 ppt powerpoint presentation portfolio file formats. This is a eight stage process. The stages in this process are bar, finance, analysis, planning, percentage.
-
Comparison Ppt PowerPoint Presentation Portfolio Inspiration
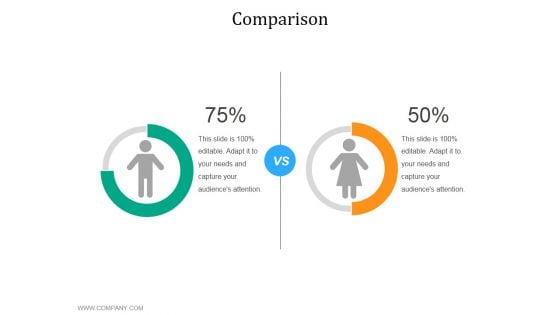
This is a comparison ppt powerpoint presentation portfolio inspiration. This is a two stage process. The stages in this process are business, marketing, comparison, finance, management.
-
Website Performance Review Template 1 Ppt PowerPoint Presentation Slides Icons
This is a website performance review template 1 ppt powerpoint presentation slides icons. This is a three stage process. The stages in this process are online transaction, conversion rate, traffic source, site consumption time, organic branded.
-
Current Status Of Product Ppt PowerPoint Presentation Designs Download
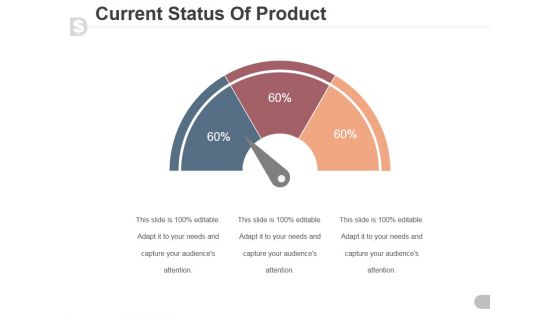
This is a current status of product ppt powerpoint presentation designs download. This is a three stage process. The stages in this process are speedometer, dashboard, business, marketing, finance.
-
Budget Report Ppt PowerPoint Presentation Topics
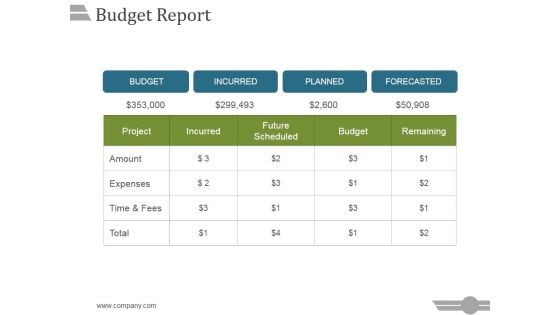
This is a budget report ppt powerpoint presentation topics. This is a five stage process. The stages in this process are project, incurred, future scheduled, budget, remaining.
-
Target Market Share Ppt PowerPoint Presentation Templates
This is a target market share ppt powerpoint presentation templates. This is a two stage process. The stages in this process are competitive brands market share, target market shares.
-
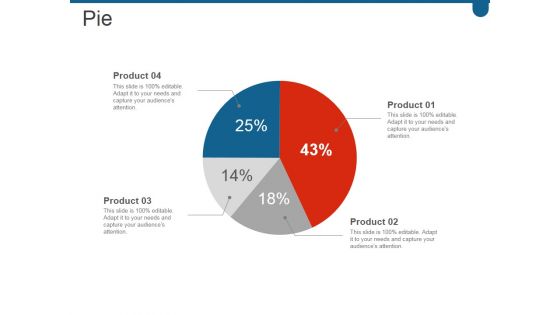
Pie Ppt PowerPoint Presentation Information
This is a pie ppt powerpoint presentation information. This is a four stage process. The stages in this process are pie, finance, percentage, business, marketing.
-
Comparison Ppt PowerPoint Presentation Icon Topics
This is a comparison ppt powerpoint presentation icon topics. This is a two stage process. The stages in this process are business, marketing, comparison, planning, management.
-
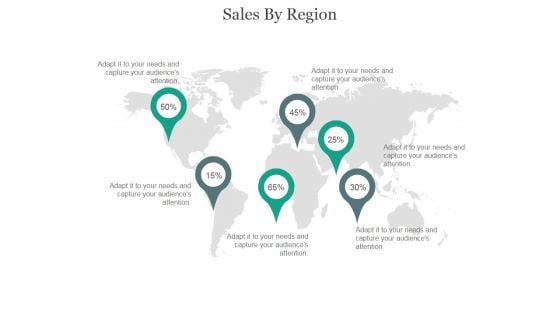
Sales By Region Ppt PowerPoint Presentation Pictures
This is a sales by region ppt powerpoint presentation pictures. This is a six stage process. The stages in this process are map, location, finance, percentage, company.
-
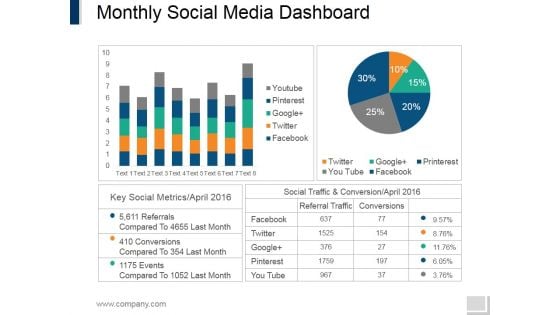
Monthly Social Media Dashboard Ppt PowerPoint Presentation Gallery Templates
This is a monthly social media dashboard ppt powerpoint presentation gallery templates. This is a four stage process. The stages in this process are facebook, twitter, google, pinterest, you tube.
-
Strategies And Guide To Create Crisis Communication Ppt PowerPoint Presentation Complete Deck With Slides
Use this Strategies And Guide To Create Crisis Communication Ppt PowerPoint Presentation Complete Deck With Slides to ensure the business world gets to know you as a presentation expert with tremendous recall value. With its focus on providing the worlds best designs to highlight business ideas that have the potential to change the world, this PPT Template is sure to win you clients. The complete deck in fourty slides is a compendium of information, structured in a manner that provides the best framework for a presentation. Use this completely editable and customizable presentation to make an impact and improve your order book. Download now.

 Home
Home 

