5 Steps
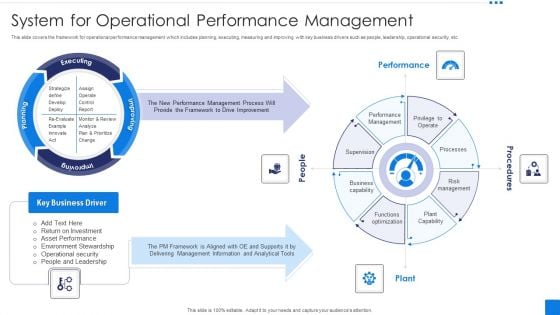
System For Operational Performance Management Infographics PDF
This slide covers the framework for operational performance management which includes planning, executing, measuring and improving with key business drivers such as people, leadership, operational security, etc. Presenting System For Operational Performance Management Infographics PDF to dispense important information. This template comprises four stages. It also presents valuable insights into the topics including Performance, Procedures, People, Plant. This is a completely customizable PowerPoint theme that can be put to use immediately. So, download it and address the topic impactfully.
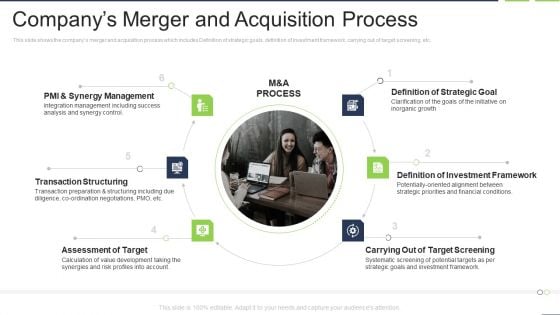
Companys Merger And Acquisition Process Infographics PDF
This slide shows the companys merger and acquisition process which includes Definition of strategic goals, definition of investment framework, carrying out of target screening, etc.This is a companys merger and acquisition process infographics pdf template with various stages. Focus and dispense information on six stages using this creative set, that comes with editable features. It contains large content boxes to add your information on topics like carrying out of target screening, definition of investment framework, definition of strategic goal. You can also showcase facts, figures, and other relevant content using this PPT layout. Grab it now.
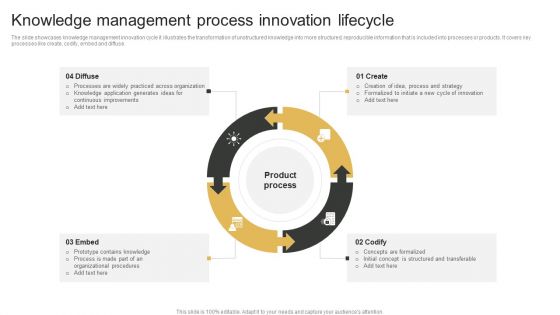
Knowledge Management Process Innovation Lifecycle Infographics PDF
The slide showcases knowledge management innovation cycle it illustrates the transformation of unstructured knowledge into more structured, reproducible information that is included into processes or products. It covers key processes like create, codify, embed and diffuse. Persuade your audience using this Knowledge Management Process Innovation Lifecycle Infographics PDF. This PPT design covers four stages, thus making it a great tool to use. It also caters to a variety of topics including Create, Codify, Embed. Download this PPT design now to present a convincing pitch that not only emphasizes the topic but also showcases your presentation skills.
Business Diagram Business Infographic With Icons PowerPoint Templates
Graphic of circular twisted arrows has been used to design this business diagram. This diagram contains helps to depict business process flows. Explain your strategy to co-ordinate activities.
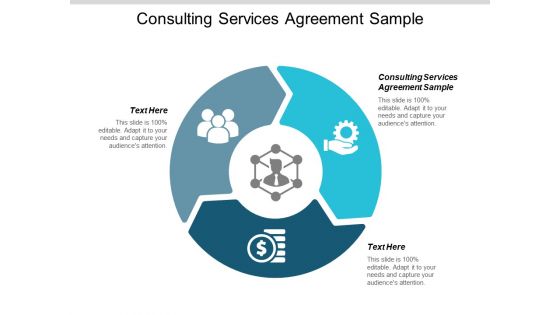
Consulting Services Agreement Sample Ppt PowerPoint Presentation Infographic Template Infographic Template Cpb
This is a consulting services agreement sample ppt powerpoint presentation infographic template infographic template cpb. This is a three stage process. The stages in this process are consulting services agreement sample, management, marketing, business.
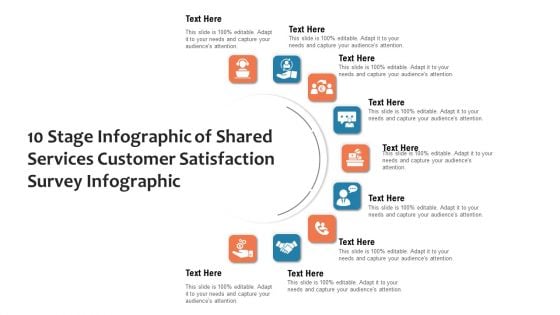
10 Stage Infographic Of Shared Services Customer Satisfaction Survey Infographic Ppt PowerPoint Presentation Inspiration Outfit PDF
Presenting 10 stage infographic of shared services customer satisfaction survey infographic ppt powerpoint presentation inspiration outfit pdf to dispense important information. This template comprises ten stages. It also presents valuable insights into the topics including 10 stage infographic of shared services customer satisfaction survey infographic. This is a completely customizable PowerPoint theme that can be put to use immediately. So, download it and address the topic impactfully.
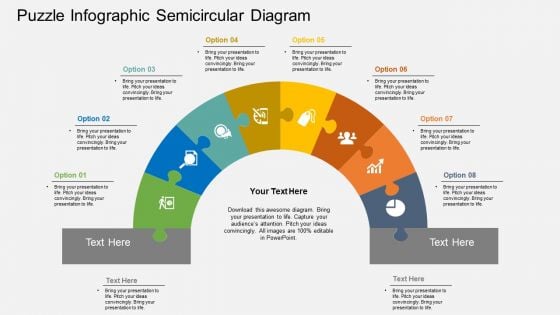
Puzzle Infographic Semicircular Diagram PowerPoint Template
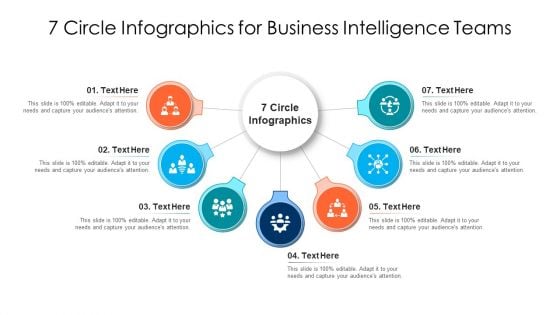
7 Circle Infographics For Business Intelligence Teams Ppt PowerPoint Presentation Infographics Brochure PDF
Persuade your audience using this 7 circle infographics for business intelligence teams ppt powerpoint presentation infographics brochure pdf. This PPT design covers seven stages, thus making it a great tool to use. It also caters to a variety of topics including 7 circle infographics for business intelligence teams. Download this PPT design now to present a convincing pitch that not only emphasizes the topic but also showcases your presentation skills.
BI Sectional Two Interconnected Circles Ppt PowerPoint Presentation Infographics Infographics PDF
Presenting this set of slides with name bi sectional two interconnected circles ppt powerpoint presentation infographics infographics pdf. This is a two stage process. The stages in this process are bi sectional two interconnected circles. This is a completely editable PowerPoint presentation and is available for immediate download. Download now and impress your audience.
Connecting Data Points Vector Icon Ppt PowerPoint Presentation Infographics Infographics PDF
Presenting this set of slides with name connecting data points vector icon ppt powerpoint presentation infographics infographics pdf. This is a three stage process. The stages in this process are connecting data points vector icon. This is a completely editable PowerPoint presentation and is available for immediate download. Download now and impress your audience.
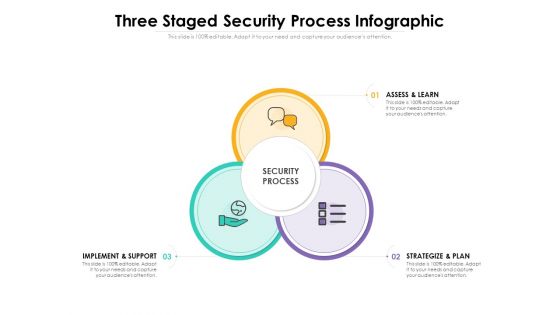
Three Staged Security Process Infographic Ppt PowerPoint Presentation File Infographic Template PDF
Presenting this set of slides with name three staged security process infographic ppt powerpoint presentation file infographic template pdf. This is a three stage process. The stages in this process are assess and learn, strategize and plan, implement and support. This is a completely editable PowerPoint presentation and is available for immediate download. Download now and impress your audience.
Brand Loyalty Through Public Relation Tactics Ppt PowerPoint Presentation Infographics Infographics PDF
Presenting brand loyalty through public relation tactics ppt powerpoint presentation infographics infographics pdf to dispense important information. This template comprises three stages. It also presents valuable insights into the topics including brand loyalty through public relation tactics. This is a completely customizable PowerPoint theme that can be put to use immediately. So, download it and address the topic impactfully.
Automation Banking Financial Services Ppt PowerPoint Presentation Infographic Template Infographics Cpb
Presenting this set of slides with name automation banking financial services ppt powerpoint presentation infographic template infographics cpb. This is an editable Powerpoint four stages graphic that deals with topics like automation banking financial services to help convey your message better graphically. This product is a premium product available for immediate download and is 100 percent editable in Powerpoint. Download this now and use it in your presentations to impress your audience.

Ten Stages Infographic Template To Create A Resource Plan Ppt PowerPoint Presentation Infographics Skills
Presenting this set of slides with name ten stages infographic template to create a resource plan ppt powerpoint presentation infographics skills. This is a ten stage process. The stages in this process are create a resource plan, financial planning, risk planning, supplier contract, communication plan, create a project plan, quality plan, phase review. This is a completely editable PowerPoint presentation and is available for immediate download. Download now and impress your audience.
Purchase Pay Control Matrix Ppt PowerPoint Presentation Infographic Template Infographics Cpb Pdf
Presenting this set of slides with name purchase pay control matrix ppt powerpoint presentation infographic template infographics cpb pdf. This is an editable Powerpoint twelve stages graphic that deals with topics like purchase pay control matrix to help convey your message better graphically. This product is a premium product available for immediate download and is 100 percent editable in Powerpoint. Download this now and use it in your presentations to impress your audience.
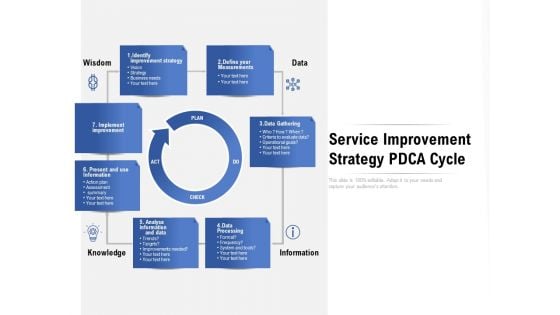
Service Improvement Strategy Pdca Cycle Ppt PowerPoint Presentation Infographics Infographic Template PDF
Presenting this set of slides with name service improvement strategy pdca cycle ppt powerpoint presentation infographics infographic template pdf. This is a seven stage process. The stages in this process are identify improvement strategy, implement improvement, present and use information, analyse information and data, data processing, data gathering, define your measurements, information knowledge, data wisdom. This is a completely editable PowerPoint presentation and is available for immediate download. Download now and impress your audience.
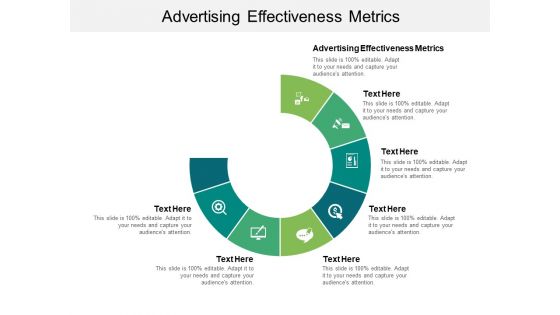
Advertising Effectiveness Metrics Ppt PowerPoint Presentation Infographic Template Infographics Cpb Pdf
Presenting this set of slides with name advertising effectiveness metrics ppt powerpoint presentation infographic template infographics cpb pdf. This is an editable Powerpoint seven stages graphic that deals with topics like advertising effectiveness metrics to help convey your message better graphically. This product is a premium product available for immediate download and is 100 percent editable in Powerpoint. Download this now and use it in your presentations to impress your audience.
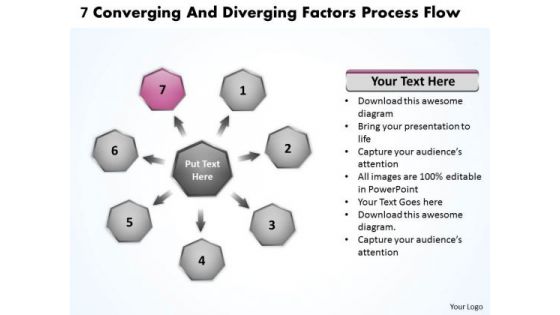
7 Converging And Diverging Factors Process Flow Cycle Arrow Chart PowerPoint Slides
We present our 7 converging and diverging factors process flow Cycle Arrow Chart PowerPoint Slides.Download our Leadership PowerPoint Templates because they have always been a source of inspiration for us all. Use our Circle Charts PowerPoint Templates because you can take it along a sure fire road to good profit. Download our Arrows PowerPoint Templates because you know your business and have a vision for it. Download and present our Business PowerPoint Templates because infrastructure growth is an obvious requirement of today.inform your group on how exactly this potential is tailor made for you. Present our Process and Flows PowerPoint Templates because forward thinking is the way to go.Use these PowerPoint slides for presentations relating to Agreeable, Agreeableness, Art, Blue, Business, Chart, Circle, Clip, Clipart, Conscientiousness, Diagram, Extraversion, Factor, Five, Flow, Graph, Graphic, Green, Illustration, Model, Neuroticism, Openness, Personality, Pointed, Process, Psychological, Psychology, Red, Segment, Segmented, Shape. The prominent colors used in the PowerPoint template are Pink, Gray, Black. PowerPoint presentation experts tell us our 7 converging and diverging factors process flow Cycle Arrow Chart PowerPoint Slides are visually appealing. People tell us our Clipart PowerPoint templates and PPT Slides are Upbeat. People tell us our 7 converging and diverging factors process flow Cycle Arrow Chart PowerPoint Slides are Whimsical. Presenters tell us our Blue PowerPoint templates and PPT Slides are Adorable. Customers tell us our 7 converging and diverging factors process flow Cycle Arrow Chart PowerPoint Slides are Handsome. The feedback we get is that our Chart PowerPoint templates and PPT Slides are Pleasant. Stitch together the fabric of your thoughts. Thread through with our 7 Converging And Diverging Factors Process Flow Cycle Arrow Chart PowerPoint Slides.
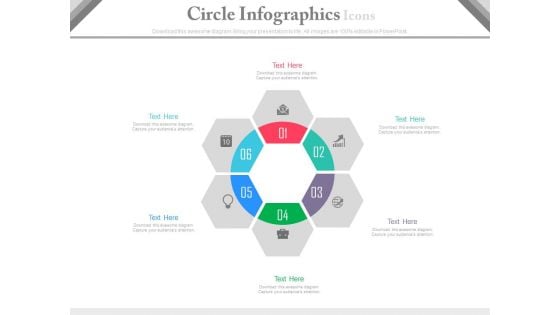
Circle Infographics Developing A Marketing Strategy Powerpoint Template
This business slide contains circular infographic design. This diagram may be used for developing a marketing strategy. Visual effect this slide helps in maintaining the flow of the discussion and provides more clarity to the subject.
Six Sections Business Process Flow Ppt PowerPoint Presentation Icon Infographics
This is a six sections business process flow ppt powerpoint presentation icon infographics. This is a six stage process. The stages in this process are 6 circular arrows, 6 circle arrows, 6 cycle arrows.
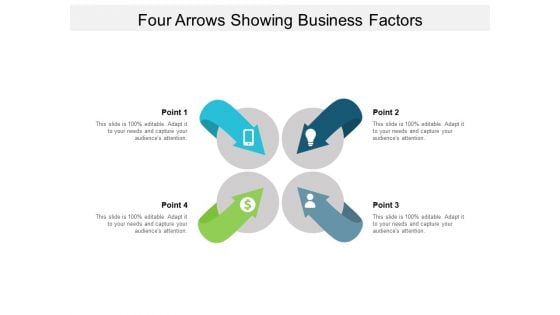
Four Arrows Showing Buisness Factors Ppt PowerPoint Presentation Ideas Infographics
This is a four arrows showing buisness factors ppt powerpoint presentation ideas infographics. This is a four stage process. The stages in this process are circle process 4 arrows, circle cycle 4 arrows, circular process 4 arrows.
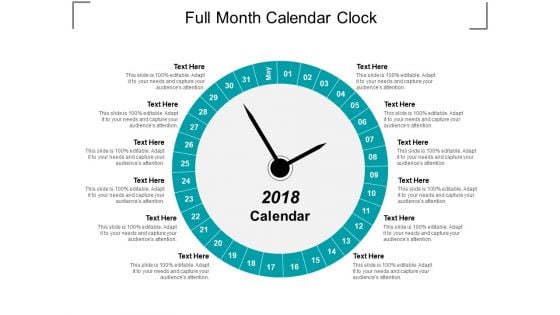
Full Month Calendar Clock Ppt Powerpoint Presentation Infographic Template Clipart
This is a full month calendar clock ppt powerpoint presentation infographic template clipart. This is a twelve stage process. The stages in this process are circular calendar, circle calendar, cyclic calendar.
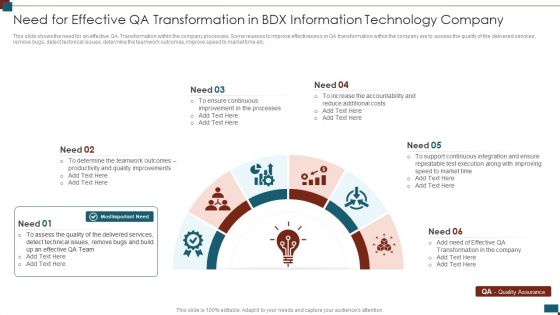
Successful Quality Assurance Transition Techniques To Enhance Product Quality Need For Effective Qa Transformation Infographics PDF
This slide shows the need for an effective QA Transformation within the company processes. Some reasons to improve effectiveness in QA transformation within the company are to assess the quality of the delivered services, remove bugs, detect technical issues, determine the teamwork outcomes, improve speed to market time etc. Presenting successful quality assurance transition techniques to enhance product quality need for effective qa transformation infographics pdf to provide visual cues and insights. Share and navigate important information on five stages that need your due attention. This template can be used to pitch topics like need for effective qa transformation in bdx information technology company. In addtion, this PPT design contains high resolution images, graphics, etc, that are easily editable and available for immediate download.
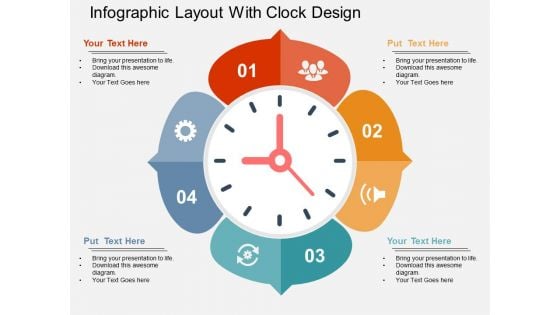
Infographic Layout With Clock Design Powerpoint Templates
This business slide has been designed with clock infographic. Use this diagram to exhibit time management concept. This slide is innovatively designed to highlight your worthy views.
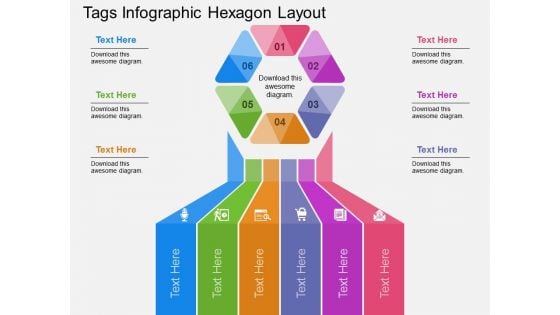
Tags Infographic Hexagon Layout Powerpoint Templates
Develop competitive advantage with our above template which contains hexagon infographic layout. This diagram helps to display business information in visual manner. You can edit text, color, shade and style as per you need.
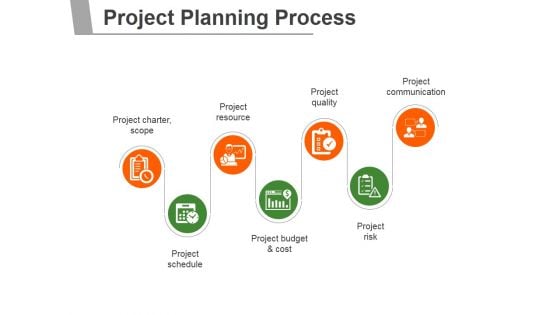
Project Planning Process Ppt PowerPoint Presentation Infographics
This is a project planning process ppt powerpoint presentation infographics. This is a seven stage process. The stages in this process are project charter scope, project resource, project quality, project communication, project schedule, project budget and cost, project risk.
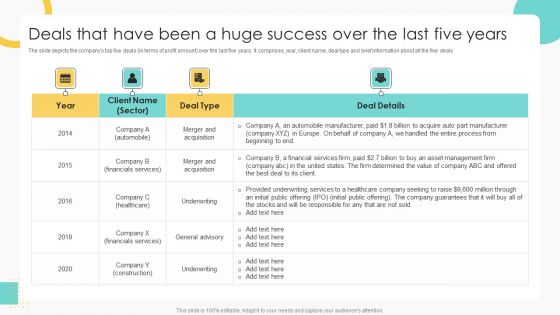
Buy Side Merger And Acquisition Pitch Book Deals That Have Been A Huge Success Over The Last Five Years Structure PDF
The slide depicts the companys top five deals in terms of profit amount over the last five years. It comprises, year, client name, deal type and brief information about all the five deals. Deliver and pitch your topic in the best possible manner with this Buy Side Merger And Acquisition Pitch Book Deals That Have Been A Huge Success Over The Last Five Years Structure PDF. Use them to share invaluable insights on Manufacturer, Services, Financial and impress your audience. This template can be altered and modified as per your expectations. So, grab it now.
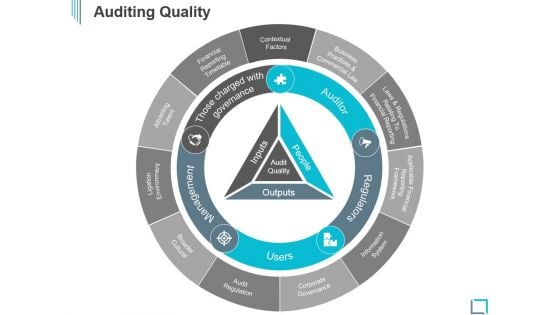
Auditing Quality Ppt PowerPoint Presentation Infographic Template
This is a auditing quality ppt powerpoint presentation infographic template. This is a three stage process. The stages in this process are contextual factors, business practices and commercial law, laws and regulations, relating to financial reporting, information system, corporate governance, audit regulation, broader cultural, ligation environment, attracting talent, financial reporting timetable.
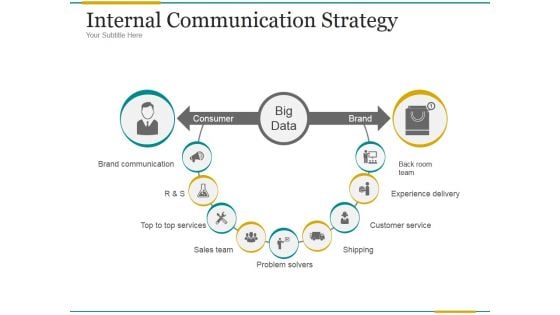
Internal Communication Strategy Ppt PowerPoint Presentation Infographics
This is a internal communication strategy ppt powerpoint presentation infographics. This is a nine stage process. The stages in this process are consumer brand, backroom team, experience delivery, customer service, shipping, problem solvers, sales team, top to top services, brand communication.
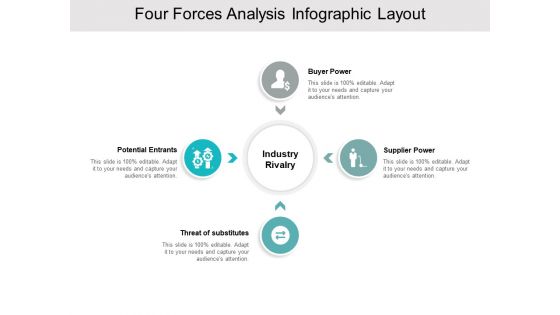
Four Forces Analysis Infographic Layout Ppt PowerPoint Presentation Gallery Vector
Presenting this set of slides with name four forces analysis infographic layout ppt powerpoint presentation gallery vector. This is a four stage process. The stages in this process are circular process, diverging radial, spokes diagram. This is a completely editable PowerPoint presentation and is available for immediate download. Download now and impress your audience.
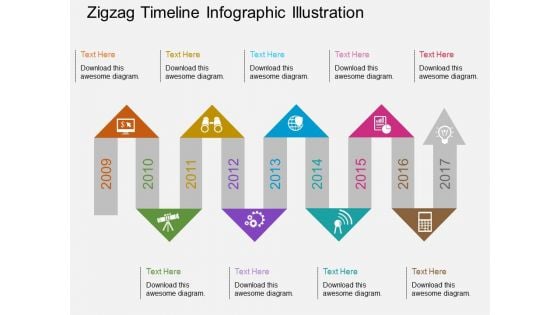
Zigzag Timeline Infographic Illustration Powerpoint Template
This PowerPoint template displays year based zigzag timeline diagram. This PPT slide helps in thoughtful interaction with your viewers. Imprint your concepts with this PPT slide in your presentations.
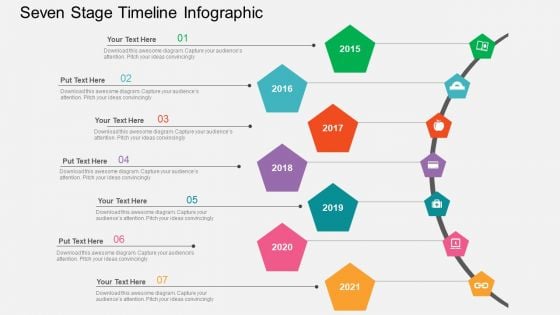
Seven Stage Timeline Infographic Powerpoint Templates
Six Staged Infographics Square With Business Icons Powerpoint Templates
This business diagram displays circular puzzle infographic. This editable slide is suitable to present global communication. Use this diagram for business and finance related topics and display complete data analysis in your presentation.
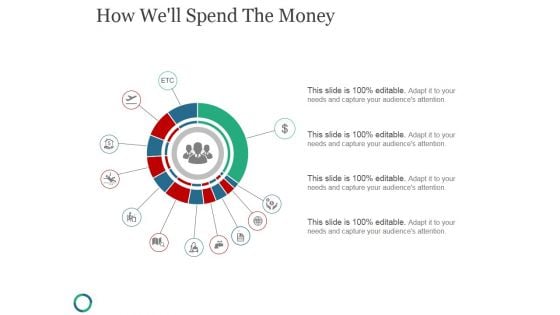
How Well Spend The Money Ppt PowerPoint Presentation Infographic Template
This is a how well spend the money ppt powerpoint presentation infographic template. This is a twelve stage process. The stages in this process are business, process, circular, marketing, management.
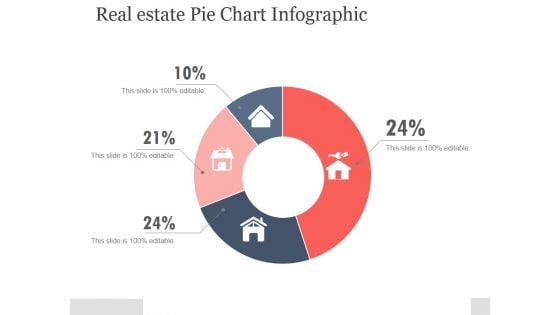
Real Estate Pie Chart Infographic Ppt PowerPoint Presentation Portfolio
This is a real estate pie chart infographic ppt powerpoint presentation portfolio. This is a four stage process. The stages in this process are circular, business, icons, marketing, process.
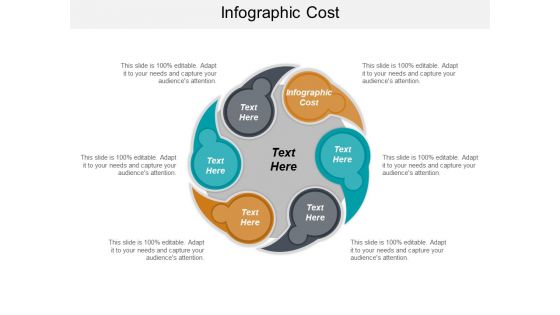
Infographic Cost Ppt PowerPoint Presentation Professional Files Cpb
This is a infographic cost ppt powerpoint presentation professional files cpb. This is a six stage process. The stages in this process are infographic cost.
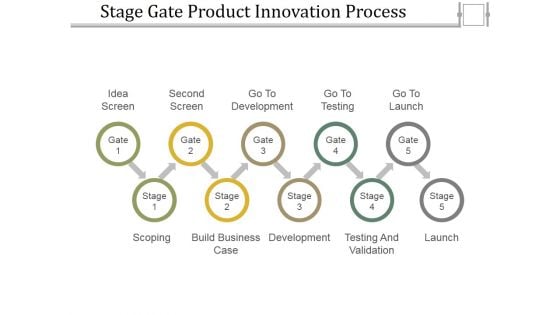
Stage Gate Product Innovation Process Ppt PowerPoint Presentation Infographic Template Example 2015
This is a stage gate product innovation process ppt powerpoint presentation infographic template example 2015. This is a ten stage process. The stages in this process are scoping, build business case, development, testing and validation, launch, idea screen, second screen.
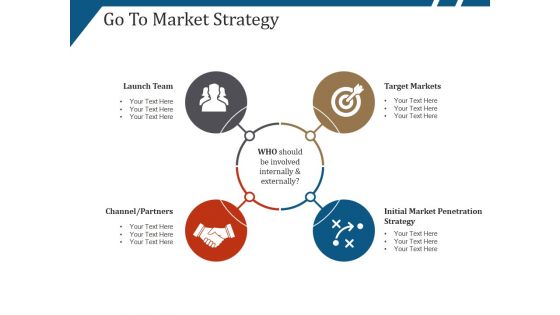
Go To Market Strategy Template 1 Ppt PowerPoint Presentation Pictures Infographics
This is a go to market strategy template 1 ppt powerpoint presentation pictures infographics. This is a four stage process. The stages in this process are launch team, target markets, channel partners.
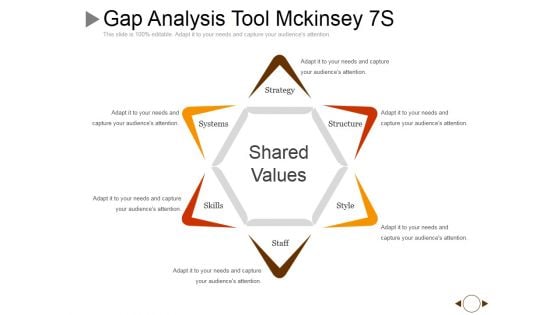
Gap Analysis Tool Mckinsey 7S Ppt PowerPoint Presentation Infographic Template Example
This is a gap analysis tool mckinsey 7s ppt powerpoint presentation infographic template example. This is a six stage process. The stages in this process are strategy, structure, style, staff, skills.

Along With Superior Technical Capabilities Ppt PowerPoint Presentation Infographic Template Background Image
This is a along with superior technical capabilities ppt powerpoint presentation infographic template background image. This is a four stage process. The stages in this process are capability, business, marketing, strategy, process.
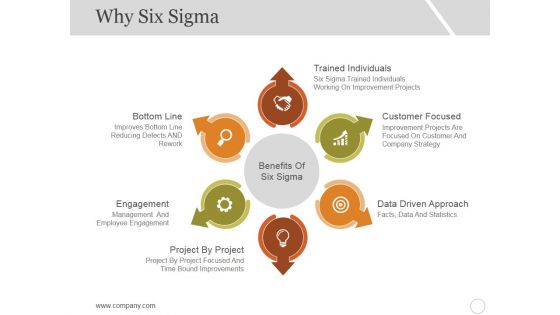
Why Six Sigma Template 2 Ppt PowerPoint Presentation Infographic Template Skills
This is a why six sigma template 2 ppt powerpoint presentation infographic template skills. This is a six stage process. The stages in this process are bottom line, engagement, project by project, customer focused, data driven approach.
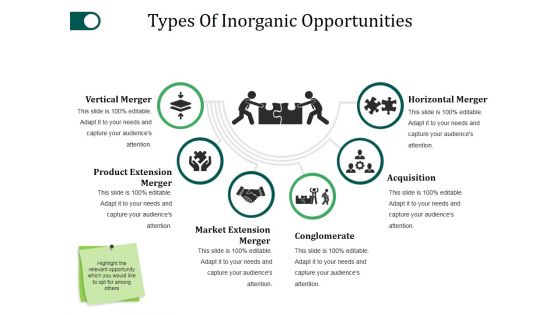
Types Of Inorganic Opportunities Template 2 Ppt PowerPoint Presentation Infographic Template Outline
This is a types of inorganic opportunities template 2 ppt powerpoint presentation infographic template outline. This is a six stage process. The stages in this process are vertical merger, conglomerate, acquisition, horizontal merger, market extension merger.

About The Product Template 2 Ppt PowerPoint Presentation Visual Aids Infographics
This is a about the product template 2 ppt powerpoint presentation visual aids infographics. This is a six stage process. The stages in this process are architectural design, originality, quality of product, ideas, cheap price.
Six Stages Business Process Flow With Icons Ppt PowerPoint Presentation Infographic Template Influencers
This is a six stages business process flow with icons ppt powerpoint presentation infographic template influencers. This is a six stage process. The stages in this process are process flow 6, process map 6.

Workplace Stress And Time Management Ppt PowerPoint Presentation Infographics Designs Download
This is a workplace stress and time management ppt powerpoint presentation infographics designs download. This is a six stage process. The stages in this process are work life balance, work and leisure, career and ambition.
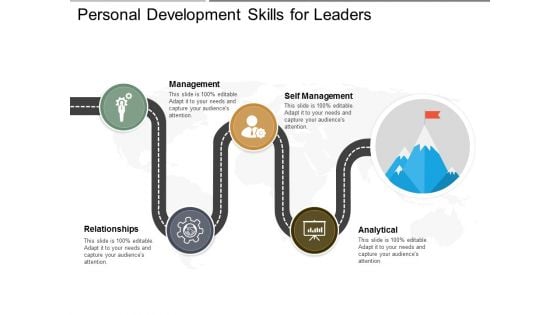
Personal Development Skills For Leaders Ppt PowerPoint Presentation Infographic Template Samples
This is a personal development skills for leaders ppt powerpoint presentation infographic template samples. This is a four stage process. The stages in this process are leadership competencies, leadership skills, leadership management.
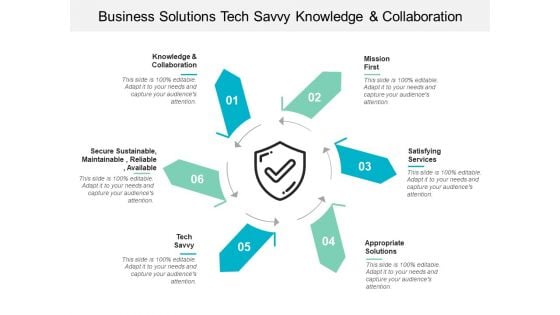
Business Solutions Tech Savvy Knowledge And Collaboration Ppt PowerPoint Presentation Show Infographics
This is a business solutions tech savvy knowledge and collaboration ppt powerpoint presentation show infographics. This is a six stage process. The stages in this process are guidelines, values, guiding principles.
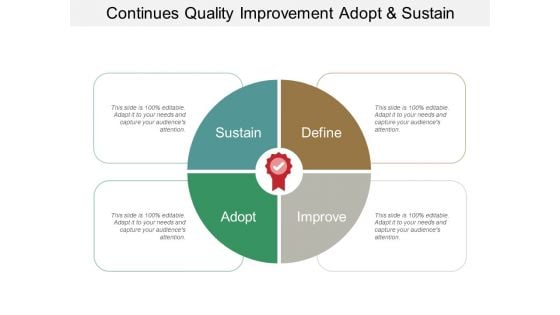
Continues Quality Improvement Adopt And Sustain Ppt PowerPoint Presentation Infographic Template Guidelines
This is a continues quality improvement adopt and sustain ppt powerpoint presentation infographic template guidelines. This is a four stage process. The stages in this process are guidelines, values, guiding principles.
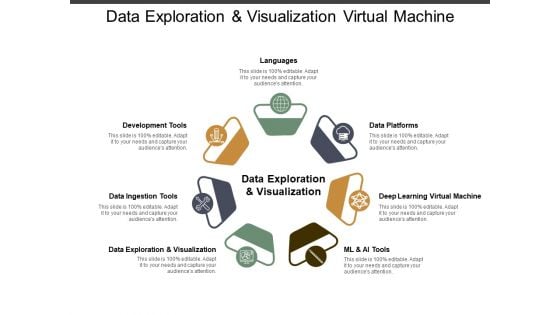
Data Exploration And Visualization Virtual Machine Ppt PowerPoint Presentation Infographics Diagrams
This is a data exploration and visualization virtual machine ppt powerpoint presentation infographics diagrams. This is a seven stage process. The stages in this process are data, analysis, data science, information science.
Employee Satisfaction Scale Employee Retention Business Skill Development Ppt PowerPoint Presentation Infographic Template Graphics Download
This is a employee satisfaction scale employee retention business skill development ppt powerpoint presentation infographic template graphics download. This is a one stage process. The stages in this process are employee satisfaction scale, employee retention, business skill development.
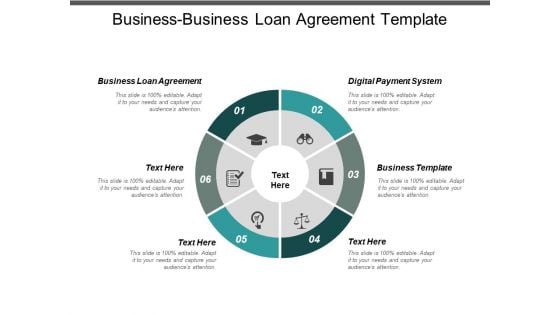
Business Business Loan Agreement Template Digital Payment System Ppt PowerPoint Presentation Infographic Template Background Designs
This is a business business loan agreement template digital payment system ppt powerpoint presentation infographic template background designs. This is a six stage process. The stages in this process are business business loan agreement template, digital payment system.
Open And Shut Doors Symbols Ppt PowerPoint Presentation Pictures Infographic Template
This is a open and shut doors symbols ppt powerpoint presentation pictures infographic template. This is a two stage process. The stages in this process are door icon, entrance icon, house front icon.
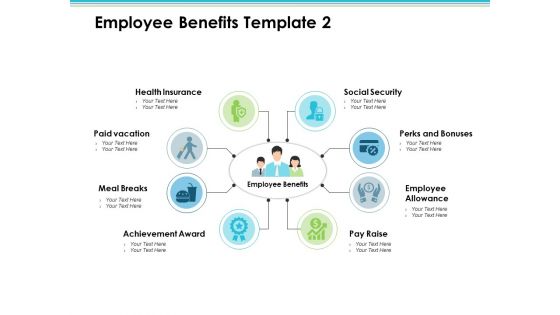
Employee Benefits Employee Value Proposition Ppt PowerPoint Presentation Visual Aids Infographic Template
This is a employee benefits employee value proposition ppt powerpoint presentation visual aids infographic template. This is a eight stage process. The stages in this process are business, management, strategy, analysis, icons.
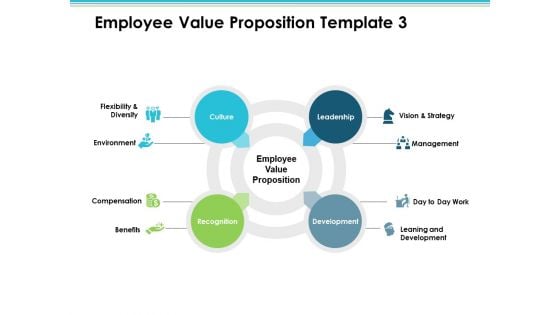
Employee Value Proposition Culture Recognition Development Leadership Ppt PowerPoint Presentation Infographic Template Inspiration
This is a employee value proposition culture recognition development leadership ppt powerpoint presentation infographic template inspiration. This is a four stage process. The stages in this process are business, management, strategy, analysis, icons.
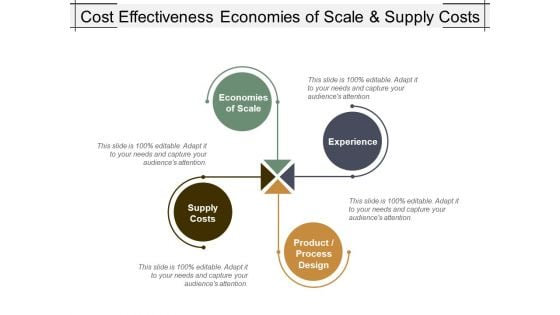
Cost Effectiveness Economies Of Scale And Supply Costs Ppt PowerPoint Presentation Infographic Template Format Ideas
This is a cost effectiveness economies of scale and supply costs ppt powerpoint presentation infographic template format ideas. This is a four stage process. The stages in this process are cost planning, cost efficiency, cost organization.
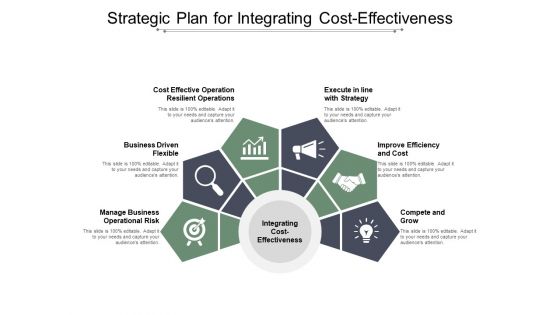
Strategic Plan For Integrating Cost Effectiveness Ppt PowerPoint Presentation Infographics Example
This is a strategic plan for integrating cost effectiveness ppt powerpoint presentation infographics example. This is a six stage process. The stages in this process are cost planning, cost efficiency, cost organization.
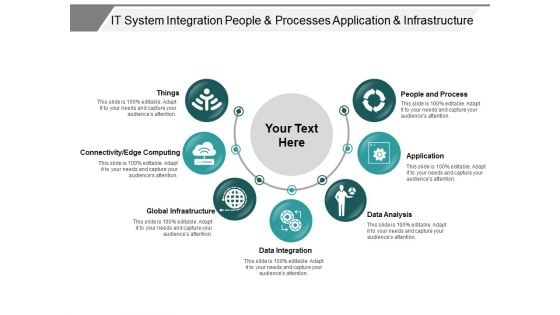
It System Integration People And Processes Application And Infrastructure Ppt PowerPoint Presentation Infographics Graphic Tips
This is a it system integration people and processes application and infrastructure ppt powerpoint presentation infographics graphic tips. This is a seven stage process. The stages in this process are osi model, technology layers, internetworking layer.
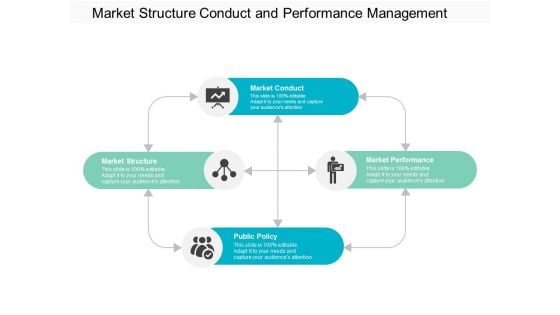
Market Structure Conduct And Performance Management Ppt Powerpoint Presentation Infographic Template Picture
This is a market structure conduct and performance management ppt powerpoint presentation infographic template picture. This is a four stage process. The stages in this process are performance management, structure conduct performance, performance review and analysis.
Three Stages Scp Paradigm With Icons Ppt Powerpoint Presentation Infographics Graphics
This is a three stages scp paradigm with icons ppt powerpoint presentation infographics graphics. This is a three stage process. The stages in this process are performance management, structure conduct performance, performance review and analysis.
Sperm With Male Female Icon Ppt Powerpoint Presentation Infographics Background Image
This is a sperm with male female icon ppt powerpoint presentation infographics background image. This is a two stage process. The stages in this process are fertility, productiveness, fecundity.


 Continue with Email

 Home
Home


