Bar Graphics
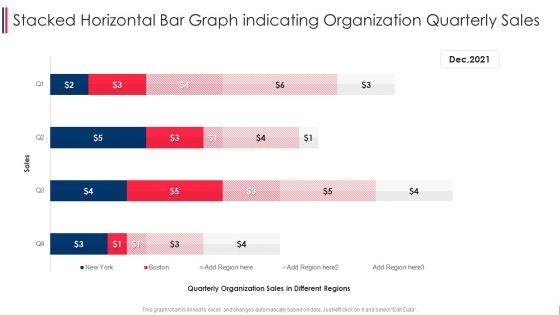
Stacked Horizontal Bar Graph Indicating Organization Quarterly Sales Graphics PDF
Pitch your topic with ease and precision using this stacked horizontal bar graph indicating organization quarterly sales graphics pdf. This layout presents information on stacked horizontal bar graph indicating organization quarterly sales. It is also available for immediate download and adjustment. So, changes can be made in the color, design, graphics or any other component to create a unique layout.
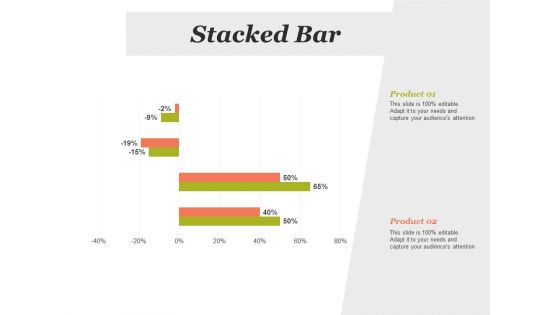
Stacked Bar Financial Analysis Ppt PowerPoint Presentation Infographic Template Slides
This is a stacked bar financial analysis ppt powerpoint presentation infographic template slides. This is a two stage process. The stages in this process are stacked bar, finance, marketing, strategy, analysis.
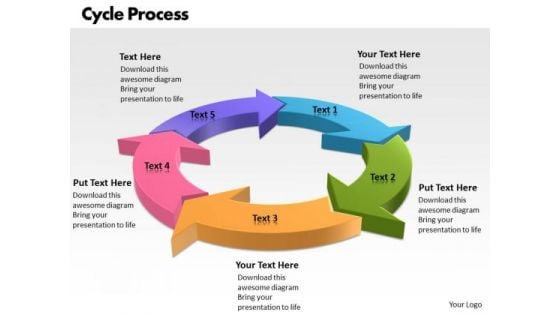
Ppt Factors Of Cycle Writing Process PowerPoint Presentation 5 Stages Templates
PPT factors of cycle writing process powerpoint presentation 5 stages Templates-Visually support your Microsoft office PPT Presentation with our above template illustrating a five steps cyclic diagram. This image clearly defines the concept Project Life cycle. This attractive image makes your presentations simpler showing that you care about even the smallest details. Create captivating presentations to deliver your message across.-PPT factors of cycle writing process powerpoint presentation 5 stages Templates-Arrow, Chart, Circular, Color, Colorful, Connect, Connection, Design, Diagram, Finance, Graphic, Group, Growth, Icon, Illustration, Marketing, Pieces, Process, Recycle, Recycling, Round, Set, Strategy, Symbol, Wheel Conduct yourself creditably with our Ppt Factors Of Cycle Writing Process PowerPoint Presentation 5 Stages Templates. They will let you dominate the dais.
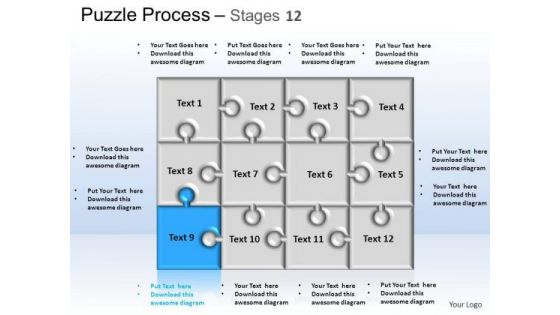
PowerPoint Themes Strategy Puzzle Process Ppt Design Slides
PowerPoint Themes Strategy Puzzle Process PPT Design Slides-Puzzles PowerPoint templates being the perennial educational tool. Emphasize the process of your business/corporate growth. Highlight your ideas broad- based on strong fundamentals and illustrate how they step by step achieve the set growth factor.-These amazing PowerPoint pre-designed slides and PowerPoint templates have been carefully created by our team of experts to help you impress your audience. Our stunning collection of Powerpoint slides are 100% editable and can easily fit in any PowerPoint presentations. By using these animations and graphics in PowerPoint and you can easily make professional presentations. Any text can be entered at any point in the PowerPoint template or slide. Just DOWNLOAD our awesome PowerPoint templates and you are ready to go. Be a peacemaker with our PowerPoint Themes Strategy Puzzle Process Ppt Design Slides. You will come out on top.
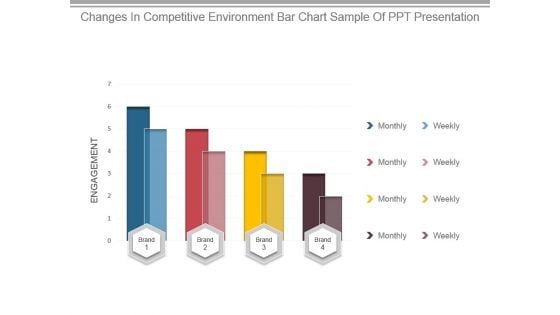
Changes In Competitive Environment Bar Chart Sample Of Ppt Presentation
This is a changes in competitive environment bar chart sample of ppt presentation. This is a four stage process. The stages in this process are engagement, brand, monthly, weekly.
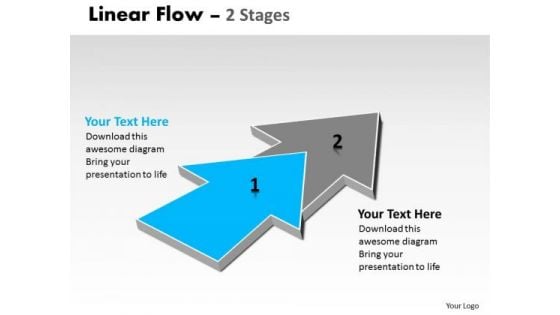
Ppt Theme Progression Of 2 Phase Diagram Flow Spider PowerPoint Template Graphic
We present our PPT Theme progression of 2 phase diagram Flow spider power point template Graphic. Use our Arrows PowerPoint Templates because; Refine them all as you take them through the numerous filtering stages of the funnel of your quality control process. Use our Shapes PowerPoint Templates because; illustrate these thoughts with this slide. Use our Business PowerPoint Templates because, are the symbols of human growth. Use our Signs PowerPoint Templates because, you understand how each drives the next to motor the entire sequence. Use our Process and Flows PowerPoint Templates because; Use our creative template to lay down your views. Use these PowerPoint slides for presentations relating to abstract, algorithm, arrow, business, chart, connection, design, development, diagram, direction, element, flow, graph, linear, linear diagram, management, organization, plan, process, section, segment, set, sign, solution, strategy, symbol, vector. The prominent colors used in the PowerPoint template are Blue, Gray, and White Meet your targets with our Ppt Theme Progression Of 2 Phase Diagram Flow Spider PowerPoint Template Graphic. You will come out on top.
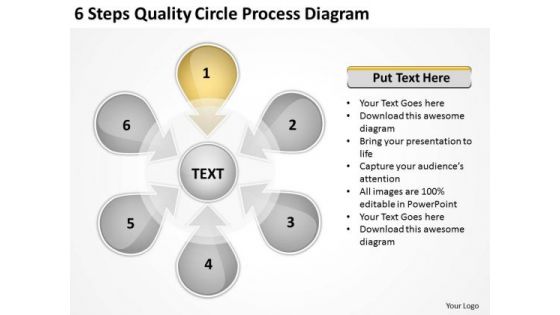
6 Steps Quality Circle Process Diagram How To Make Business Plan PowerPoint Templates
We present our 6 steps quality circle process diagram how to make business plan PowerPoint templates.Use our Arrows PowerPoint Templates because Our PowerPoint Templates and Slides will provide you a launch platform. Give a lift off to your ideas and send them into orbit. Download and present our Business PowerPoint Templates because You can Stir your ideas in the cauldron of our PowerPoint Templates and Slides. Cast a magic spell on your audience. Present our Circle Charts PowerPoint Templates because You have gained great respect for your brilliant ideas. Use our PowerPoint Templates and Slides to strengthen and enhance your reputation. Present our Process and Flows PowerPoint Templates because Our PowerPoint Templates and Slides will generate and maintain the level of interest you desire. They will create the impression you want to imprint on your audience. Download and present our Shapes PowerPoint Templates because Our PowerPoint Templates and Slides are designed to help you succeed. They have all the ingredients you need.Use these PowerPoint slides for presentations relating to Abstract, access, arrow, background, banner, bright, business, chart, circle, concept, conceptual, connection, corporate, creative, cycle, design,different, element, empty, form, frame, graphic, group, idea, illustration, order, part, piece, place, process, shape, solution, special, strategy, template, text, usable, web, website. The prominent colors used in the PowerPoint template are Yellow, Gray, White. Achieve contemporary management style with our 6 Steps Quality Circle Process Diagram How To Make Business Plan PowerPoint Templates. They will make you look good.
Bar Chart Ppt PowerPoint Presentation Icon Graphics
This is a bar chart ppt powerpoint presentation icon graphics. This is a twelve stage process. The stages in this process are bar chart, marketing, management, planning, strategy.
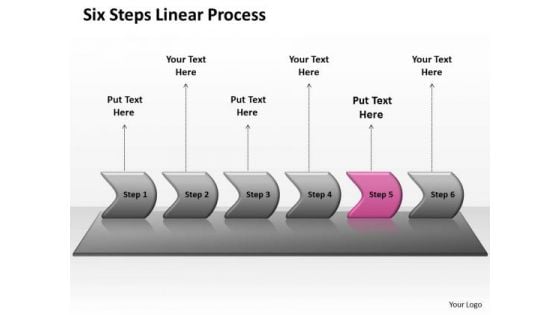
Marketing Ppt Template Six Practice The PowerPoint Macro Steps Linear Process 6 Image
We present our marketing PPT template six practice the PowerPoint macro steps linear process 6 Image. Use our Arrows PowerPoint Templates because, Targets: - You have a handle on all the targets, a master of the game, the experienced and consummate juggler. Use our Layers PowerPoint Templates because, Amplify on your plans to have dedicated sub groups working on related butdistinct tasks. Use our Shapes PowerPoint Templates because; have fired the dreams of many fertile minds. Use our Business PowerPoint Templates because, Marketing Strategy Business Template: - Maximizing sales of your product is the intended destination. Use our Process and Flows PowerPoint Templates because, your quicksilver ideas are the arrows in your quiver. Use these PowerPoint slides for presentations relating to abstract, algorithm, arrow, block diagram, business, chart, color, connection, design, development, diagram, direction, element, flow, graph, linear, linear diagram, management, organization, plan, process, section, segment, set, sign, solution, strategy, symbol, technology, vector. The prominent colors used in the PowerPoint template are Pink, Gray, and Black Our Marketing Ppt Template Six Practice The PowerPoint Macro Steps Linear Process 6 Image disprove many a fallacy. They never fail to discern the truth.
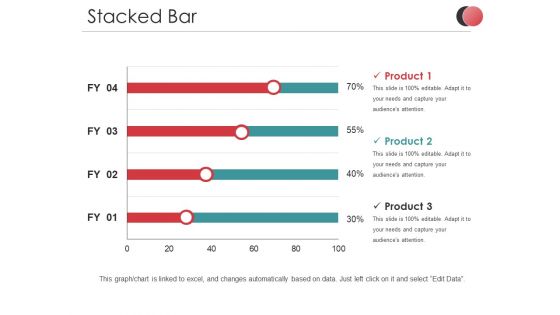
Stacked Bar Ppt PowerPoint Presentation Pictures Graphics
This is a stacked bar ppt powerpoint presentation pictures graphics. This is a three stage process. The stages in this process are product, percentage, business, marketing, finance.
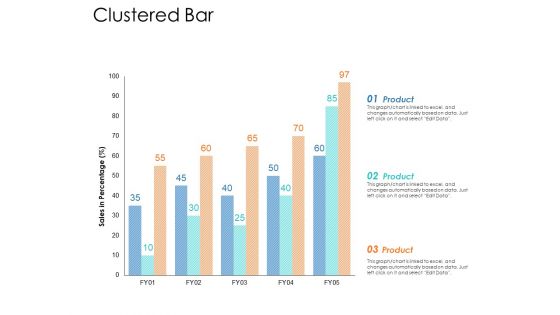
Clustered Bar Ppt Powerpoint Presentation Model Graphics
Presenting this set of slides with name clustered bar ppt powerpoint presentation model graphics. The topics discussed in these slide is clustered bar . This is a completely editable PowerPoint presentation and is available for immediate download. Download now and impress your audience.
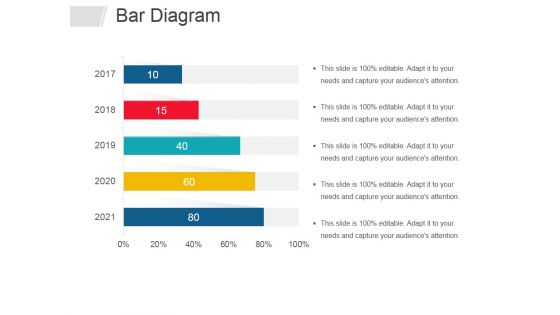
Bar Diagram Ppt PowerPoint Presentation File Graphics
This is a bar diagram ppt powerpoint presentation file graphics. This is a five stage process. The stages in this process are bar diagram, business, years, marketing, management.
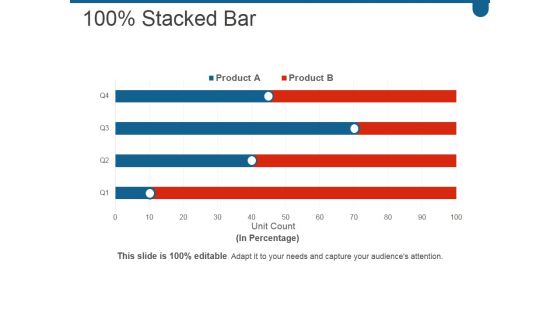
Stacked Bar Ppt PowerPoint Presentation File Graphics Example
This is a stacked bar ppt powerpoint presentation file graphics example. This is a four stage process. The stages in this process are business, marketing, bar, graph, percentage.
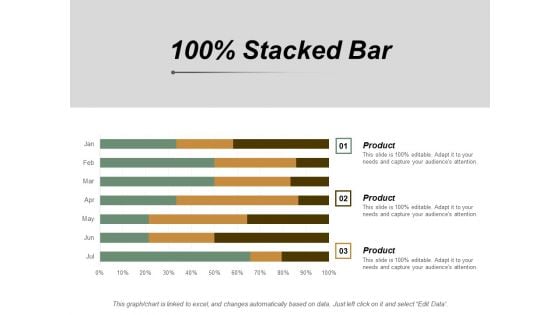
100 Percent Stacked Bar Ppt PowerPoint Presentation Layouts Graphics Template
This is a 100 percent stacked bar ppt powerpoint presentation layouts graphics template. This is a three stage process. The stages in this process are finance, marketing, management, investment, analysis.
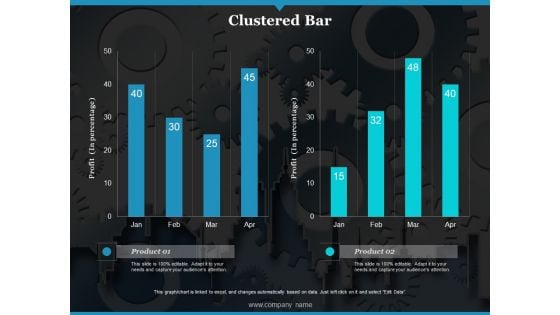
Clustered Bar Ppt PowerPoint Presentation Slides Graphic Tips
This is a clustered bar ppt powerpoint presentation slides graphic tips. This is a two stage process. The stages in this process are profit, product, clustered bar.
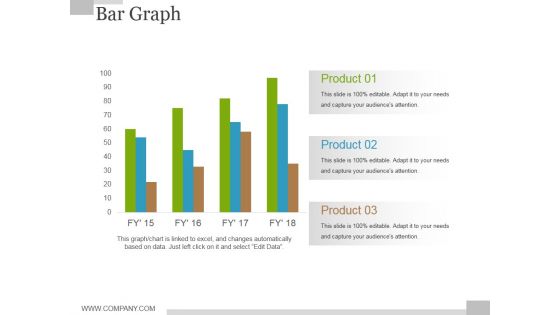
Bar Graph Ppt PowerPoint Presentation File Graphics Template
This is a bar graph ppt powerpoint presentation file graphics template. This is a four stage process. The stages in this process are product, business, graph, growth, success.
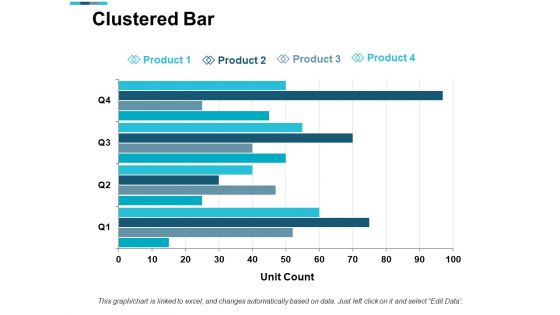
Clustered Bar Finance Ppt PowerPoint Presentation Gallery Graphics Design
This is a clustered bar finance ppt powerpoint presentation gallery graphics design. This is a four stage process. The stages in this process are finance, analysis, business, investment, marketing.
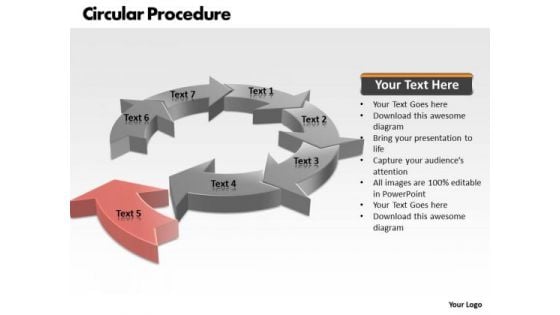
Ppt Concepts Of Circular Process PowerPoint Presentation 7 Stages Templates
PPT concepts of circular process powerpoint presentation 7 stages Templates-Original thinking is the need of the hour. We provide the means to project your views.\nPresent your views using this innovative slide and be assured of leaving a lasting impression\n-PPT concepts of circular process powerpoint presentation 7 stages Templates-Arrow, Chart, Circular Procedure, Color, Colorful, Connect, Connection, Design, Diagram, Finance, Graphic, Group, Growth, Icon, Illustration, Marketing, Pieces, Process, Recycle, Recycling, Round, Set, Strategy, Symbol, Wheel Achieve consensus with our Ppt Concepts Of Circular Process PowerPoint Presentation 7 Stages Templates. They have the ability to get people to agree.
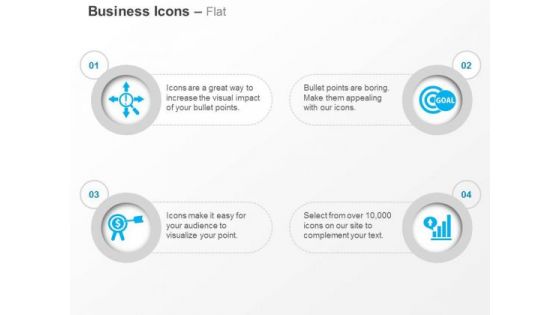
Time Management Target Goal Bar Graph Ppt Slides Graphics
This power point template has been crafted with icons of time management, target, goal and bar graph. This icon slide can be used for business analysis and time planning. Build an innovative presentation with all these professional icons.
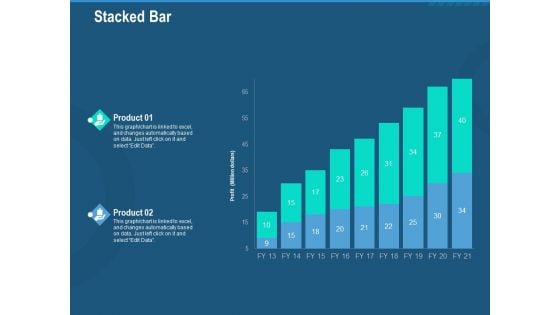
Investment Pitch To Generate Capital From Series B Venture Round Stacked Bar Graphics PDF
Deliver an awe-inspiring pitch with this creative investment pitch to generate capital from series b venture round stacked bar graphics pdf bundle. Topics like Stacked bar can be discussed with this completely editable template. It is available for immediate download depending on the needs and requirements of the user.
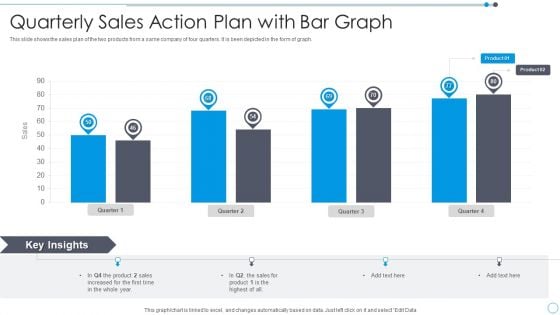
Quarterly Sales Action Plan With Bar Graph Graphics PDF
This slide shows the sales plan of the two products from a same company of four quarters. It is been depicted in the form of graph.Showcasing this set of slides titled Quarterly Sales Action Plan With Bar Graph Graphics PDF. The topics addressed in these templates are Quarterly Sales Action Plan With Bar Graph. All the content presented in this PPT design is completely editable. Download it and make adjustments in color, background, font etc. as per your unique business setting.
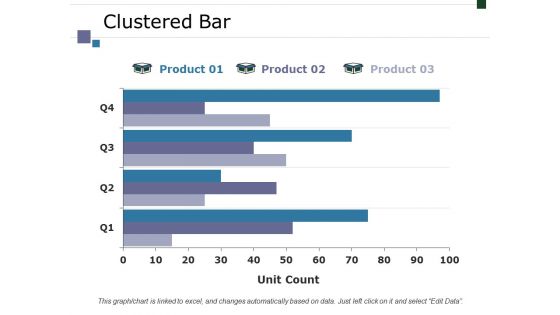
Clustered Bar Ppt PowerPoint Presentation Styles Graphics
This is a clustered bar ppt powerpoint presentation styles graphics. This is a three stage process. The stages in this process are business, marketing, finance, graph, strategy, unit count.
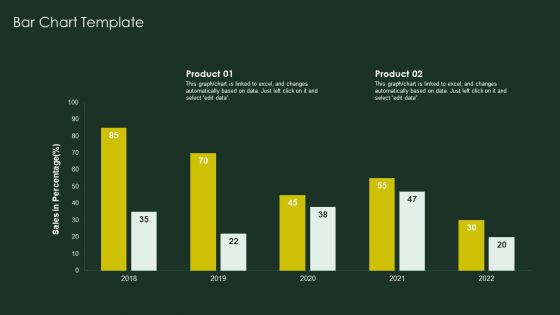
Global Automobile Sector Overview Bar Chart Template Graphics PDF
Deliver an awe inspiring pitch with this creative Global Automobile Sector Overview Bar Chart Template Graphics PDF bundle. Topics like Bar Chart Template can be discussed with this completely editable template. It is available for immediate download depending on the needs and requirements of the user.
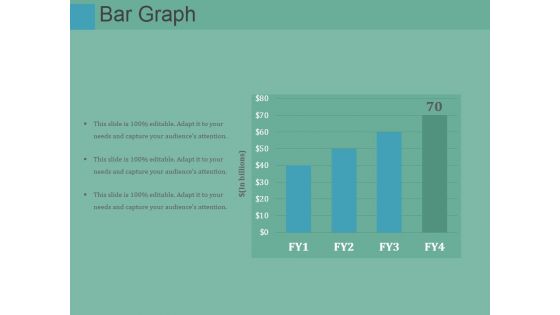
Bar Graph Ppt PowerPoint Presentation Gallery Graphics
This is a bar graph ppt powerpoint presentation gallery graphics. This is a four stage process. The stages in this process are bar graph, management, planning, marketing, business.
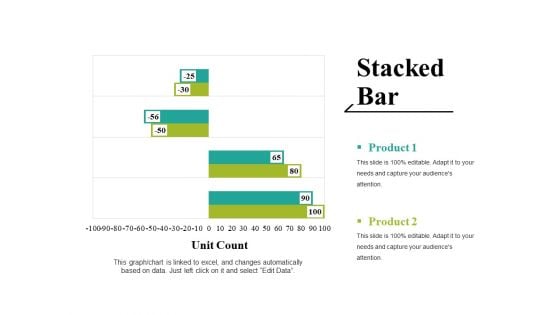
Stacked Bar Ppt PowerPoint Presentation Ideas Graphics Tutorials
This is a stacked bar ppt powerpoint presentation ideas graphics tutorials. This is a two stage process. The stages in this process are unit count, graph, business, marketing, strategy.
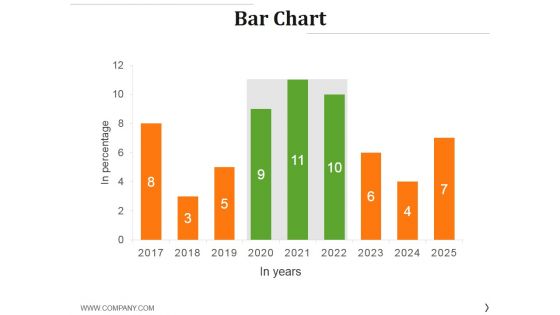
Bar Chart Ppt PowerPoint Presentation Styles Graphics Example
This is a bar chart ppt powerpoint presentation styles graphics example. This is a nine stage process. The stages in this process are graph, growth, success, business, finance.
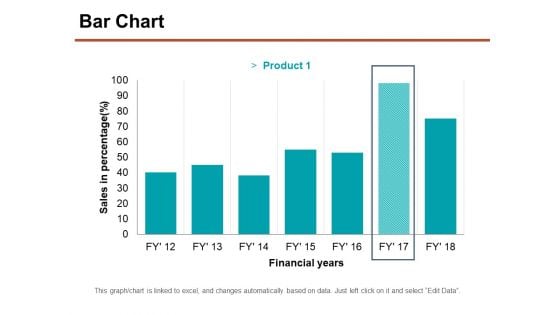
Bar Chart Ppt PowerPoint Presentation Professional Graphics Download
This is a bar chart ppt powerpoint presentation professional graphics download. This is a seven stage process. The stages in this process are sales in percentage, financial years, chart, business.
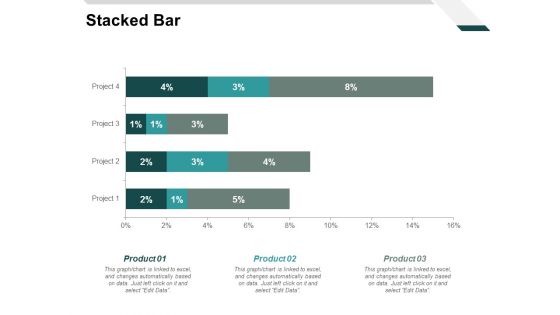
Stacked Bar Analysis Ppt PowerPoint Presentation Styles Graphics Tutorials
Presenting this set of slides with name stacked bar analysis ppt powerpoint presentation styles graphics tutorials. The topics discussed in these slides are finance, marketing, management, investment, analysis. This is a completely editable PowerPoint presentation and is available for immediate download. Download now and impress your audience.
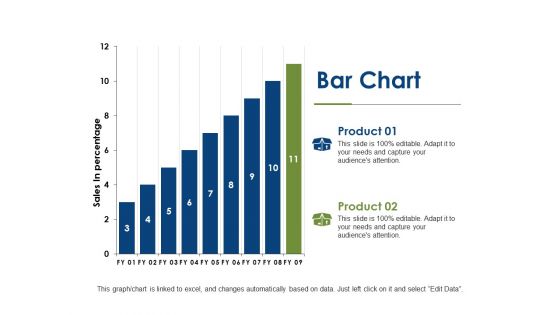
Bar Chart Growth Ppt PowerPoint Presentation Gallery Graphics
This is a bar chart growth ppt powerpoint presentation gallery graphics. This is a two stage process. The stages in this process are analysis, business, finance, investment, strategy.
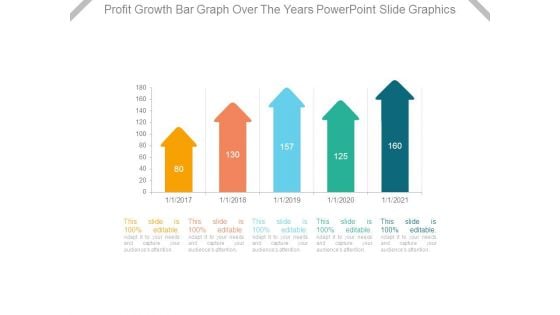
Profit Growth Bar Graph Over The Years Powerpoint Slide Graphics
This is a profit growth bar graph over the years powerpoint slide graphics. This is a four stage process. The stages in this process are bar graph, arrows, years, business, growth, marketing.
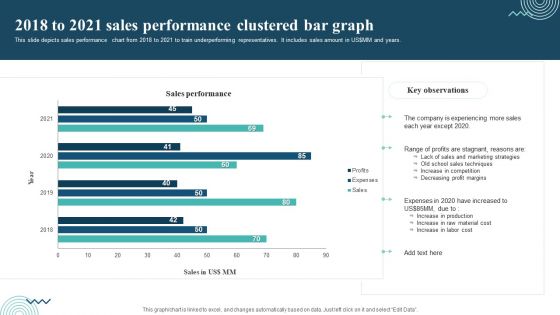
2018 To 2021 Sales Performance Clustered Bar Graph Graphics PDF
Showcasing this set of slides titled 2018 To 2021 Sales Performance Clustered Bar Graph Graphics PDF. The topics addressed in these templates are Range Of Profits, Increase In Production, Profits Are Stagnant. All the content presented in this PPT design is completely editable. Download it and make adjustments in color, background, font etc. as per your unique business setting.
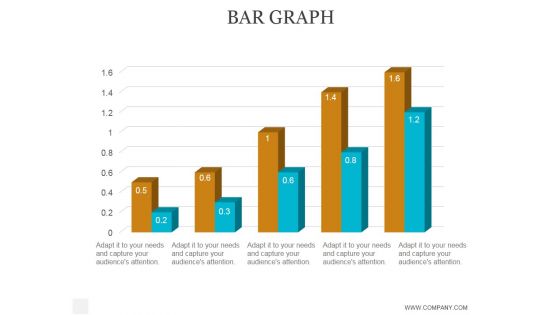
Bar Graph Ppt PowerPoint Presentation Graphics
This is a bar graph ppt powerpoint presentation graphics. This is a five stage process. The stages in this process are business, strategy, marketing, analysis, success, bar graph, growth.
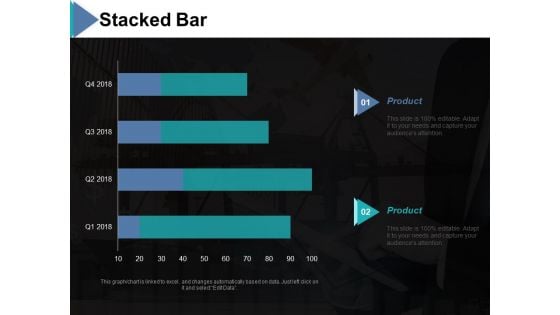
Stacked Bar Ppt PowerPoint Presentation Model Graphics
This is a stacked bar ppt powerpoint presentation model graphics. This is a two stage process. The stages in this process are stacked bar, product, chart and graph, finance, business.
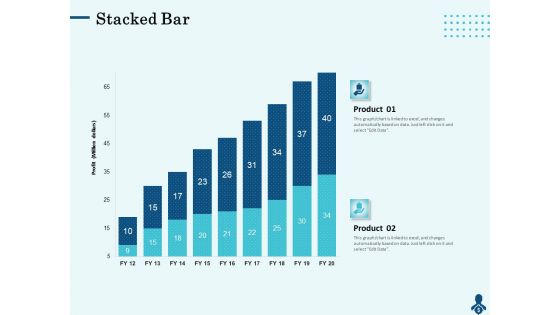
Competitive Intelligence Frameworks Stacked Bar Ppt Layouts Graphics PDF
Presenting this set of slides with name competitive intelligence frameworks stacked bar ppt layouts graphics pdf. The topics discussed in these slide is stacked bar. This is a completely editable PowerPoint presentation and is available for immediate download. Download now and impress your audience.
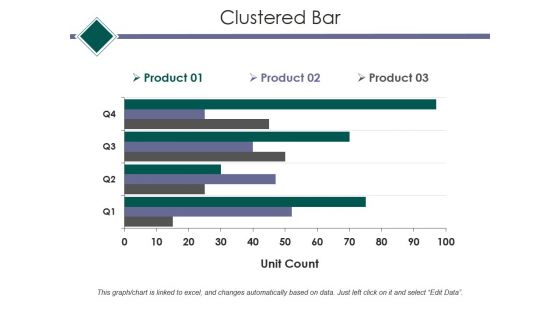
Clustered Bar Ppt PowerPoint Presentation Outline Graphics Design
This is a clustered bar ppt powerpoint presentation outline graphics design. This is a three stage process. The stages in this process are clustered bar, finance, marketing, strategy, analysis, business.
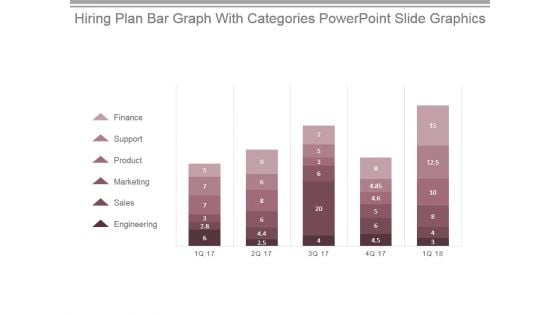
Hiring Plan Bar Graph With Categories Powerpoint Slide Graphics
This is a hiring plan bar graph with categories powerpoint slide graphics. This is a five stage process. The stages in this process are finance, support, product, marketing, sales, engineering.
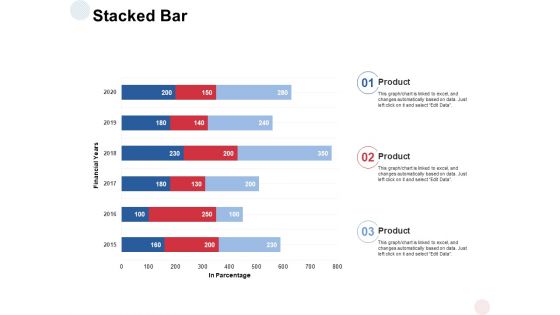
Stacked Bar Analysis Ppt PowerPoint Presentation Styles Graphics Template
Presenting this set of slides with name stacked bar analysis ppt powerpoint presentation styles graphics template. The topics discussed in these slides are stacked bar, financial years, percentage. This is a completely editable PowerPoint presentation and is available for immediate download. Download now and impress your audience.
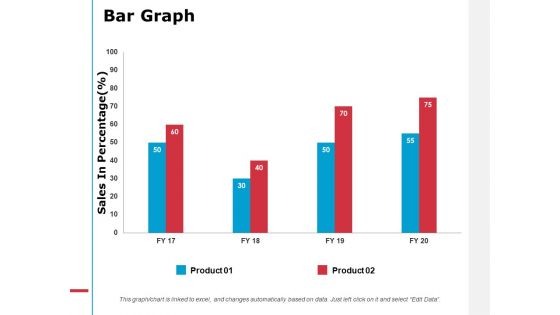
Bar Graph Analysis Ppt PowerPoint Presentation Summary Graphics Design
Presenting this set of slides with name bar graph analysis ppt powerpoint presentation summary graphics design. The topics discussed in these slides are bar graph. This is a completely editable PowerPoint presentation and is available for immediate download. Download now and impress your audience.
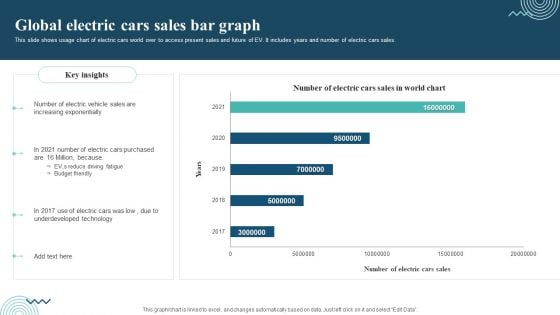
Global Electric Cars Sales Bar Graph Graphics PDF
This slide shows usage chart of electric cars world over to access present sales and future of EV. It includes years and number of electric cars sales. Showcasing this set of slides titled Global Electric Cars Sales Bar Graph Graphics PDF. The topics addressed in these templates are Electric Vehicle Sales, Electric Cars Purchased, Underdeveloped Technology. All the content presented in this PPT design is completely editable. Download it and make adjustments in color, background, font etc. as per your unique business setting.
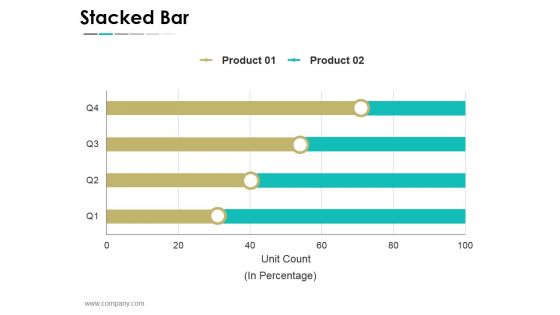
Stacked Bar Ppt PowerPoint Presentation Infographics Graphics
This is a stacked bar ppt powerpoint presentation infographics graphics. This is a four stage process. The stages in this process are business, strategy, marketing, success, unit count, in percentage.
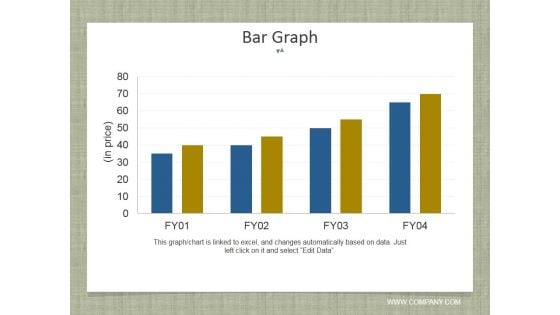
Bar Graph Ppt PowerPoint Presentation Pictures Graphics
This is a bar graph ppt powerpoint presentation pictures graphics. This is a four stage process. The stages in this process are business, marketing, bar graph, success, growth.
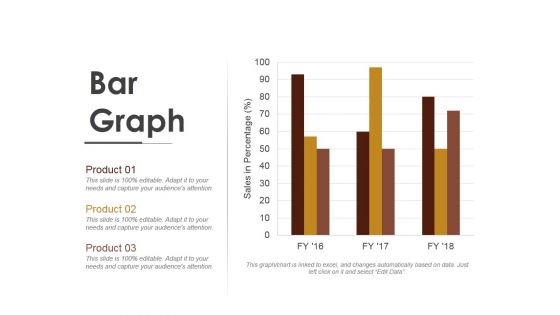
Bar Graph Ppt Powerpoint Presentation File Graphics
This is a bar graph ppt powerpoint presentation file graphics. This is a three stage process. The stages in this process are product, graph, management, business, marketing.
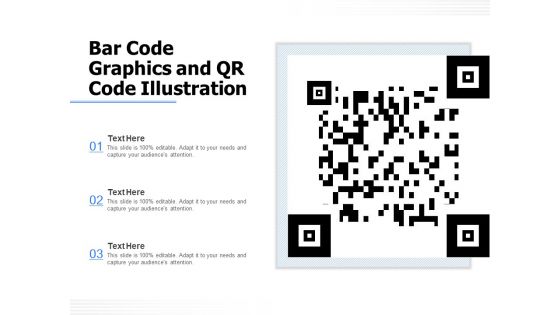
Bar Code Graphics And QR Code Illustration Ppt PowerPoint Presentation File Example Topics PDF
Pitch your topic with ease and precision using this bar code graphics and qr code illustration ppt powerpoint presentation file example topics pdf. This layout presents information on bar code graphics and qr code illustration. It is also available for immediate download and adjustment. So, changes can be made in the color, design, graphics or any other component to create a unique layout.
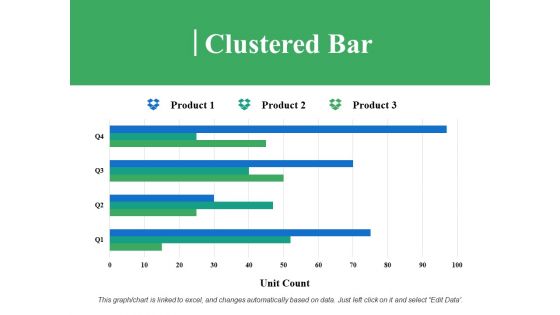
Clustered Bar Ppt PowerPoint Presentation Portfolio Graphics Design
This is a clustered bar ppt powerpoint presentation portfolio graphics design. This is a three stage process. The stages in this process are clustered bar, unit count, product.
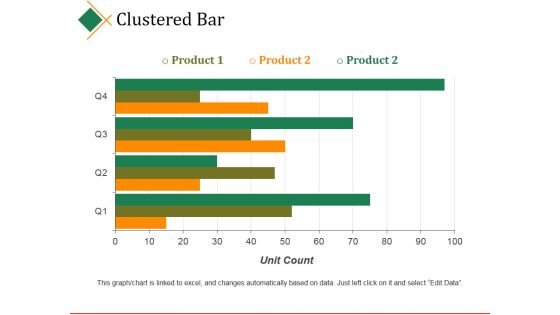
Clustered Bar Ppt PowerPoint Presentation Portfolio Graphics Template
This is a clustered bar ppt powerpoint presentation portfolio graphics template. This is a four stage process. The stages in this process are business, product, unit count, step, marketing.
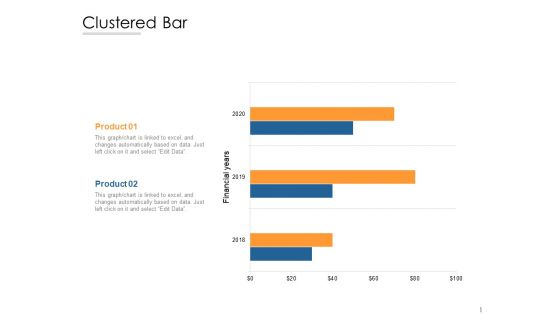
Clustered Bar Ppt PowerPoint Presentation File Graphics Download
Presenting this set of slides with name clustered bar ppt powerpoint presentation file graphics download. The topics discussed in these slide is clustered bar. This is a completely editable PowerPoint presentation and is available for immediate download. Download now and impress your audience.
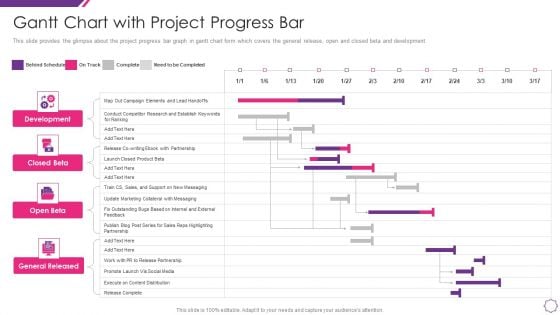
Handle Project Escalations Gantt Chart With Project Progress Bar Ppt Layouts Graphics Design PDF
This slide provides the glimpse about the project progress bar graph in gantt chart form which covers the general release, open and closed beta and development. Introducing our handle project escalations gantt chart with project progress bar ppt layouts graphics design pdf that is designed to showcase some of the vital components that will help you create timelines, roadmaps, and project plans. In addition, also communicate your project durations, milestones, tasks, subtasks, dependencies, and other attributes using this well structured handle project escalations gantt chart with project progress bar ppt layouts graphics design pdf template. You can also exhibit preeminence against time by deploying this easily adaptable slide to your business presentation. Our experts have designed this template in such a way that it is sure to impress your audience. Thus, download it and steer your project meetings, meetups, and conferences.
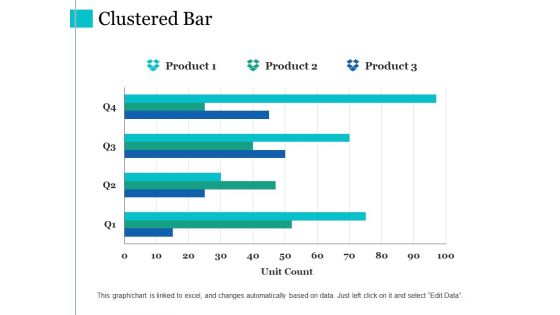
Clustered Bar Ppt PowerPoint Presentation Pictures Graphic Images
This is a clustered bar ppt powerpoint presentation pictures graphic images. This is a three stage process. The stages in this process are clustered bar, product, unit count.
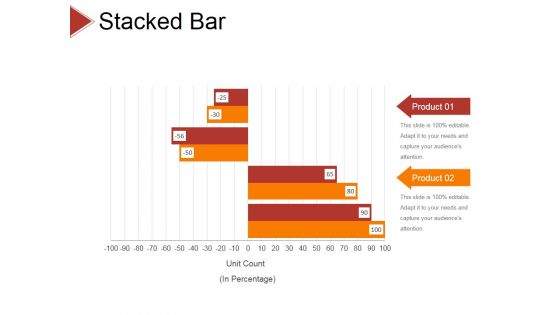
Stacked Bar Ppt PowerPoint Presentation Layouts Graphic Tips
This is a stacked bar ppt powerpoint presentation layouts graphic tips. This is a two stage process. The stages in this process are business, strategy, analysis, pretention, stacked bar, finance.
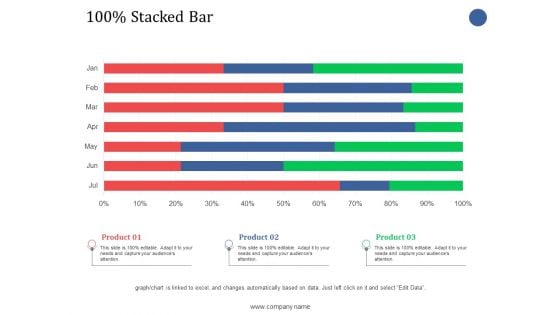
Stacked Bar Ppt PowerPoint Presentation Infographic Template Graphics
This is a stacked bar ppt powerpoint presentation infographic template graphics. This is a three stage process. The stages in this process are stacked bar, finance, product, business.
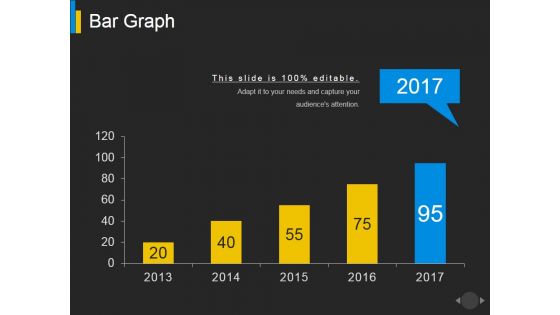
Bar Graph Ppt PowerPoint Presentation Pictures Graphics Pictures
This is a bar graph ppt powerpoint presentation pictures graphics pictures. This is a five stage process. The stages in this process are graph, growth, business, marketing, finance.
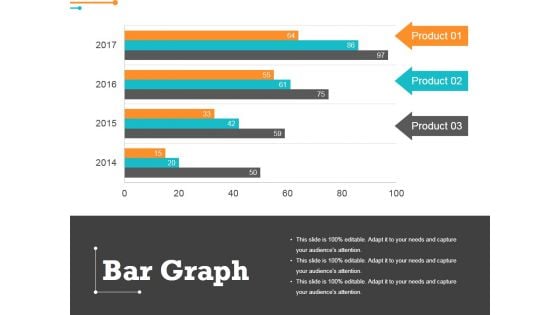
Bar Graph Ppt Powerpoint Presentation Slides Graphics Design
This is a bar graph ppt powerpoint presentation slides graphics design. This is a three stage process. The stages in this process are product, graph, marketing, finance.
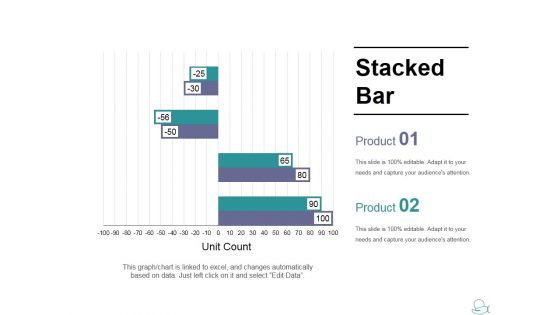
Stacked Bar Ppt PowerPoint Presentation Infographic Template Graphics Download
This is a stacked bar ppt powerpoint presentation infographic template graphics download. This is a two stage process. The stages in this process are product, stacked bar, business, unit count, marketing.
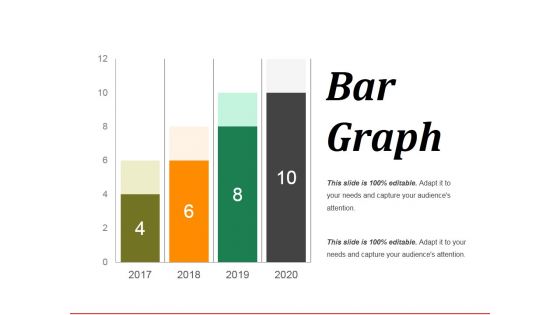
Bar Graph Ppt PowerPoint Presentation Model Graphics Design
This is a bar graph ppt powerpoint presentation model graphics design. This is a four stage process. The stages in this process are bar graph, growth, success, business, marketing.
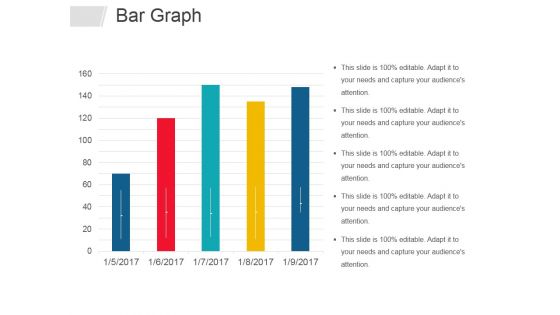
Bar Graph Ppt PowerPoint Presentation Infographics Graphics Design
This is a bar graph ppt powerpoint presentation infographics graphics design. This is a five stage process. The stages in this process are bar graph, business, years, marketing, management.
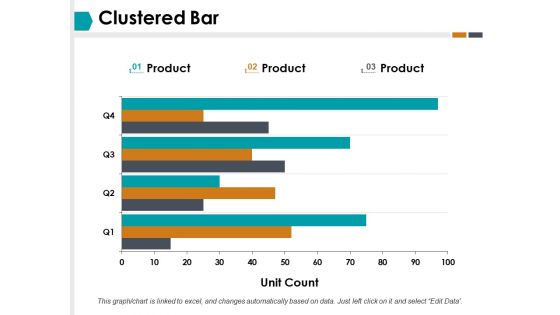
Clustered Bar Finance Ppt PowerPoint Presentation Infographics Graphics Template
This is a clustered bar finance ppt powerpoint presentation infographics graphics template. This is a three stage process. The stages in this process are clustered bar, finance, business, investment, marketing.
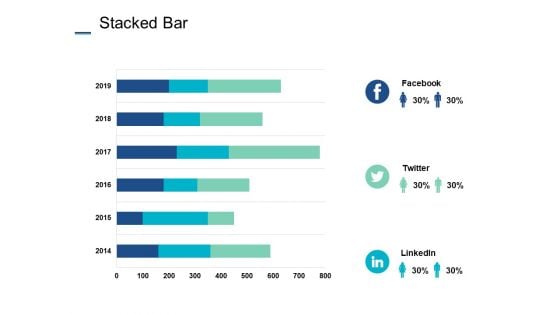
Stacked Bar Investment Ppt PowerPoint Presentation Ideas Graphics Tutorials
This is a stacked bar investment ppt powerpoint presentation ideas graphics tutorials. This is a three stage process. The stages in this process are stacked bar, finance, marketing, analysis, business, investment.
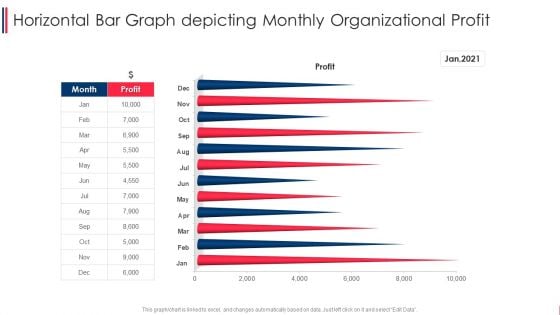
Horizontal Bar Graph Depicting Monthly Organizational Profit Graphics PDF
Pitch your topic with ease and precision using this horizontal bar graph depicting monthly organizational profit graphics pdf. This layout presents information on horizontal bar graph depicting monthly organizational profit. It is also available for immediate download and adjustment. So, changes can be made in the color, design, graphics or any other component to create a unique layout.
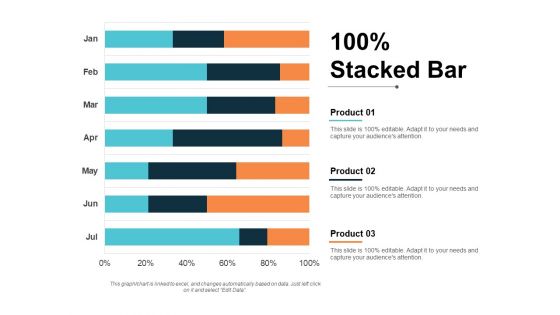
stacked bar finance ppt powerpoint presentation show graphics pictures
This is a stacked bar finance ppt powerpoint presentation show graphics pictures. This is a three stage process. The stages in this process are finance, marketing, management, investment, analysis.
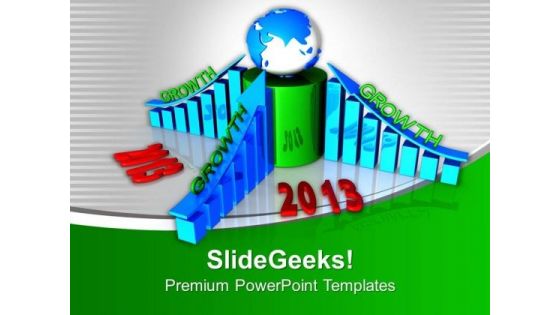
3d Business Bar Graph Growth Of Year 2013 PowerPoint Templates Ppt Backgrounds For Slides 1212
We present our 3d Business Bar Graph Growth Of Year 2013 PowerPoint Templates PPT Backgrounds For Slides 1212.Download our Americana PowerPoint Templates because it is inspired by the indelible Olympic logo this graphic exemplifies the benefits of teamwork. Download our Success PowerPoint Templates because iT outlines the entire thought process for the benefit of others. Tell it to the world with your characteristic aplomb. Download our Targets PowerPoint Templates because motivating your team will cross all barriers. Download our Business PowerPoint Templates because this is the unerring accuracy in reaching the target. the effortless ability to launch into flight. Download our Marketing PowerPoint Templates because all elements of the venture are equally critical.Use these PowerPoint slides for presentations relating to 2013 american growth business graph, americana, business, marketing, success, targets. The prominent colors used in the PowerPoint template are Blue, Green, White. Professionals tell us our 3d Business Bar Graph Growth Of Year 2013 PowerPoint Templates PPT Backgrounds For Slides 1212 help you meet deadlines which are an element of today's workplace. Just browse and pick the slides that appeal to your intuitive senses. We assure you our graph PowerPoint templates and PPT Slides are Awesome. PowerPoint presentation experts tell us our 3d Business Bar Graph Growth Of Year 2013 PowerPoint Templates PPT Backgrounds For Slides 1212 are Youthful. Presenters tell us our business PowerPoint templates and PPT Slides are Quaint. The feedback we get is that our 3d Business Bar Graph Growth Of Year 2013 PowerPoint Templates PPT Backgrounds For Slides 1212 will save the presenter time. You can be sure our business PowerPoint templates and PPT Slides are Nice. Our 3d Business Bar Graph Growth Of Year 2013 PowerPoint Templates Ppt Backgrounds For Slides 1212 are in the business of asset building. They are committed to empowering clients.


 Continue with Email

 Home
Home


