5 Year Growth Plan

Impact On Revenue Due To Increasing Cybersecurity Cases Mockup PDF
This slide shows the revenue trends of ABS Healthcare Company for the past 5 years. The revenue is constantly declining due to extra spend on faulty cybersecurity transactions. Deliver an awe inspiring pitch with this creative impact on revenue due to increasing cybersecurity cases mockup pdf bundle. Topics like impact on revenue due to increasing cybersecurity cases, 2017 to 2021 can be discussed with this completely editable template. It is available for immediate download depending on the needs and requirements of the user.
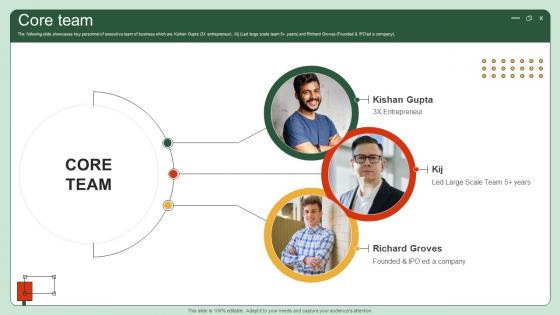
Core Team UI UX Enhancement Solution Investor Funding Elevator Pitch Deck
The following slide showcases key personnel of executive team of business which are Kishan Gupta 3X entrepreneur, Kij Led large scale team 5 plus years and Richard Groves Founded and IPOed a company. Do you have to make sure that everyone on your team knows about any specific topic I yes, then you should give Core Team UI UX Enhancement Solution Investor Funding Elevator Pitch Deck a try. Our experts have put a lot of knowledge and effort into creating this impeccable Core Team UI UX Enhancement Solution Investor Funding Elevator Pitch Deck. You can use this template for your upcoming presentations, as the slides are perfect to represent even the tiniest detail. You can download these templates from the Slidegeeks website and these are easy to edit. So grab these today The following slide showcases key personnel of executive team of business which are Kishan Gupta 3X entrepreneur, Kij Led large scale team 5 plus years and Richard Groves Founded and IPOed a company.
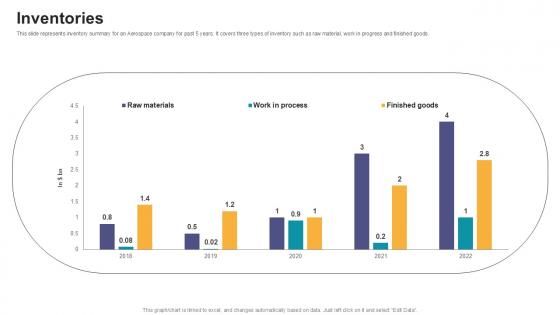
Inventories Digital Marketings Strategies PPT PowerPoint CP SS V
This slide represents inventory summary for an Aerospace company for past 5 years. It covers three types of inventory such as raw material, work in progress and finished goods. Formulating a presentation can take up a lot of effort and time, so the content and message should always be the primary focus. The visuals of the PowerPoint can enhance the presenters message, so our Inventories Digital Marketings Strategies PPT PowerPoint CP SS V was created to help save time. Instead of worrying about the design, the presenter can concentrate on the message while our designers work on creating the ideal templates for whatever situation is needed. Slidegeeks has experts for everything from amazing designs to valuable content, we have put everything into Inventories Digital Marketings Strategies PPT PowerPoint CP SS V This slide represents inventory summary for an Aerospace company for past 5 years. It covers three types of inventory such as raw material, work in progress and finished goods.
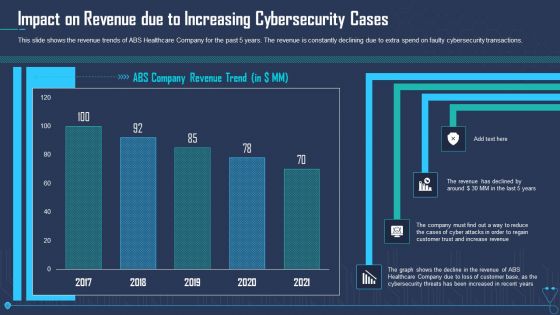
Impact On Revenue Due To Increasing Cybersecurity Cases Ppt Inspiration Infographics PDF
This slide shows the revenue trends of ABS Healthcare Company for the past 5 years. The revenue is constantly declining due to extra spend on faulty cybersecurity transactions. Deliver an awe inspiring pitch with this creative impact on revenue due to increasing cybersecurity cases ppt inspiration infographics pdf bundle. Topics like impact on revenue due to increasing cybersecurity cases can be discussed with this completely editable template. It is available for immediate download depending on the needs and requirements of the user.
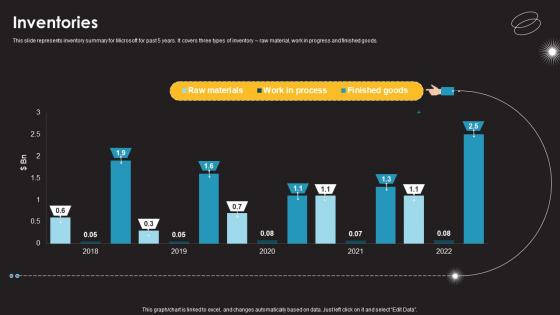
Inventories Information Technology Services Provider Company Profile CP SS V
This slide represents inventory summary for Microsoft for past 5 years. It covers three types of inventory raw material, work in progress and finished goods.Are you in need of a template that can accommodate all of your creative concepts This one is crafted professionally and can be altered to fit any style. Use it with Google Slides or PowerPoint. Include striking photographs, symbols, depictions, and other visuals. Fill, move around, or remove text boxes as desired. Test out color palettes and font mixtures. Edit and save your work, or work with colleagues. Download Inventories Information Technology Services Provider Company Profile CP SS V and observe how to make your presentation outstanding. Give an impeccable presentation to your group and make your presentation unforgettable. This slide represents inventory summary for Microsoft for past 5 years. It covers three types of inventory raw material, work in progress and finished goods.
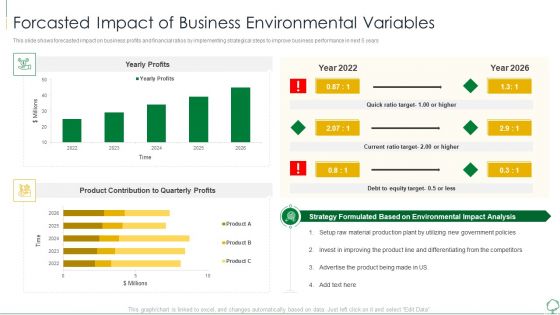
Environmental Examination Tools And Approaches Forcasted Impact Of Business Diagrams PDF
This slide shows forecasted impact on business profits and financial ratios by implementing strategical steps to improve business performance in next 5 years. Deliver an awe inspiring pitch with this creative environmental examination tools and approaches forcasted impact of business diagrams pdf bundle. Topics like product, quarterly profits, material, analysis can be discussed with this completely editable template. It is available for immediate download depending on the needs and requirements of the user.
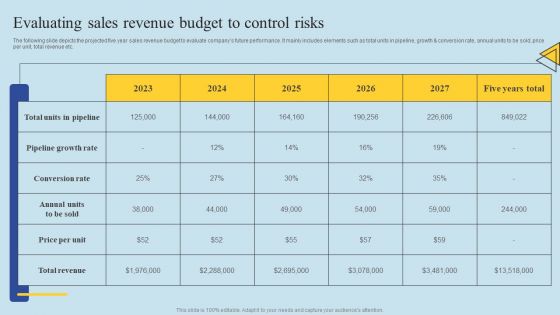
Determining Risks In Sales Administration Procedure Evaluating Sales Revenue Budget To Control Risks Portrait PDF
The following slide depicts the projected five year sales revenue budget to evaluate companys future performance. It mainly includes elements such as total units in pipeline, growth and conversion rate, annual units to be sold, price per unit, total revenue etc. The best PPT templates are a great way to save time, energy, and resources. Slidegeeks have 100 percent editable powerpoint slides making them incredibly versatile. With these quality presentation templates, you can create a captivating and memorable presentation by combining visually appealing slides and effectively communicating your message. Download Determining Risks In Sales Administration Procedure Evaluating Sales Revenue Budget To Control Risks Portrait PDF from Slidegeeks and deliver a wonderful presentation.
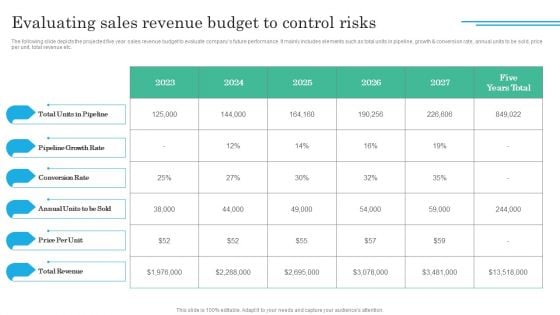
Implementing Sales Volatility Management Techniques Evaluating Sales Revenue Budget To Control Summary PDF
The following slide depicts the projected five year sales revenue budget to evaluate companys future performance. It mainly includes elements such as total units in pipeline, growth and conversion rate, annual units to be sold, price per unit, total revenue etc. From laying roadmaps to briefing everything in detail, our templates are perfect for you. You can set the stage with your presentation slides. All you have to do is download these easy to edit and customizable templates. Implementing Sales Volatility Management Techniques Evaluating Sales Revenue Budget To Control Summary PDF will help you deliver an outstanding performance that everyone would remember and praise you for. Do download this presentation today.
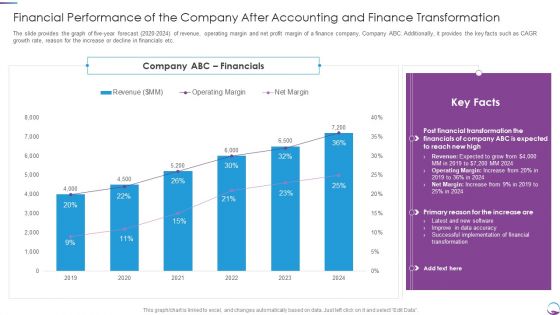
Financial Performance Of The Company After Accounting And Finance Transformation Mockup PDF
The slide provides the graph of five year forecast 2020 to 2024 of revenue, operating margin and net profit margin of a finance company, Company ABC. Additionally, it provides the key facts such as CAGR growth rate, reason for the increase or decline in financials etc. Deliver and pitch your topic in the best possible manner with this Financial Performance Of The Company After Accounting And Finance Transformation Mockup PDF. Use them to share invaluable insights on Financial, Revenue, Margin, Implementation and impress your audience. This template can be altered and modified as per your expectations. So, grab it now.
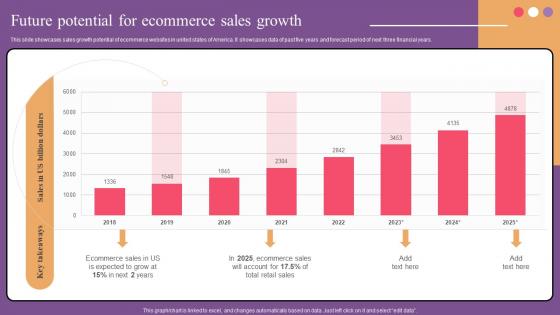
Future Potential For Ecommerce Sales Website Optimization To Improve Product Sale Clipart Pdf
This slide showcases sales growth potential of ecommerce websites in united states of America. It showcases data of past five years and forecast period of next three financial years. Crafting an eye catching presentation has never been more straightforward. Let your presentation shine with this tasteful yet straightforward Future Potential For Ecommerce Sales Website Optimization To Improve Product Sale Clipart Pdf template. It offers a minimalistic and classy look that is great for making a statement. The colors have been employed intelligently to add a bit of playfulness while still remaining professional. Construct the ideal Future Potential For Ecommerce Sales Website Optimization To Improve Product Sale Clipart Pdf that effortlessly grabs the attention of your audience Begin now and be certain to wow your customers This slide showcases sales growth potential of ecommerce websites in united states of America. It showcases data of past five years and forecast period of next three financial years.

Evaluating Sales Revenue Budget To Control Risks Sample PDF
The following slide depicts the projected five year sales revenue budget to evaluate companys future performance. It mainly includes elements such as total units in pipeline, growth and conversion rate, annual units to be sold, price per unit, total revenue etc. From laying roadmaps to briefing everything in detail, our templates are perfect for you. You can set the stage with your presentation slides. All you have to do is download these easy to edit and customizable templates. Evaluating Sales Revenue Budget To Control Risks Sample PDF will help you deliver an outstanding performance that everyone would remember and praise you for. Do download this presentation today.
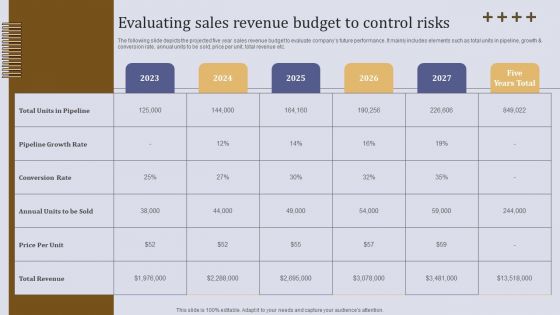
Evaluating Sales Revenue Budget To Control Risks Ppt Slides Infographics PDF
The following slide depicts the projected five year sales revenue budget to evaluate companys future performance. It mainly includes elements such as total units in pipeline, growth and conversion rate, annual units to be sold, price per unit, total revenue etc. Are you searching for a Evaluating Sales Revenue Budget To Control Risks Ppt Slides Infographics PDF that is uncluttered, straightforward, and original Its easy to edit, and you can change the colors to suit your personal or business branding. For a presentation that expresses how much effort you have put in, this template is ideal With all of its features, including tables, diagrams, statistics, and lists, its perfect for a business plan presentation. Make your ideas more appealing with these professional slides. Download Evaluating Sales Revenue Budget To Control Risks Ppt Slides Infographics PDF from Slidegeeks today.
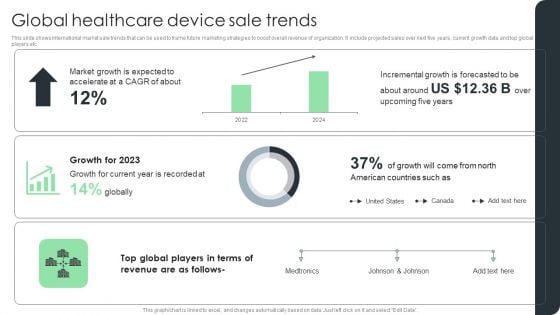
Global Healthcare Device Sale Trends Microsoft PDF
This slide shows international market sale trends that can be used to frame future marketing strategies to boost overall revenue of organization. It include projected sales over next five years, current growth data and top global players etc.Showcasing this set of slides titled Global Healthcare Device Sale Trends Microsoft PDF. The topics addressed in these templates are Market Growth, Incremental Growth, Growth Current. All the content presented in this PPT design is completely editable. Download it and make adjustments in color, background, font etc. as per your unique business setting.
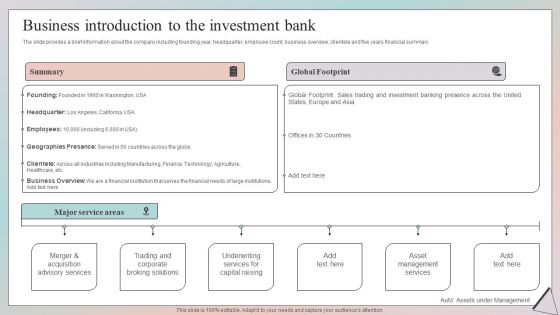
Grow Capital Through Equity Debt Business Introduction To The Investment Bank Ideas PDF
The slide provides a brief information about the company including founding year, headquarter, employee count, business overview, clientele and five years financial summary.Slidegeeks has constructed Grow Capital Through Equity Debt Business Introduction To The Investment Bank Ideas PDF after conducting extensive research and examination. These presentation templates are constantly being generated and modified based on user preferences and critiques from editors. Here, you will find the most attractive templates for a range of purposes while taking into account ratings and remarks from users regarding the content. This is an excellent jumping-off point to explore our content and will give new users an insight into our top-notch PowerPoint Templates.
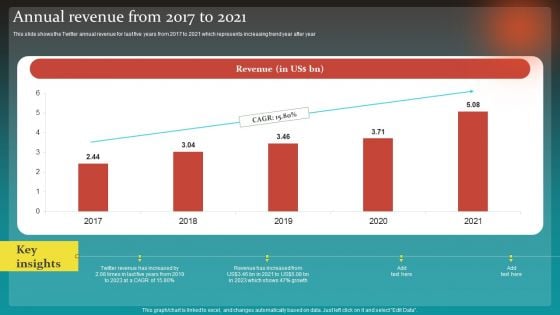
Social Network Business Summary Annual Revenue From 2017 To 2021 Download PDF
This slide shows the Twitter annual revenue for last five years from 2017 to 2021 which represents increasing trend year after year The Social Network Business Summary Annual Revenue From 2017 To 2021 Download PDF is a compilation of the most recent design trends as a series of slides. It is suitable for any subject or industry presentation, containing attractive visuals and photo spots for businesses to clearly express their messages. This template contains a variety of slides for the user to input data, such as structures to contrast two elements, bullet points, and slides for written information. Slidegeeks is prepared to create an impression.
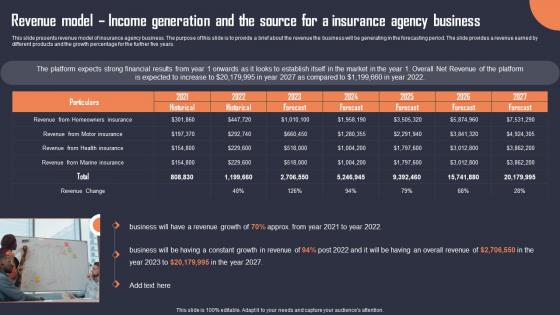
Revenue Model Income Generation And The Source Building An Insurance Company Microsoft Pdf
This slide presents revenue model of insurance agency business. The purpose of this slide is to provide a brief about the revenue the business will be generating in the forecasting period. The slide provides a revenue earned by different products and the growth percentage for the further five years. Crafting an eye-catching presentation has never been more straightforward. Let your presentation shine with this tasteful yet straightforward Revenue Model Income Generation And The Source Building An Insurance Company Microsoft Pdf template. It offers a minimalistic and classy look that is great for making a statement. The colors have been employed intelligently to add a bit of playfulness while still remaining professional. Construct the ideal Revenue Model Income Generation And The Source Building An Insurance Company Microsoft Pdf that effortlessly grabs the attention of your audience. Begin now and be certain to wow your customers. This slide presents revenue model of insurance agency business. The purpose of this slide is to provide a brief about the revenue the business will be generating in the forecasting period. The slide provides a revenue earned by different products and the growth percentage for the further five years.
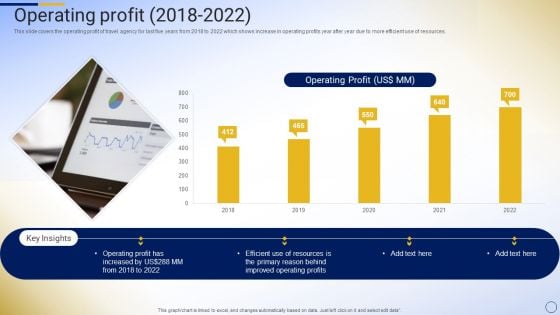
Online Tour And Travel Company Profile Operating Profit 2018 To 2022 Diagrams PDF
This slide covers the operating profit of travel agency for last five years from 2018 to 2022 which shows increase in operating profits year after year due to more efficient use of resources.Deliver and pitch your topic in the best possible manner with this Online Tour And Travel Company Profile Operating Profit 2018 To 2022 Diagrams PDF. Use them to share invaluable insights on Operating Profit, Improved Operating, Primary Reason and impress your audience. This template can be altered and modified as per your expectations. So, grab it now.
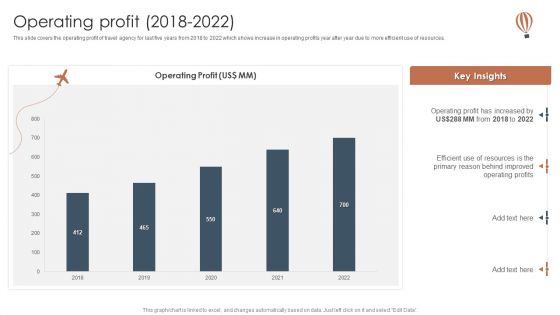
Tour And Travels Agency Profile Operating Profit 2018 To 2022 Ideas PDF
This slide covers the operating profit of travel agency for last five years from 2018 to 2022 which shows increase in operating profits year after year due to more efficient use of resources.Deliver an awe inspiring pitch with this creative Tour And Travels Agency Profile Operating Profit 2018 To 2022 Ideas PDF bundle. Topics like Operating, Profit Has Increased, Behind Improved can be discussed with this completely editable template. It is available for immediate download depending on the needs and requirements of the user.
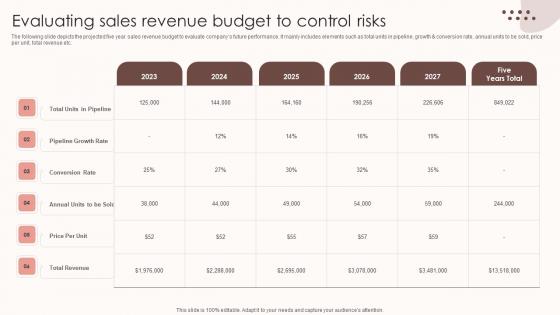
Assessing Sales Risks Evaluating Sales Revenue Budget To Control Risks Ideas PDF
The following slide depicts the projected five year sales revenue budget to evaluate companys future performance. It mainly includes elements such as total units in pipeline, growth and conversion rate, annual units to be sold, price per unit, total revenue etc. Crafting an eye-catching presentation has never been more straightforward. Let your presentation shine with this tasteful yet straightforward Assessing Sales Risks Evaluating Sales Revenue Budget To Control Risks Ideas PDF template. It offers a minimalistic and classy look that is great for making a statement. The colors have been employed intelligently to add a bit of playfulness while still remaining professional. Construct the ideal Assessing Sales Risks Evaluating Sales Revenue Budget To Control Risks Ideas PDF that effortlessly grabs the attention of your audience Begin now and be certain to wow your customers The following slide depicts the projected five year sales revenue budget to evaluate companys future performance. It mainly includes elements such as total units in pipeline, growth and conversion rate, annual units to be sold, price per unit, total revenue etc.
Adopting Flexible Work Policy Statistics Showing Continuously Rise In Flexible Icons PDF
The following slide outlines a diagrammatic representation outlining the percentage of companies switching to flexible work arrangements. It includes details of the last 5 years along with key observations. Presenting this PowerPoint presentation, titled Adopting Flexible Work Policy Statistics Showing Continuously Rise In Flexible Icons PDF, with topics curated by our researchers after extensive research. This editable presentation is available for immediate download and provides attractive features when used. Download now and captivate your audience. Presenting this Adopting Flexible Work Policy Statistics Showing Continuously Rise In Flexible Icons PDF. Our researchers have carefully researched and created these slides with all aspects taken into consideration. This is a completely customizable Adopting Flexible Work Policy Statistics Showing Continuously Rise In Flexible Icons PDF that is available for immediate downloading. Download now and make an impact on your audience. Highlight the attractive features available with our PPTs.
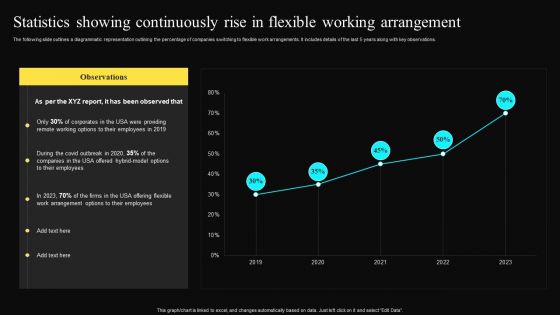
Statistics Showing Continuously Rise In Flexible Working Arrangement Background PDF
The following slide outlines a diagrammatic representation outlining the percentage of companies switching to flexible work arrangements. It includes details of the last 5 years along with key observations. This Statistics Showing Continuously Rise In Flexible Working Arrangement Background PDF from Slidegeeks makes it easy to present information on your topic with precision. It provides customization options, so you can make changes to the colors, design, graphics, or any other component to create a unique layout. It is also available for immediate download, so you can begin using it right away. Slidegeeks has done good research to ensure that you have everything you need to make your presentation stand out. Make a name out there for a brilliant performance.
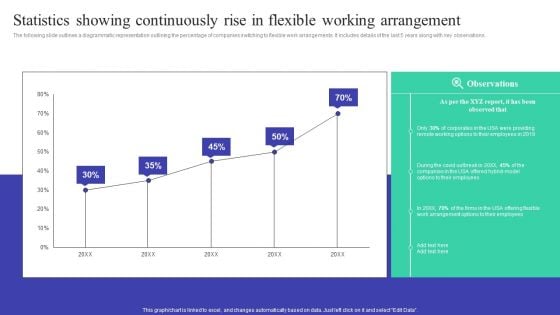
Implementing Adaptive Work Arrangements Statistics Showing Continuously Rise In Flexible Working Arrangement Information PDF
The following slide outlines a diagrammatic representation outlining the percentage of companies switching to flexible work arrangements. It includes details of the last 5 years along with key observations. This Implementing Adaptive Work Arrangements Statistics Showing Continuously Rise In Flexible Working Arrangement Information PDF from Slidegeeks makes it easy to present information on your topic with precision. It provides customization options, so you can make changes to the colors, design, graphics, or any other component to create a unique layout. It is also available for immediate download, so you can begin using it right away. Slidegeeks has done good research to ensure that you have everything you need to make your presentation stand out. Make a name out there for a brilliant performance.
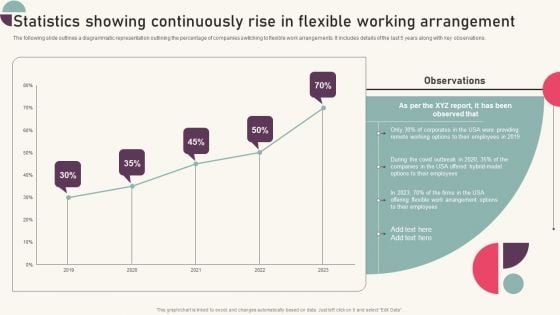
Tactics For Establishing Sustainable Hybrid Work Environment Statistics Showing Continuously Rise In Flexible Formats PDF
The following slide outlines a diagrammatic representation outlining the percentage of companies switching to flexible work arrangements. It includes details of the last 5 years along with key observations. Slidegeeks is one of the best resources for PowerPoint templates. You can download easily and regulate Tactics For Establishing Sustainable Hybrid Work Environment Statistics Showing Continuously Rise In Flexible Formats PDF for your personal presentations from our wonderful collection. A few clicks is all it takes to discover and get the most relevant and appropriate templates. Use our Templates to add a unique zing and appeal to your presentation and meetings. All the slides are easy to edit and you can use them even for advertisement purposes.
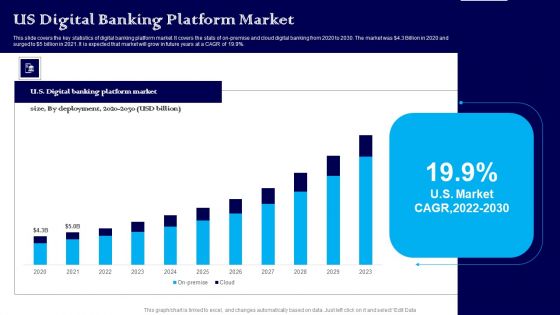
Exploring The Banking Industry A Comprehensive Analysis US Digital Banking Platform Market Brochure PDF
This slide covers the key statistics of digital banking platform market. It covers the stats of on premise and cloud digital banking from 2020 to 2030. The market was 4.3 Billion in 2020 and surged to 5 billion in 2021. It is expected that market will grow in future years at a CAGR of 19.9 percent. From laying roadmaps to briefing everything in detail, our templates are perfect for you. You can set the stage with your presentation slides. All you have to do is download these easy to edit and customizable templates. Exploring The Banking Industry A Comprehensive Analysis US Digital Banking Platform Market Brochure PDF will help you deliver an outstanding performance that everyone would remember and praise you for. Do download this presentation today.
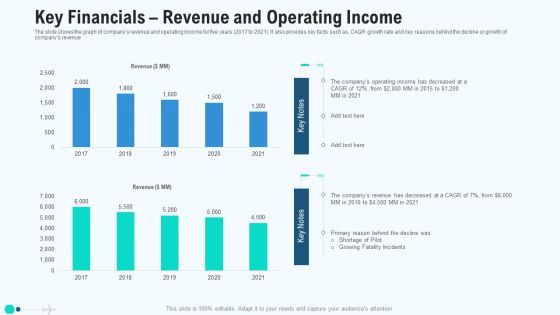
Key Financials Revenue And Operating Income Graphics PDF
The slide shows the graph of companys revenue and operating income for five years 2017 to 2021. It also provides key facts such as, CAGR growth rate and key reasons behind the decline or growth of companys revenue. Deliver an awe inspiring pitch with this creative key financials revenue and operating income graphics pdf bundle. Topics like key financials revenue and operating income can be discussed with this completely editable template. It is available for immediate download depending on the needs and requirements of the user.
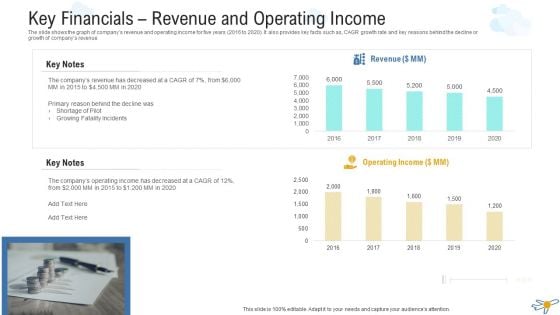
Key Financials Revenue And Operating Income Topics PDF
The slide shows the graph of companys revenue and operating income for five years 2016 to 2020. It also provides key facts such as, CAGR growth rate and key reasons behind the decline or growth of companys revenue. Deliver and pitch your topic in the best possible manner with this key financials revenue and operating income topics pdf. Use them to share invaluable insights on revenue, operating income, key notes and impress your audience. This template can be altered and modified as per your expectations. So, grab it now.
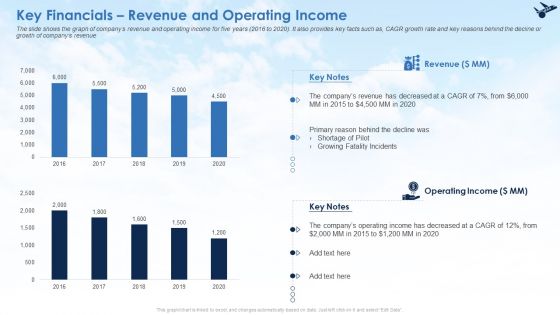
Key Financials Revenue And Operating Income Ppt Ideas Show PDF
The slide shows the graph of companys revenue and operating income for five years 2016 to 2020. It also provides key facts such as, CAGR growth rate and key reasons behind the decline or growth of companys revenue. Deliver and pitch your topic in the best possible manner with this key financials revenue and operating income ppt ideas show pdf. Use them to share invaluable insights on revenue, operating income and impress your audience. This template can be altered and modified as per your expectations. So, grab it now.
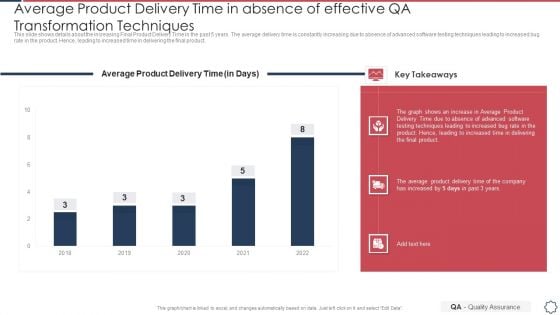
Quality Assurance Transformation Strategies To Improve Business Performance Efficiency Average Product Delivery Background PDF
This slide shows details about the increasing Final Product Delivery Time in the past 5 years. The average delivery time is constantly increasing due to absence of advanced software testing techniques leading to increased bug rate in the product. Hence, leading to increased time in delivering the final product. Deliver and pitch your topic in the best possible manner with this quality assurance transformation strategies to improve business performance efficiency average product delivery background pdf. Use them to share invaluable insights on product delivery time and impress your audience. This template can be altered and modified as per your expectations. So, grab it now.
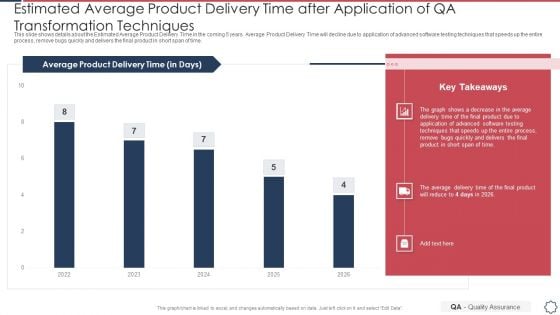
Quality Assurance Transformation Strategies To Improve Business Performance Efficiency Estimated Average Product Delivery Brochure PDF
This slide shows details about the Estimated Average Product Delivery Time in the coming 5 years. Average Product Delivery Time will decline due to application of advanced software testing techniques that speeds up the entire process, remove bugs quickly and delivers the final product in short span of time. Deliver an awe inspiring pitch with this creative quality assurance transformation strategies to improve business performance efficiency estimated average product delivery brochure pdf bundle. Topics like product delivery time can be discussed with this completely editable template. It is available for immediate download depending on the needs and requirements of the user.
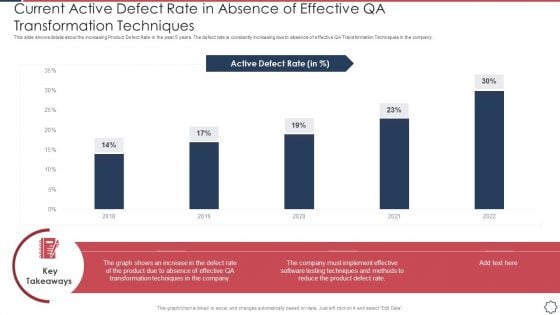
Quality Assurance Transformation Strategies To Improve Business Performance Efficiency Current Active Defect Rate Clipart PDF
This slide shows details about the increasing Product Defect Rate in the past 5 years. The defect rate is constantly increasing due to absence of effective QA Transformation Techniques in the company. Deliver an awe inspiring pitch with this creative quality assurance transformation strategies to improve business performance efficiency current active defect rate clipart pdf bundle. Topics like current active defect rate in absence of effective qa transformation techniques can be discussed with this completely editable template. It is available for immediate download depending on the needs and requirements of the user.
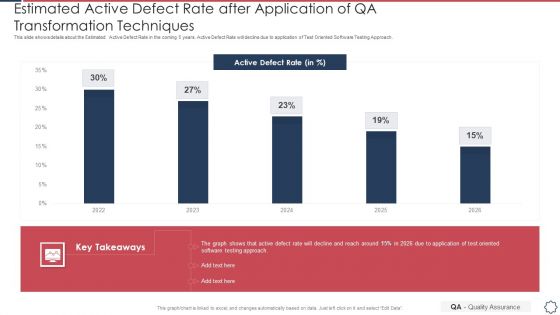
Quality Assurance Transformation Strategies To Improve Business Performance Efficiency Estimated Active Defect Rate Pictures PDF
This slide shows details about the Estimated Active Defect Rate in the coming 5 years. Active Defect Rate will decline due to application of Test Oriented Software Testing Approach. Deliver and pitch your topic in the best possible manner with this quality assurance transformation strategies to improve business performance efficiency estimated active defect rate pictures pdf. Use them to share invaluable insights on estimated active defect rate after application of qa transformation techniques and impress your audience. This template can be altered and modified as per your expectations. So, grab it now.

Successful Quality Assurance Transition Techniques To Enhance Product Quality Estimated Average Product Delivery Professional PDF
This slide shows details about the Estimated Average Product Delivery Time in the coming 5 years. Average Product Delivery Time will decline due to application of advanced software testing techniques that speeds up the entire process, remove bugs quickly and delivers the final product in short span of time. Deliver and pitch your topic in the best possible manner with this successful quality assurance transition techniques to enhance product quality estimated average product delivery professional pdf. Use them to share invaluable insights on estimated average product delivery time after application of qa transformation techniques and impress your audience. This template can be altered and modified as per your expectations. So, grab it now.
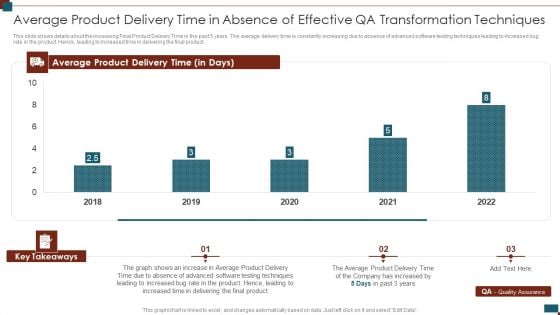
Successful Quality Assurance Transition Techniques To Enhance Product Quality Average Product Delivery Time Microsoft PDF
This slide shows details about the increasing Final Product Delivery Time in the past 5 years. The average delivery time is constantly increasing due to absence of advanced software testing techniques leading to increased bug rate in the product. Hence, leading to increased time in delivering the final product. Deliver an awe inspiring pitch with this creative successful quality assurance transition techniques to enhance product quality average product delivery time microsoft pdf bundle. Topics like average product delivery time, key takeaways can be discussed with this completely editable template. It is available for immediate download depending on the needs and requirements of the user.
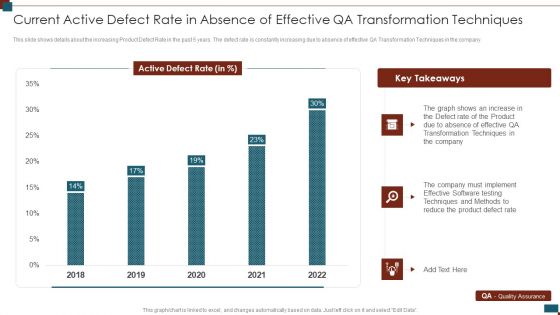
Successful Quality Assurance Transition Techniques To Enhance Product Quality Current Active Defect Rate In Absence Background PDF
This slide shows details about the increasing Product Defect Rate in the past 5 years. The defect rate is constantly increasing due to absence of effective QA Transformation Techniques in the company. Deliver an awe inspiring pitch with this creative successful quality assurance transition techniques to enhance product quality current active defect rate in absence background pdf bundle. Topics like current active defect rate in absence of effective qa transformation techniques can be discussed with this completely editable template. It is available for immediate download depending on the needs and requirements of the user.
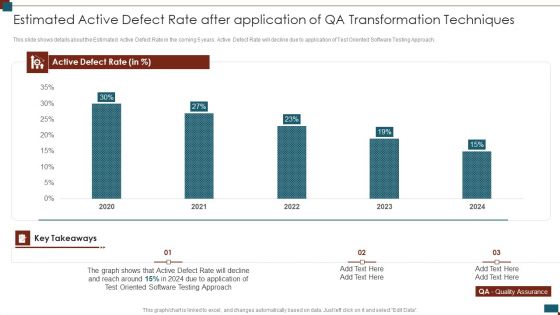
Successful Quality Assurance Transition Techniques To Enhance Product Quality Estimated Active Defect Rate After Application Information PDF
This slide shows details about the Estimated Active Defect Rate in the coming 5 years. Active Defect Rate will decline due to application of Test Oriented Software Testing Approach. Deliver an awe inspiring pitch with this creative successful quality assurance transition techniques to enhance product quality estimated active defect rate after application information pdf bundle. Topics like estimated active defect rate after application of qa transformation techniques can be discussed with this completely editable template. It is available for immediate download depending on the needs and requirements of the user.
Deploying Quality Assurance QA Transformation Average Product Delivery Time In Absence Of Effective Icons PDF
This slide shows details about the increasing Final Product Delivery Time in the past 5 years. The average delivery time is constantly increasing due to absence of advanced software testing techniques leading to increased bug rate in the product. Hence, leading to increased time in delivering the final product.Deliver an awe inspiring pitch with this creative Deploying Quality Assurance QA Transformation Average Product Delivery Time In Absence Of Effective Icons PDF bundle. Topics like Average Product Delivery Time In Absence Of Effective QA Transformation Techniques can be discussed with this completely editable template. It is available for immediate download depending on the needs and requirements of the user.
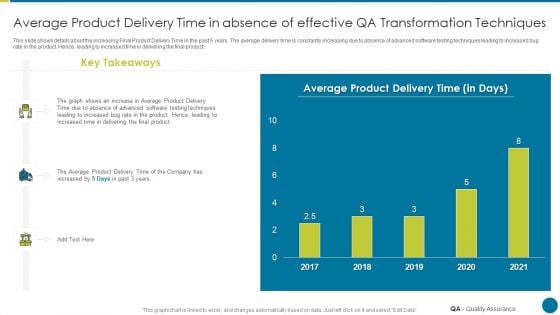
QA Modification For Product Quality Development And Consumer Satisfaction Average Product Delivery Time Template PDF
This slide shows details about the increasing Final Product Delivery Time in the past 5 years. The average delivery time is constantly increasing due to absence of advanced software testing techniques leading to increased bug rate in the product. Hence, leading to increased time in delivering the final product. Deliver an awe inspiring pitch with this creative qa modification for product quality development and consumer satisfaction average product delivery time template pdf bundle. Topics like average product delivery time in absence of effective qa transformation techniques can be discussed with this completely editable template. It is available for immediate download depending on the needs and requirements of the user.
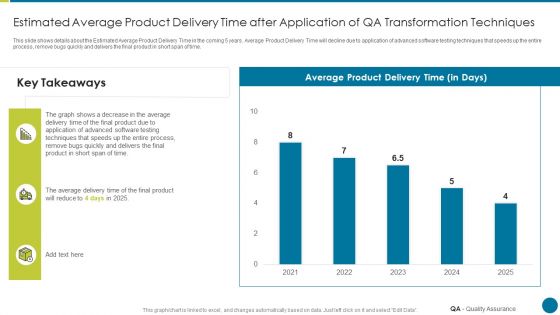
QA Modification For Product Quality Development And Consumer Satisfaction Estimated Average Product Delivery Graphics PDF
This slide shows details about the Estimated Average Product Delivery Time in the coming 5 years. Average Product Delivery Time will decline due to application of advanced software testing techniques that speeds up the entire process, remove bugs quickly and delivers the final product in short span of time. Deliver and pitch your topic in the best possible manner with this qa modification for product quality development and consumer satisfaction estimated average product delivery graphics pdf. Use them to share invaluable insights on process, techniques and impress your audience. This template can be altered and modified as per your expectations. So, grab it now.
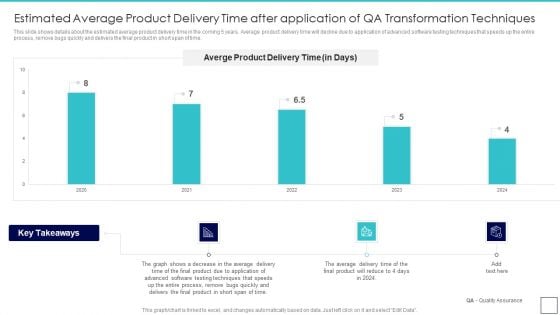
Deploying Quality Assurance QA Transformation Estimated Average Product Delivery Time After Inspiration PDF
This slide shows details about the estimated average product delivery time in the coming 5 years. Average product delivery time will decline due to application of advanced software testing techniques that speeds up the entire process, remove bugs quickly and delivers the final product in short span of time.Deliver and pitch your topic in the best possible manner with this Deploying Quality Assurance QA Transformation Estimated Average Product Delivery Time After Inspiration PDF Use them to share invaluable insights on Estimated Average Product Delivery Time After Application Of QA Transformation Techniques and impress your audience. This template can be altered and modified as per your expectations. So, grab it now.
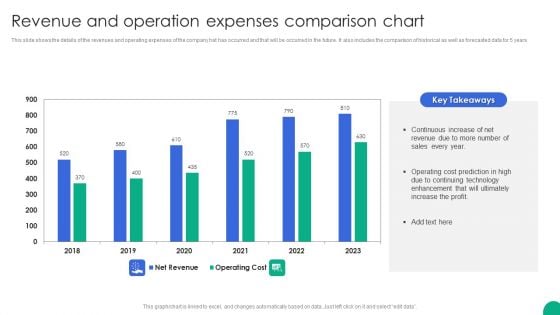
Revenue And Operation Expenses Comparison Chart Slides PDF
This slide shows the details of the revenues and operating expenses of the company hat has occurred and that will be occurred in the future. It also includes the comparison of historical as well as forecasted data for 5 years.Showcasing this set of slides titled Revenue And Operation Expenses Comparison Chart Slides PDF. The topics addressed in these templates are Continuous Increase, Operating Cost, Enhancement Ultimately. All the content presented in this PPT design is completely editable. Download it and make adjustments in color, background, font etc. as per your unique business setting.
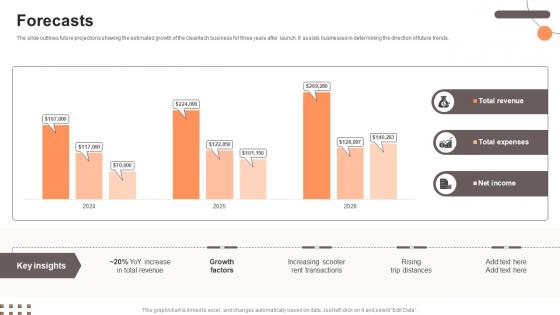
Forecasts Electric Scooter Rental Go To Market Strategy GTM SS V
The slide outlines future projections showing the estimated growth of the smart home automation business for five years after launch. It assists businesses in determining the direction of future trends.Coming up with a presentation necessitates that the majority of the effort goes into the content and the message you intend to convey. The visuals of a PowerPoint presentation can only be effective if it supplements and supports the story that is being told. Keeping this in mind our experts created Forecasts Electric Scooter Rental Go To Market Strategy GTM SS V to reduce the time that goes into designing the presentation. This way, you can concentrate on the message while our designers take care of providing you with the right template for the situation. The slide outlines future projections showing the estimated growth of the smart home automation business for five years after launch. It assists businesses in determining the direction of future trends.
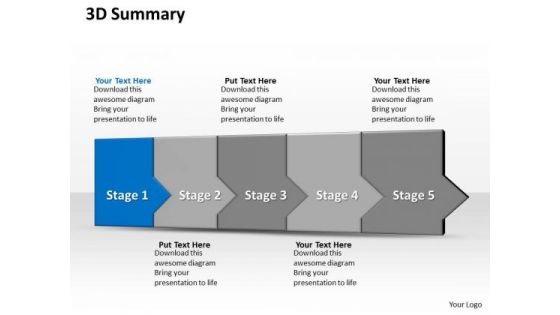
Ppt 3d Straight Description To Restrict Business Losses Five Steps PowerPoint Templates
PPT 3d straight description to restrict business losses five steps PowerPoint Templates-This diagram usually denotes Timeline process depicted as Linear arrows will be perfect for presentations on schedules, deadlines, milestones, annual reports, year planning, benchmarking, etc.-PPT 3d straight description to restrict business losses five steps PowerPoint Templates-Asset, Bank, Banking, Business, Care, Careful, Cash, Commerce, Concept, Crime, Criminal, Currency, Defend, Deposit, Economic, Economy, , Finance, , Financial, Frugal, Future, Goal, Hold, Hope, Identity, Invest, Investment, Keep, Lock, Lockdown, Loss, Market, Money, Optimism, Opulence, Opulent, Planning, Possibility, Precious, Prevention, Profit, Prosperity, Protect, Protection, Reserve, Robbery, Safe, Safety, Save, Saving, Secure, Security, Shelter, Speculate, Tax Observe growth with our Ppt 3d Straight Description To Restrict Business Losses Five Steps PowerPoint Templates. Download without worries with our money back guaranteee.
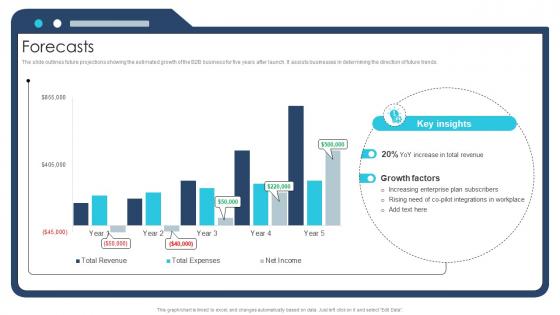
Forecasts Ai Chatbot Service Market Entry Strategy
The slide outlines future projections showing the estimated growth of the B2B business for five years after launch. It assists businesses in determining the direction of future trends.Slidegeeks is here to make your presentations a breeze with Forecasts Ai Chatbot Service Market Entry Strategy With our easy-to-use and customizable templates, you can focus on delivering your ideas rather than worrying about formatting. With a variety of designs to choose from, you are sure to find one that suits your needs. And with animations and unique photos, illustrations, and fonts, you can make your presentation pop. So whether you are giving a sales pitch or presenting to the board, make sure to check out Slidegeeks first The slide outlines future projections showing the estimated growth of the B2B business for five years after launch. It assists businesses in determining the direction of future trends.

Forecasts Coffee Bar Go To Market Strategy GTM SS V
The slide outlines future projections showing the estimated growth of the cafe business for five years after launch. It assists businesses in determining the direction of future trends.Make sure to capture your audiences attention in your business displays with our gratis customizable Forecasts Coffee Bar Go To Market Strategy GTM SS V. These are great for business strategies, office conferences, capital raising or task suggestions. If you desire to acquire more customers for your tech business and ensure they stay satisfied, create your own sales presentation with these plain slides. The slide outlines future projections showing the estimated growth of the cafe business for five years after launch. It assists businesses in determining the direction of future trends.
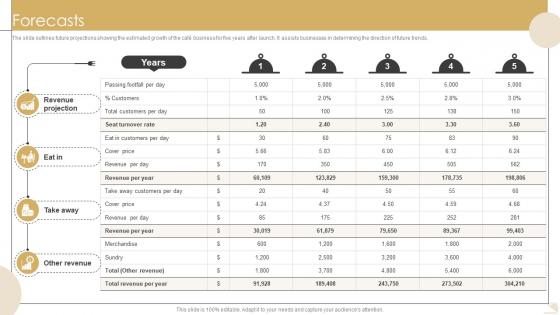
Forecasts Bistro Startup GTM Strategy GTM SS V
The slide outlines future projections showing the estimated growth of the cafe business for five years after launch. It assists businesses in determining the direction of future trends.Crafting an eye-catching presentation has never been more straightforward. Let your presentation shine with this tasteful yet straightforward Forecasts Bistro Startup GTM Strategy GTM SS V template. It offers a minimalistic and classy look that is great for making a statement. The colors have been employed intelligently to add a bit of playfulness while still remaining professional. Construct the ideal Forecasts Bistro Startup GTM Strategy GTM SS V that effortlessly grabs the attention of your audience Begin now and be certain to wow your customers The slide outlines future projections showing the estimated growth of the cafe business for five years after launch. It assists businesses in determining the direction of future trends.
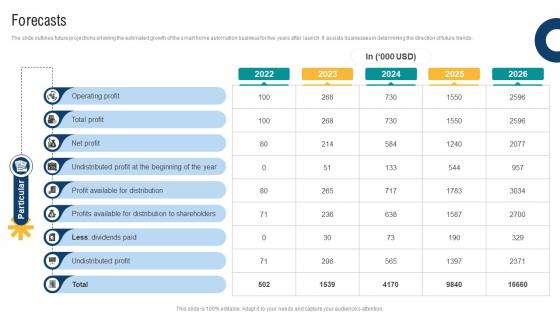
Forecasts Smart Home Startup GTM Strategy GTM SS V
The slide outlines future projections showing the estimated growth of the smart home automation business for five years after launch. It assists businesses in determining the direction of future trends.This modern and well-arranged Forecasts Smart Home Startup GTM Strategy GTM SS V provides lots of creative possibilities. It is very simple to customize and edit with the Powerpoint Software. Just drag and drop your pictures into the shapes. All facets of this template can be edited with Powerpoint, no extra software is necessary. Add your own material, put your images in the places assigned for them, adjust the colors, and then you can show your slides to the world, with an animated slide included. The slide outlines future projections showing the estimated growth of the smart home automation business for five years after launch. It assists businesses in determining the direction of future trends.
Financial Projection Investor Oriented Urbanlogiq Fundraising Deck
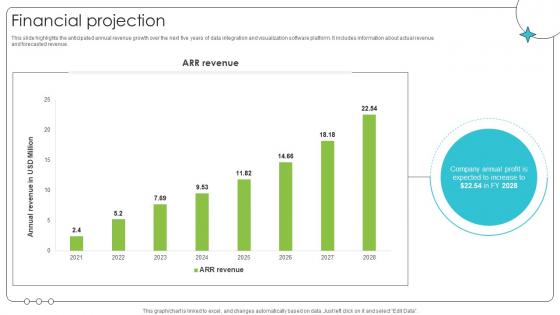
This slide highlights the anticipated annual revenue growth over the next five years of data integration and visualization software platform. It includes information about actual revenue and forecasted revenue. Slidegeeks is here to make your presentations a breeze with Financial Projection Investor Oriented Urbanlogiq Fundraising Deck With our easy-to-use and customizable templates, you can focus on delivering your ideas rather than worrying about formatting. With a variety of designs to choose from, you are sure to find one that suits your needs. And with animations and unique photos, illustrations, and fonts, you can make your presentation pop. So whether you are giving a sales pitch or presenting to the board, make sure to check out Slidegeeks first This slide highlights the anticipated annual revenue growth over the next five years of data integration and visualization software platform. It includes information about actual revenue and forecasted revenue.
Financial Forecasts Apparel And Shoes E Commerce Market PPT Slide GTM SS V
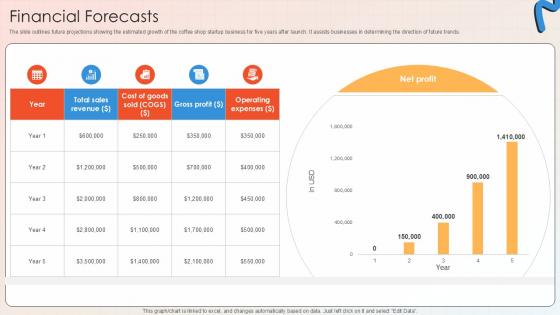
The slide outlines future projections showing the estimated growth of the coffee shop startup business for five years after launch. It assists businesses in determining the direction of future trends. Present like a pro with Financial Forecasts Apparel And Shoes E Commerce Market PPT Slide GTM SS V. Create beautiful presentations together with your team, using our easy-to-use presentation slides. Share your ideas in real-time and make changes on the fly by downloading our templates. So whether you are in the office, on the go, or in a remote location, you can stay in sync with your team and present your ideas with confidence. With Slidegeeks presentation got a whole lot easier. Grab these presentations today. The slide outlines future projections showing the estimated growth of the coffee shop startup business for five years after launch. It assists businesses in determining the direction of future trends.
Revenue By Geographical Markets Global Innovation And Business Solutions Company Profile CP SS V
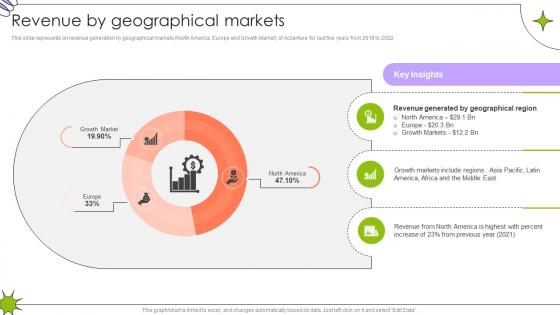
This slide represents on revenue generation by geographical markets North America, Europe and Growth Market of Accenture for last five years from 2018 to 2022.The best PPT templates are a great way to save time, energy, and resources. Slidegeeks have 100 percent editable powerpoint slides making them incredibly versatile. With these quality presentation templates, you can create a captivating and memorable presentation by combining visually appealing slides and effectively communicating your message. Download Revenue By Geographical Markets Global Innovation And Business Solutions Company Profile CP SS V from Slidegeeks and deliver a wonderful presentation. This slide represents on revenue generation by geographical markets North America, Europe and Growth Market of Accenture for last five years from 2018 to 2022.
Employee Count Engineering Solution Provider Company Profile CP SS V
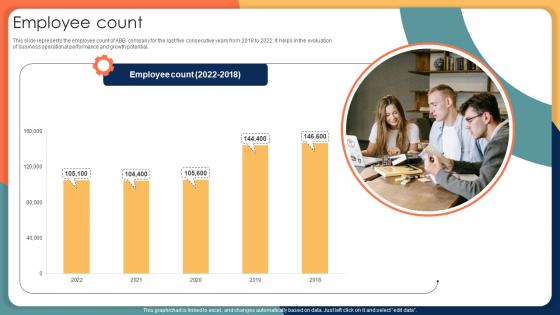
This slide represents the employee count of ABB company for the last five consecutive years from 2018 to 2022. It helps in the evaluation of business operational performance and growth potential. Find highly impressive Employee Count Engineering Solution Provider Company Profile CP SS V on Slidegeeks to deliver a meaningful presentation. You can save an ample amount of time using these presentation templates. No need to worry to prepare everything from scratch because Slidegeeks experts have already done a huge research and work for you. You need to download Employee Count Engineering Solution Provider Company Profile CP SS V for your upcoming presentation. All the presentation templates are 100 percent editable and you can change the color and personalize the content accordingly. Download now This slide represents the employee count of ABB company for the last five consecutive years from 2018 to 2022. It helps in the evaluation of business operational performance and growth potential.
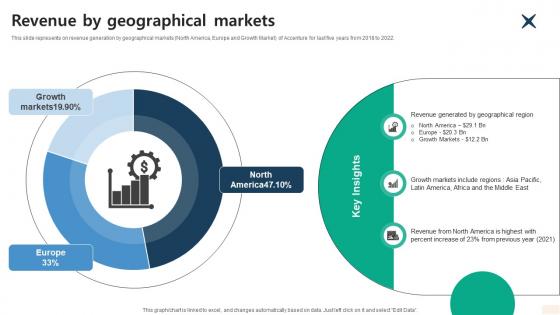
Revenue By Geographical Markets Global Consulting And Technology Services Company Profile CP SS V
This slide represents on revenue generation by geographical markets North America, Europe and Growth Market of Accenture for last five years from 2018 to 2022.The best PPT templates are a great way to save time, energy, and resources. Slidegeeks have 100 percent editable powerpoint slides making them incredibly versatile. With these quality presentation templates, you can create a captivating and memorable presentation by combining visually appealing slides and effectively communicating your message. Download Revenue By Geographical Markets Global Consulting And Technology Services Company Profile CP SS V from Slidegeeks and deliver a wonderful presentation. This slide represents on revenue generation by geographical markets North America, Europe and Growth Market of Accenture for last five years from 2018 to 2022.
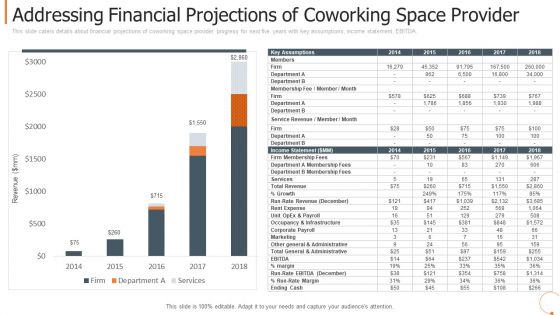
Addressing Financial Projections Of Coworking Space Provider Formats PDF
This slide caters details about financial projections of coworking space provider progress for next five years with key assumptions, income statement, EBITDA. Deliver and pitch your topic in the best possible manner with this addressing financial projections of coworking space provider formats pdf. Use them to share invaluable insights on services, total revenue, rate margin, growth and impress your audience. This template can be altered and modified as per your expectations. So, grab it now.
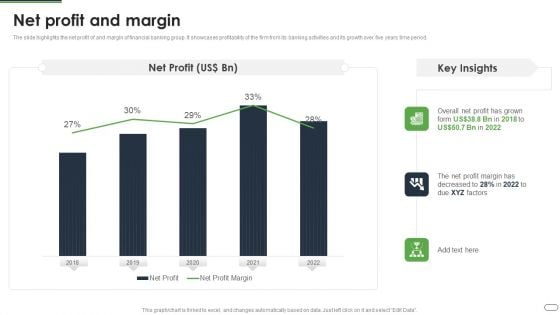
Financial Solutions Company Profile Net Profit And Margin Professional PDF
The slide highlights the net profit of and margin of financial banking group. It showcases profitability of the firm from its banking activities and its growth over five years time period.Deliver an awe inspiring pitch with this creative Financial Solutions Company Profile Net Profit And Margin Professional PDF bundle. Topics like Net Profit, Margin can be discussed with this completely editable template. It is available for immediate download depending on the needs and requirements of the user.
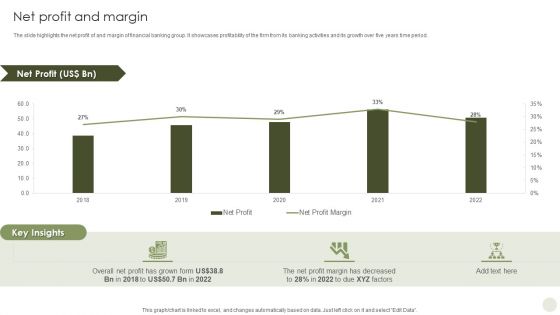
Commercial Bank Financial Services Company Profile Net Profit And Margin Summary PDF
The slide highlights the net profit of and margin of financial banking group. It showcases profitability of the firm from its banking activities and its growth over five years time period. Deliver an awe inspiring pitch with this creative Commercial Bank Financial Services Company Profile Net Profit And Margin Summary PDF bundle. Topics like Net Profit, Margin can be discussed with this completely editable template. It is available for immediate download depending on the needs and requirements of the user.

Canned Food Company Profile Historical Revenue 2018 To 2022 Mockup PDF
The slide shows annual revenue growth of the company with the CAGR for last five financial years from 2018 to 2022 along with key insights.Deliver and pitch your topic in the best possible manner with this Canned Food Company Profile Historical Revenue 2018 To 2022 Mockup PDF Use them to share invaluable insights on Annual Revenue, Revenue Quantum, Company Observed and impress your audience. This template can be altered and modified as per your expectations. So, grab it now.

Financial Solutions Company Profile Historical Revenue 2018 To 2022 Information PDF
The slide shows annual revenue growth of the company with the CAGR for last five financial years from 2018 to 2022 along with key insights.Deliver and pitch your topic in the best possible manner with this Financial Solutions Company Profile Historical Revenue 2018 To 2022 Information PDF Use them to share invaluable insights on Historical Revenue and impress your audience. This template can be altered and modified as per your expectations. So, grab it now.
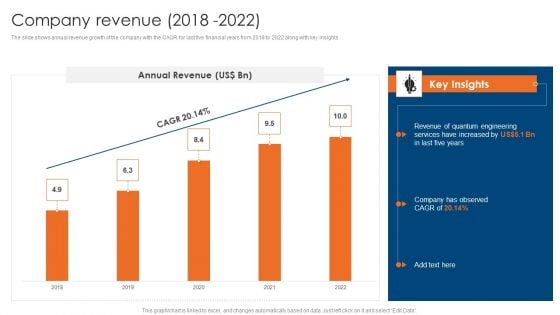
Engineering Consultancy Works Company Profile Company Revenue 2018 To 2022 Clipart PDF
The slide shows annual revenue growth of the company with the CAGR for last five financial years from 2018 to 2022 along with key insights. Deliver and pitch your topic in the best possible manner with this Engineering Consultancy Works Company Profile Company Revenue 2018 To 2022 Clipart PDF. Use them to share invaluable insights on Company, Revenue, Annual and impress your audience. This template can be altered and modified as per your expectations. So, grab it now.
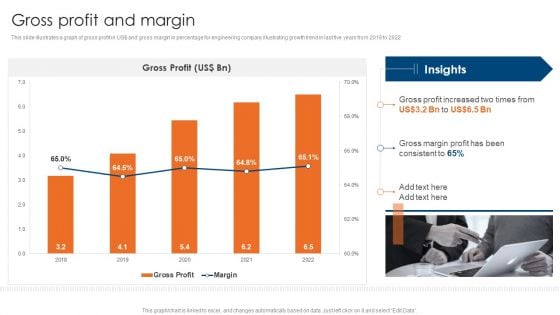
Engineering Consultancy Works Company Profile Gross Profit And Margin Infographics PDF
This slide illustrates a graph of gross profit in US doller and gross margin in percentage for engineering company illustrating growth trend in last five years from 2018 to 2022. Deliver an awe inspiring pitch with this creative Engineering Consultancy Works Company Profile Gross Profit And Margin Infographics PDF bundle. Topics like Gross Profit, Margin can be discussed with this completely editable template. It is available for immediate download depending on the needs and requirements of the user.
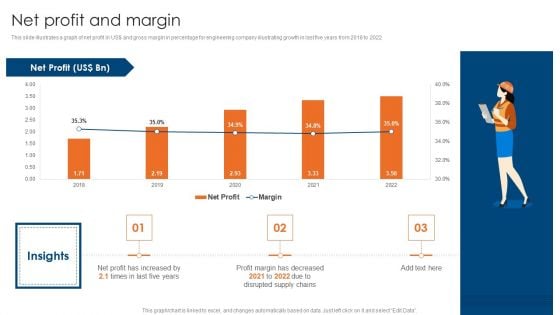
Engineering Consultancy Works Company Profile Net Profit And Margin Clipart PDF
This slide illustrates a graph of net profit in US doller and gross margin in percentage for engineering company illustrating growth in last five years from 2018 to 2022. Deliver an awe inspiring pitch with this creative Engineering Consultancy Works Company Profile Net Profit And Margin Clipart PDF bundle. Topics like Net Profit And Margin can be discussed with this completely editable template. It is available for immediate download depending on the needs and requirements of the user.

Instant Snacks And Food Firm Details Historical Revenue 2018 To 2022 Microsoft PDF
The slide shows annual revenue growth of the company with the CAGR for last five financial years from 2018 to 2022 along with key insights.Deliver and pitch your topic in the best possible manner with this Instant Snacks And Food Firm Details Historical Revenue 2018 To 2022 Microsoft PDF Use them to share invaluable insights on Historical Revenue and impress your audience. This template can be altered and modified as per your expectations. So, grab it now.


 Continue with Email

 Home
Home


