5 Year Growth Plan
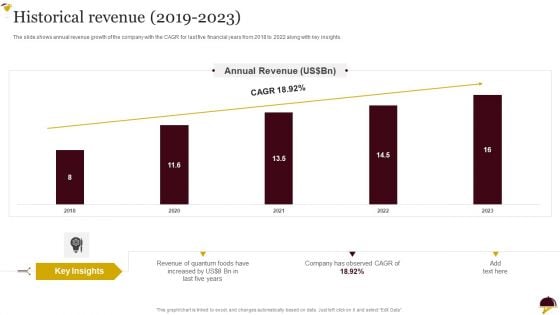
Food Company Overview Historical Revenue 2019 To 2023 Professional PDF
The slide shows annual revenue growth of the company with the CAGR for last five financial years from 2018 to 2022 along with key insights.Deliver and pitch your topic in the best possible manner with this Food Company Overview Historical Revenue 2019 To 2023 Professional PDF. Use them to share invaluable insights on Revenue Of Quantum, Annual Revenue, Key Insights and impress your audience. This template can be altered and modified as per your expectations. So, grab it now.

Banking Solutions Company Overview Historical Revenue 2018 To 2022 Themes PDF
The slide shows annual revenue growth of the company with the CAGR for last five financial years from 2018 to 2022 along with key insights. Deliver an awe inspiring pitch with this creative Banking Solutions Company Overview Historical Revenue 2018 To 2022 Themes PDF bundle. Topics like Company Total Revenue, Key Insights can be discussed with this completely editable template. It is available for immediate download depending on the needs and requirements of the user.

Packaged Food Firm Description Historical Revenue 2018 TO 2022 Themes PDF
The slide shows annual revenue growth of the company with the CAGR for last five financial years from 2018 to 2022 along with key insights.Deliver an awe inspiring pitch with this creative Packaged Food Firm Description Historical Revenue 2018 TO 2022 Themes PDF bundle. Topics like Revenue Of Quantum, Key Insights, Company Observed can be discussed with this completely editable template. It is available for immediate download depending on the needs and requirements of the user.
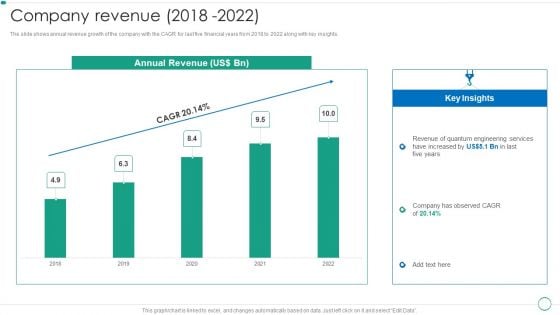
Real Estate Construction And Engineering Company Profile Company Revenue 2018 TO 2022 Pictures PDF
The slide shows annual revenue growth of the company with the CAGR for last five financial years from 2018 to 2022 along with key insights.Deliver and pitch your topic in the best possible manner with this Real Estate Construction And Engineering Company Profile Company Revenue 2018 TO 2022 Pictures PDF. Use them to share invaluable insights on Annual Revenue, Key Insights, Revenue Of Quantum and impress your audience. This template can be altered and modified as per your expectations. So, grab it now.
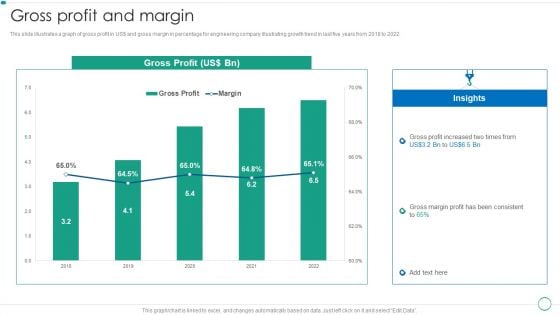
Real Estate Construction And Engineering Company Profile Gross Profit And Margin Demonstration PDF
This slide illustrates a graph of gross profit in US and gross margin in percentage for engineering company illustrating growth trend in last five years from 2018 to 2022.Deliver an awe inspiring pitch with this creative Real Estate Construction And Engineering Company Profile Gross Profit And Margin Demonstration PDF bundle. Topics like Gross Profit, Insights, Profit Increased can be discussed with this completely editable template. It is available for immediate download depending on the needs and requirements of the user.
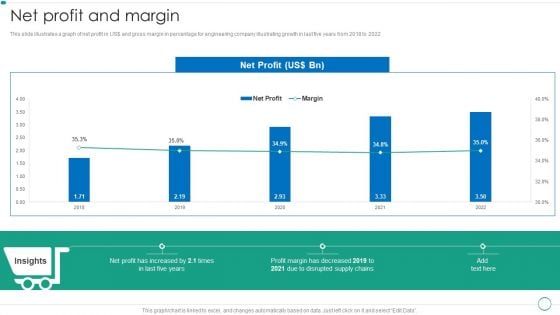
Real Estate Construction And Engineering Company Profile Net Profit And Margin Diagrams PDF
This slide illustrates a graph of net profit in US and gross margin in percentage for engineering company illustrating growth in last five years from 2018 to 2022.Deliver an awe inspiring pitch with this creative Real Estate Construction And Engineering Company Profile Net Profit And Margin Diagrams PDF bundle. Topics like Disrupted Supply, Profit Margin, Increased can be discussed with this completely editable template. It is available for immediate download depending on the needs and requirements of the user.
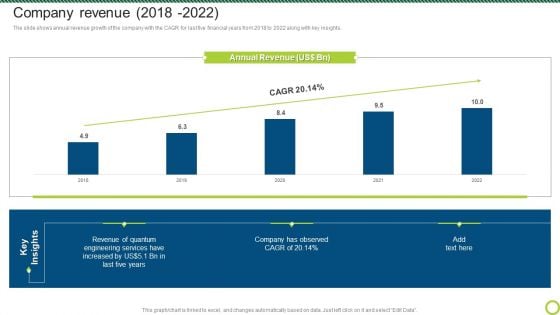
Engineering Solutions Company Detail Company Revenue 2018 To 2022 Information PDF
The slide shows annual revenue growth of the company with the CAGR for last five financial years from 2018 to 2022 along with key insights.Deliver and pitch your topic in the best possible manner with this Engineering Solutions Company Detail Company Revenue 2018 To 2022 Information PDF. Use them to share invaluable insights on Revenue Of Quantum, Engineering Services, Company Observed and impress your audience. This template can be altered and modified as per your expectations. So, grab it now.
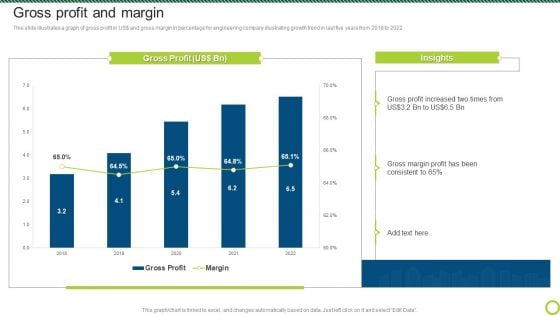
Engineering Solutions Company Detail Gross Profit And Margin Topics PDF
This slide illustrates a graph of gross profit in US and gross margin in percentage for engineering company illustrating growth trend in last five years from 2018 to 2022.Deliver and pitch your topic in the best possible manner with this Engineering Solutions Company Detail Gross Profit And Margin Topics PDF. Use them to share invaluable insights on Profit Increased, Gross Margin, Gross Profit and impress your audience. This template can be altered and modified as per your expectations. So, grab it now.
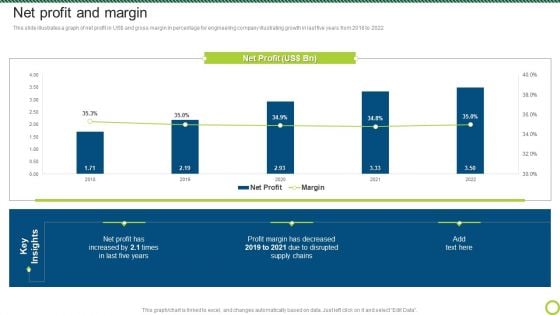
Engineering Solutions Company Detail Net Profit And Margin Graphics PDF
This slide illustrates a graph of net profit in US and gross margin in percentage for engineering company illustrating growth in last five years from 2018 to 2022.Deliver and pitch your topic in the best possible manner with this Engineering Solutions Company Detail Net Profit And Margin Graphics PDF. Use them to share invaluable insights on Margin Has Decreased, Due To Disrupted, Supply Chains and impress your audience. This template can be altered and modified as per your expectations. So, grab it now.
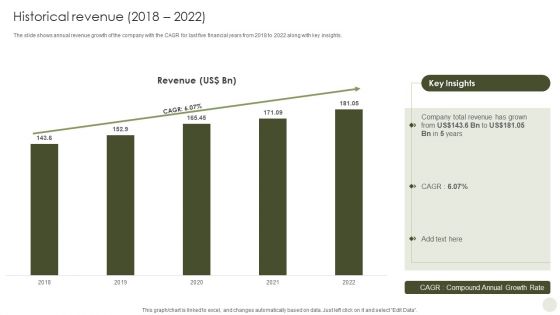
Commercial Bank Financial Services Company Profile Historical Revenue 2018 To 2022 Infographics PDF
The slide shows annual revenue growth of the company with the CAGR for last five financial years from 2018 to 2022 along with key insights. Deliver and pitch your topic in the best possible manner with this Commercial Bank Financial Services Company Profile Historical Revenue 2018 To 2022 Infographics PDF. Use them to share invaluable insights on Historical Revenue and impress your audience. This template can be altered and modified as per your expectations. So, grab it now.
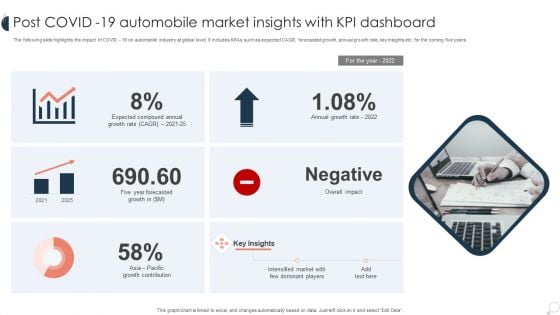
Post COVID 19 Automobile Market Insights With KPI Dashboard Ppt PowerPoint Presentation Slides Background Images PDF
The following slide highlights the impact of COVID 19 on automobile industry at global level. It includes KPAs such as expected CAGR, forecasted growth, annual growth rate, key insights etc. for the coming five years. Showcasing this set of slides titled Post COVID 19 Automobile Market Insights With KPI Dashboard Ppt PowerPoint Presentation Slides Background Images PDF. The topics addressed in these templates are Expected Compound, Annual Growth, Overall Impact. All the content presented in this PPT design is completely editable. Download it and make adjustments in color, background, font etc. as per your unique business setting.
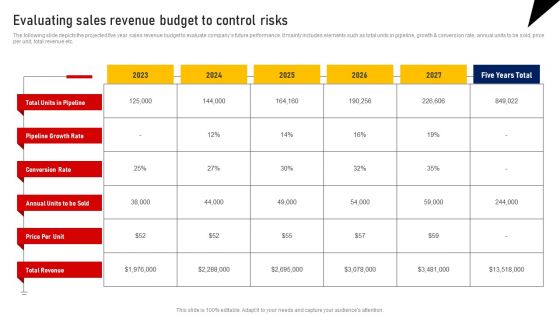
Performing Sales Risk Analysis Procedure Evaluating Sales Revenue Budget To Control Risks Guidelines PDF
The following slide depicts the projected five year sales revenue budget to evaluate companys future performance. It mainly includes elements such as total units in pipeline, growth and conversion rate, annual units to be sold, price per unit, total revenue etc. Formulating a presentation can take up a lot of effort and time, so the content and message should always be the primary focus. The visuals of the PowerPoint can enhance the presenters message, so our Performing Sales Risk Analysis Procedure Evaluating Sales Revenue Budget To Control Risks Guidelines PDF was created to help save time. Instead of worrying about the design, the presenter can concentrate on the message while our designers work on creating the ideal templates for whatever situation is needed. Slidegeeks has experts for everything from amazing designs to valuable content, we have put everything into Performing Sales Risk Analysis Procedure Evaluating Sales Revenue Budget To Control Risks Guidelines PDF
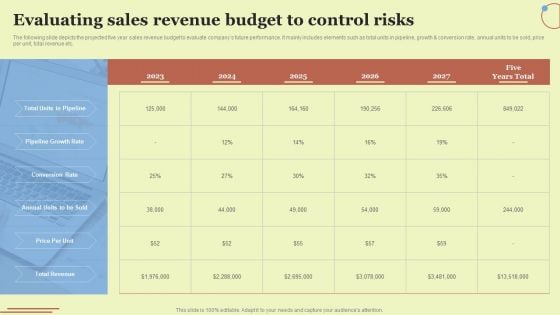
Evaluating Sales Revenue Budget To Control Risks Ideas PDF
The following slide depicts the projected five year sales revenue budget to evaluate companys future performance. It mainly includes elements such as total units in pipeline, growth and conversion rate, annual units to be sold, price per unit, total revenue etc. Formulating a presentation can take up a lot of effort and time, so the content and message should always be the primary focus. The visuals of the PowerPoint can enhance the presenters message, so our Evaluating Sales Revenue Budget To Control Risks Ideas PDF was created to help save time. Instead of worrying about the design, the presenter can concentrate on the message while our designers work on creating the ideal templates for whatever situation is needed. Slidegeeks has experts for everything from amazing designs to valuable content, we have put everything into Evaluating Sales Revenue Budget To Control Risks Ideas PDF.
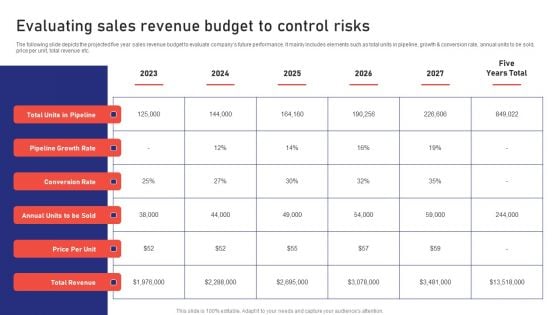
Sales Risk Assessment For Profit Maximization Evaluating Sales Revenue Budget To Control Risks Inspiration PDF
The following slide depicts the projected five year sales revenue budget to evaluate companys future performance. It mainly includes elements such as total units in pipeline, growth and conversion rate, annual units to be sold, price per unit, total revenue etc. Take your projects to the next level with our ultimate collection of Sales Risk Assessment For Profit Maximization Evaluating Sales Revenue Budget To Control Risks Inspiration PDF. Slidegeeks has designed a range of layouts that are perfect for representing task or activity duration, keeping track of all your deadlines at a glance. Tailor these designs to your exact needs and give them a truly corporate look with your own brand colors they will make your projects stand out from the rest.

Key Financial Chart Digital Marketings Strategies PPT PowerPoint CP SS V
This slide showcases the sales of Aerospace company. It includes sales growth and net income growth of five years. Sales growth measures the ability of sales team to increase revenue over a fixed period of time. Coming up with a presentation necessitates that the majority of the effort goes into the content and the message you intend to convey. The visuals of a PowerPoint presentation can only be effective if it supplements and supports the story that is being told. Keeping this in mind our experts created Key Financial Chart Digital Marketings Strategies PPT PowerPoint CP SS V to reduce the time that goes into designing the presentation. This way, you can concentrate on the message while our designers take care of providing you with the right template for the situation. This slide showcases the sales of Aerospace company. It includes sales growth and net income growth of five years. Sales growth measures the ability of sales team to increase revenue over a fixed period of time.
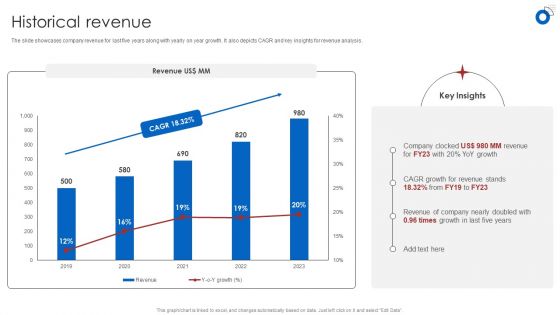
Insurance Business Financial Analysis Historical Revenue Ppt Styles Graphics PDF
The slide showcases company revenue for last five years along with yearly on year growth. It also depicts CAGR and key insights for revenue analysis. Crafting an eye-catching presentation has never been more straightforward. Let your presentation shine with this tasteful yet straightforward Insurance Business Financial Analysis Historical Revenue Ppt Styles Graphics PDF template. It offers a minimalistic and classy look that is great for making a statement. The colors have been employed intelligently to add a bit of playfulness while still remaining professional. Construct the ideal Insurance Business Financial Analysis Historical Revenue Ppt Styles Graphics PDF that effortlessly grabs the attention of your audience Begin now and be certain to wow your customers.
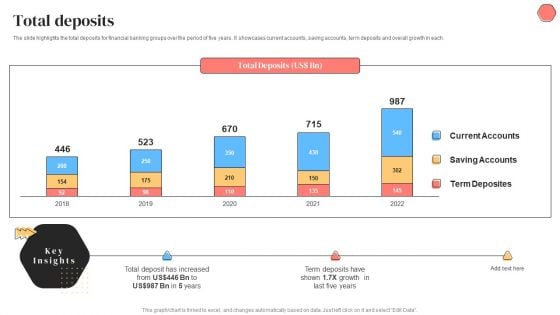
Banking Solutions Company Overview Total Deposits Inspiration PDF
The slide highlights the total deposits for financial banking groups over the period of five years. It showcases current accounts, saving accounts, term deposits and overall growth in each. Deliver and pitch your topic in the best possible manner with this Banking Solutions Company Overview Total Deposits Inspiration PDF. Use them to share invaluable insights on Growth, Term Deposits and impress your audience. This template can be altered and modified as per your expectations. So, grab it now.
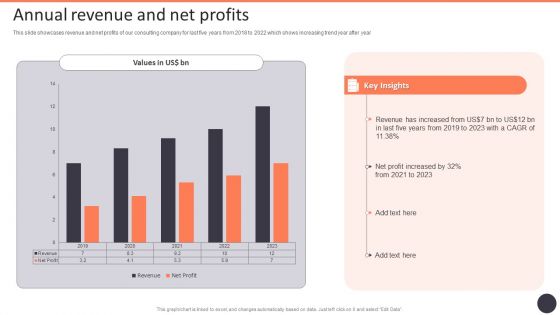
Business Strategy Consulting Solutions Company Outline Annual Revenue And Net Profits Clipart PDF
This slide showcases revenue and net profits of our consulting company for last five years from 2018 to 2022 which shows increasing trend year after year. Presenting this PowerPoint presentation, titled Business Strategy Consulting Solutions Company Outline Annual Revenue And Net Profits Clipart PDF with topics curated by our researchers after extensive research. This editable presentation is available for immediate download and provides attractive features when used. Download now and captivate your audience. Presenting this Business Strategy Consulting Solutions Company Outline Annual Revenue And Net Profits Clipart PDF. Our researchers have carefully researched and created these slides with all aspects taken into consideration. This is a completely customizable Business Strategy Consulting Solutions Company Outline Annual Revenue And Net Profits Clipart PDF that is available for immediate downloading. Download now and make an impact on your audience. Highlight the attractive features available with our PPTs.
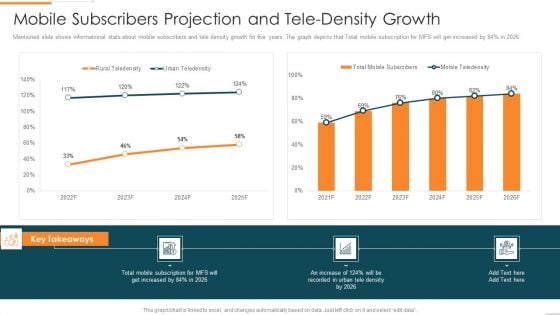
Enhanced Customer Banking Experience With Mobile Mobile Subscribers Projection Infographics PDF
Mentioned slide shows informational stats about mobile subscribers and tele density growth for five years. The graph depicts that Total mobile subscription for MFS will get increased by 84percent in 2026.Deliver an awe inspiring pitch with this creative Enhanced Customer Banking Experience With Mobile Mobile Subscribers Projection Infographics PDF bundle. Topics like Mobile Subscribers Projection And Tele-Density Growth can be discussed with this completely editable template. It is available for immediate download depending on the needs and requirements of the user.
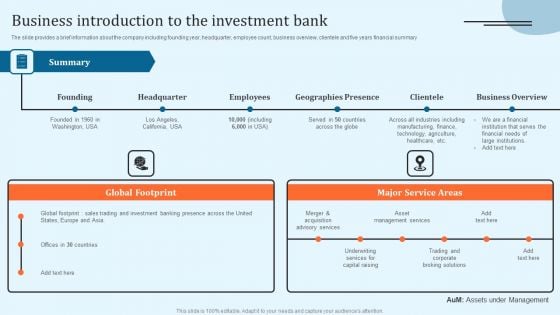
Equity Debt And Convertible Bond Investment Banking Pitch Book Business Introduction To The Investment Bank Ideas PDF
The slide provides a brief information about the company including founding year, headquarter, employee count, business overview, clientele and five years financial summary. If you are looking for a format to display your unique thoughts, then the professionally designed Equity Debt And Convertible Bond Investment Banking Pitch Book Business Introduction To The Investment Bank Ideas PDF is the one for you. You can use it as a Google Slides template or a PowerPoint template. Incorporate impressive visuals, symbols, images, and other charts. Modify or reorganize the text boxes as you desire. Experiment with shade schemes and font pairings. Alter, share or cooperate with other people on your work. Download Equity Debt And Convertible Bond Investment Banking Pitch Book Business Introduction To The Investment Bank Ideas PDF and find out how to give a successful presentation. Present a perfect display to your team and make your presentation unforgettable.
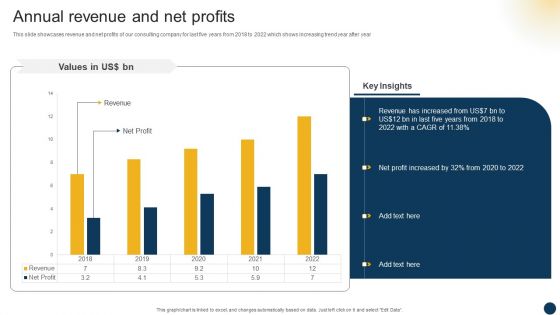
Organizational Advisory Solutions Business Profile Annual Revenue And Net Profits Background PDF
This slide showcases revenue and net profits of our consulting company for last five years from 2018 to 2022 which shows increasing trend year after year. Presenting this PowerPoint presentation, titled Organizational Advisory Solutions Business Profile Annual Revenue And Net Profits Background PDF with topics curated by our researchers after extensive research. This editable Organizational Advisory Solutions Business Profile Annual Revenue And Net Profits Background PDF is available for immediate download and provides attractive features when used. Download now and captivate your audience. Presenting this Organizational Advisory Solutions Business Profile Annual Revenue And Net Profits Background PDF. Our researchers have carefully researched and created these slides with all aspects taken into consideration. This is a completely customizable Organizational Advisory Solutions Business Profile Annual Revenue And Net Profits Background PDF that is available for immediate downloading. Download now and make an impact on your audience. Highlight the attractive features available with our PPTs.
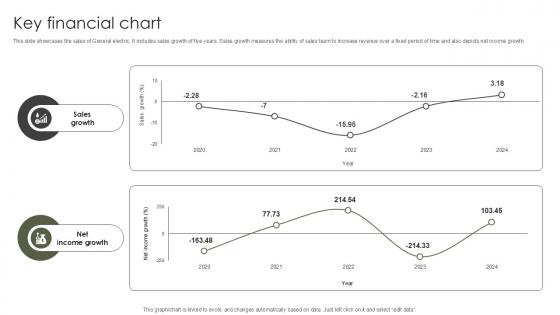
Key Financial Chart Military Aircraft Engine Manufacturing PPT Presentation CP SS V
This slide showcases the sales of General electric. It includes sales growth of five years. Sales growth measures the ability of sales team to increase revenue over a fixed period of time and also depicts net income growth. Explore a selection of the finest Key Financial Chart Military Aircraft Engine Manufacturing PPT Presentation CP SS V here. With a plethora of professionally designed and pre-made slide templates, you can quickly and easily find the right one for your upcoming presentation. You can use our Key Financial Chart Military Aircraft Engine Manufacturing PPT Presentation CP SS V to effectively convey your message to a wider audience. Slidegeeks has done a lot of research before preparing these presentation templates. The content can be personalized and the slides are highly editable. Grab templates today from Slidegeeks. This slide showcases the sales of General electric. It includes sales growth of five years. Sales growth measures the ability of sales team to increase revenue over a fixed period of time and also depicts net income growth.
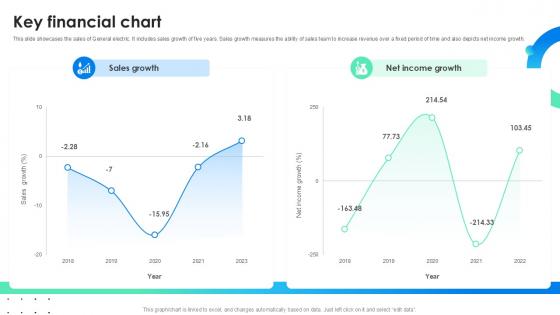
Key Financial Chart Global Energy Company Profile PPT Example CP SS V
This slide showcases the sales of General electric. It includes sales growth of five years. Sales growth measures the ability of sales team to increase revenue over a fixed period of time and also depicts net income growth. Explore a selection of the finest Key Financial Chart Global Energy Company Profile PPT Example CP SS V here. With a plethora of professionally designed and pre-made slide templates, you can quickly and easily find the right one for your upcoming presentation. You can use our Key Financial Chart Global Energy Company Profile PPT Example CP SS V to effectively convey your message to a wider audience. Slidegeeks has done a lot of research before preparing these presentation templates. The content can be personalized and the slides are highly editable. Grab templates today from Slidegeeks. This slide showcases the sales of General electric. It includes sales growth of five years. Sales growth measures the ability of sales team to increase revenue over a fixed period of time and also depicts net income growth.
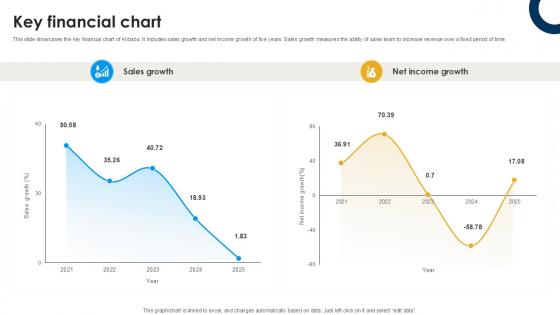
Key Financial Chart International Trade Of Products And Services PPT Template CP SS V
This slide showcases the key financial chart of Alibaba. It includes sales growth and net income growth of five years. Sales growth measures the ability of sales team to increase revenue over a fixed period of time. This modern and well-arranged Key Financial Chart International Trade Of Products And Services PPT Template CP SS V provides lots of creative possibilities. It is very simple to customize and edit with the Powerpoint Software. Just drag and drop your pictures into the shapes. All facets of this template can be edited with Powerpoint, no extra software is necessary. Add your own material, put your images in the places assigned for them, adjust the colors, and then you can show your slides to the world, with an animated slide included. This slide showcases the key financial chart of Alibaba. It includes sales growth and net income growth of five years. Sales growth measures the ability of sales team to increase revenue over a fixed period of time.

Web Interface Development Services Company Summary Operating Profits From 2019 To 2023 Microsoft PDF
This slide covers the operating profit of web design company for last five years from 2019 to 2023 which shows changes in operating profits year after year. Formulating a presentation can take up a lot of effort and time, so the content and message should always be the primary focus. The visuals of the PowerPoint can enhance the presenters message, so our Web Interface Development Services Company Summary Operating Profits From 2019 To 2023 Microsoft PDF was created to help save time. Instead of worrying about the design, the presenter can concentrate on the message while our designers work on creating the ideal templates for whatever situation is needed. Slidegeeks has experts for everything from amazing designs to valuable content, we have put everything into Web Interface Development Services Company Summary Operating Profits From 2019 To 2023 Microsoft PDF.
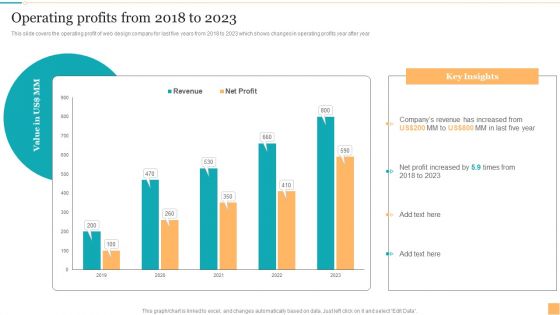
Website Design And Branding Studio Company Profile Operating Profits From 2018 To 2023 Graphics PDF
This slide covers the operating profit of web design company for last five years from 2018 to 2023 which shows changes in operating profits year after year. Formulating a presentation can take up a lot of effort and time, so the content and message should always be the primary focus. The visuals of the PowerPoint can enhance the presenters message, so our Website Design And Branding Studio Company Profile Operating Profits From 2018 To 2023 Graphics PDF was created to help save time. Instead of worrying about the design, the presenter can concentrate on the message while our designers work on creating the ideal templates for whatever situation is needed. Slidegeeks has experts for everything from amazing designs to valuable content, we have put everything into Website Design And Branding Studio Company Profile Operating Profits From 2018 To 2023 Graphics PDF.
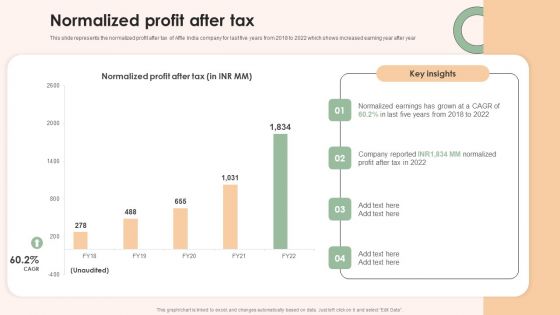
Online Advertising Firm Business Profile Normalized Profit After Tax Microsoft PDF
This slide represents the normalized profit after tax of Affle India company for last five years from 2018 to 2022 which shows increased earning year after year Formulating a presentation can take up a lot of effort and time, so the content and message should always be the primary focus. The visuals of the PowerPoint can enhance the presenters message, so our Online Advertising Firm Business Profile Normalized Profit After Tax Microsoft PDF was created to help save time. Instead of worrying about the design, the presenter can concentrate on the message while our designers work on creating the ideal templates for whatever situation is needed. Slidegeeks has experts for everything from amazing designs to valuable content, we have put everything into Online Advertising Firm Business Profile Normalized Profit After Tax Microsoft PDF
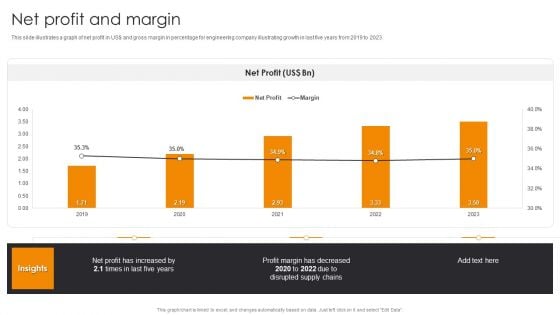
Net Profit And Margin Engineering Company Financial Analysis Report Background PDF
This slide illustrates a graph of net profit in US dollar and gross margin in percentage for engineering company illustrating growth in last five years from 2019 to 2023.Slidegeeks has constructed Net Profit And Margin Engineering Company Financial Analysis Report Background PDF after conducting extensive research and examination. These presentation templates are constantly being generated and modified based on user preferences and critiques from editors. Here, you will find the most attractive templates for a range of purposes while taking into account ratings and remarks from users regarding the content. This is an excellent jumping-off point to explore our content and will give new users an insight into our top-notch PowerPoint Templates.
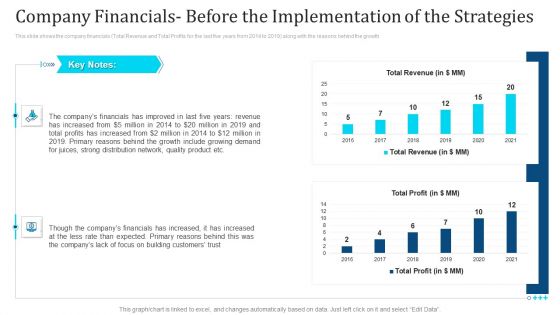
Company Financials Before The Implementation Of The Strategies Ppt Summary Visual Aids PDF
This slide shows the company financials Total Revenue and Total Profits for the last five years from 2014 to 2019 along with the reasons behind the growth Deliver and pitch your topic in the best possible manner with this company financials before the implementation of the strategies ppt summary visual aids pdf. Use them to share invaluable insights on company financials before the implementation of the strategies and impress your audience. This template can be altered and modified as per your expectations. So, grab it now.
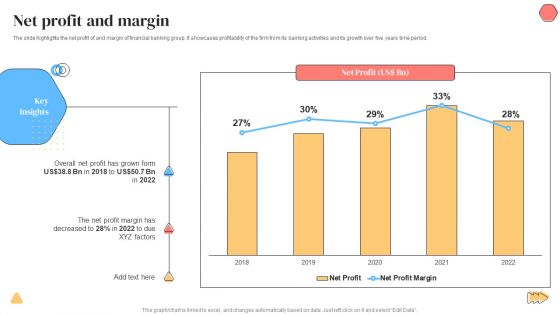
Banking Solutions Company Overview Net Profit And Margin Topics PDF
The slide highlights the net profit of and margin of financial banking group. It showcases profitability of the firm from its banking activities and its growth over five years time period. Deliver and pitch your topic in the best possible manner with this Banking Solutions Company Overview Net Profit And Margin Topics PDF. Use them to share invaluable insights on Overall Net Profit, Net Profit Margin and impress your audience. This template can be altered and modified as per your expectations. So, grab it now.
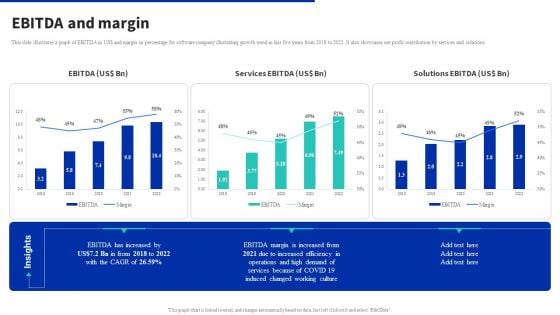
Digital Products Company Outline Ebitda And Margin Inspiration PDF
This slide illustrates a graph of EBITDA in US dollar and margin in percentage for software company illustrating growth trend in last five years from 2018 to 2022. It also showcases net profit contribution by services and solutions. Take your projects to the next level with our ultimate collection of Digital Products Company Outline Ebitda And Margin Inspiration PDF. Slidegeeks has designed a range of layouts that are perfect for representing task or activity duration, keeping track of all your deadlines at a glance. Tailor these designs to your exact needs and give them a truly corporate look with your own brand colors they will make your projects stand out from the rest.
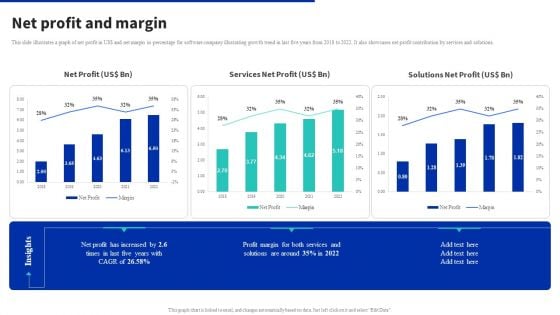
Digital Products Company Outline Net Profit And Margin Summary PDF
This slide illustrates a graph of net profit in US dollar and net margin in percentage for software company illustrating growth trend in last five years from 2018 to 2022. It also showcases net profit contribution by services and solutions. From laying roadmaps to briefing everything in detail, our templates are perfect for you. You can set the stage with your presentation slides. All you have to do is download these easy to edit and customizable templates. Digital Products Company Outline Net Profit And Margin Summary PDF will help you deliver an outstanding performance that everyone would remember and praise you for. Do download this presentation today.
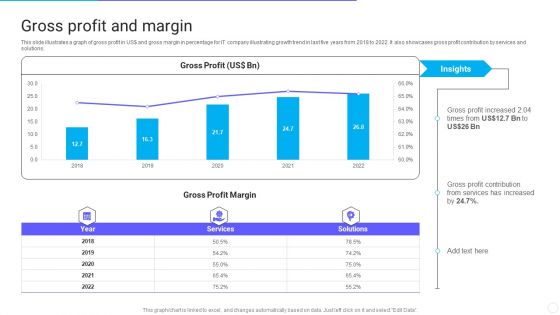
IT Application Services Company Outline Gross Profit And Margin Elements PDF
This slide illustrates a graph of gross profit in US dollar and gross margin in percentage for IT company illustrating growth trend in last five years from 2018 to 2022. It also showcases gross profit contribution by services and solutions. Deliver an awe inspiring pitch with this creative IT Application Services Company Outline Gross Profit And Margin Elements PDF bundle. Topics like Gross Profit Margin, Services can be discussed with this completely editable template. It is available for immediate download depending on the needs and requirements of the user.
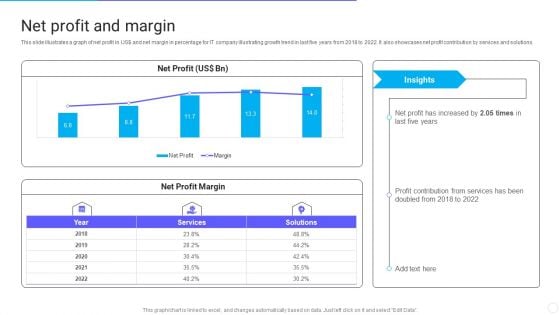
IT Application Services Company Outline Net Profit And Margin Structure PDF
This slide illustrates a graph of net profit in US dollar and net margin in percentage for IT company illustrating growth trend in last five years from 2018 to 2022. It also showcases net profit contribution by services and solutions. Deliver and pitch your topic in the best possible manner with this IT Application Services Company Outline Net Profit And Margin Structure PDF. Use them to share invaluable insights on Net Profit Margin, Services, Margin and impress your audience. This template can be altered and modified as per your expectations. So, grab it now.
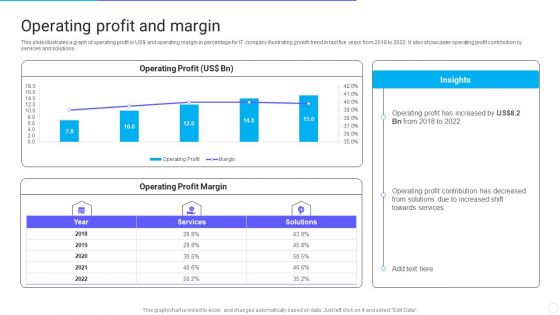
IT Application Services Company Outline Operating Profit And Margin Structure PDF
This slide illustrates a graph of operating profit in US dollar and operating margin in percentage for IT company illustrating growth trend in last five years from 2018 to 2022. It also showcases operating profit contribution by services and solutions. Deliver an awe inspiring pitch with this creative IT Application Services Company Outline Operating Profit And Margin Structure PDF bundle. Topics like Operating Profit And Margin can be discussed with this completely editable template. It is available for immediate download depending on the needs and requirements of the user.
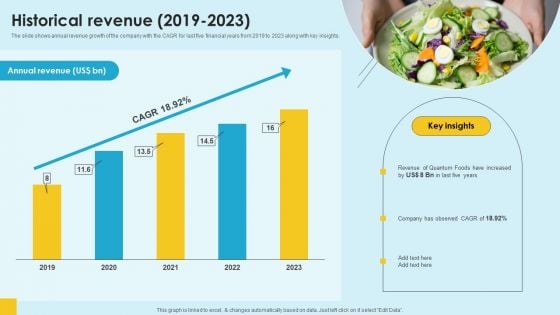
Food Company Financial Performance Summary Historical Revenue 2019 2023 Background PDF
The slide shows annual revenue growth of the company with the CAGR for last five financial years from 2019 to 2023 along with key insights. Take your projects to the next level with our ultimate collection of Food Company Financial Performance Summary Historical Revenue 2019 2023 Background PDF. Slidegeeks has designed a range of layouts that are perfect for representing task or activity duration, keeping track of all your deadlines at a glance. Tailor these designs to your exact needs and give them a truly corporate look with your own brand colors they will make your projects stand out from the rest
Net Profit And Margin IT Software Development Company Profile Icons PDF
This slide illustrates a graph of net profit in US doller and net margin in percentage for IT company illustrating growth trend in last five years from 2018 to 2022. It also showcases net profit contribution by services and solutions. Deliver an awe inspiring pitch with this creative Net Profit And Margin IT Software Development Company Profile Icons PDF bundle. Topics like Net Profit, Net Profit Margin can be discussed with this completely editable template. It is available for immediate download depending on the needs and requirements of the user.
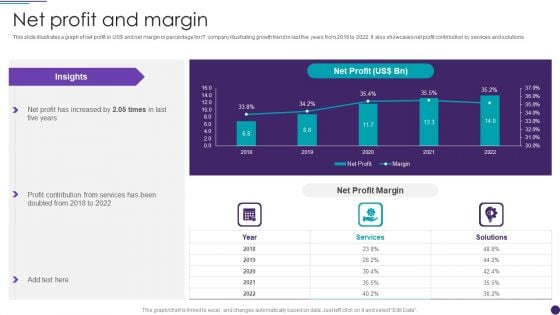
IT Services Business Profile Net Profit And Margin Sample PDF
This slide illustrates a graph of net profit in US doller and net margin in percentage for IT company illustrating growth trend in last five years from 2018 to 2022. It also showcases net profit contribution by services and solutions. Deliver and pitch your topic in the best possible manner with this IT Services Business Profile Net Profit And Margin Sample PDF. Use them to share invaluable insights on Services, Net Profit Margin and impress your audience. This template can be altered and modified as per your expectations. So, grab it now.
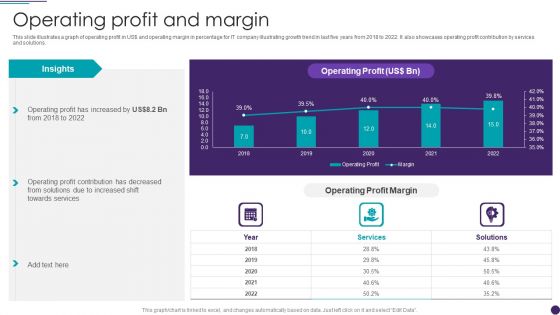
IT Services Business Profile Operating Profit And Margin Sample PDF
This slide illustrates a graph of operating profit in US doller and operating margin in percentage for IT company illustrating growth trend in last five years from 2018 to 2022. It also showcases operating profit contribution by services and solutions. Deliver an awe inspiring pitch with this creative IT Services Business Profile Operating Profit And Margin Sample PDF bundle. Topics like Operating Profit, Services can be discussed with this completely editable template. It is available for immediate download depending on the needs and requirements of the user.
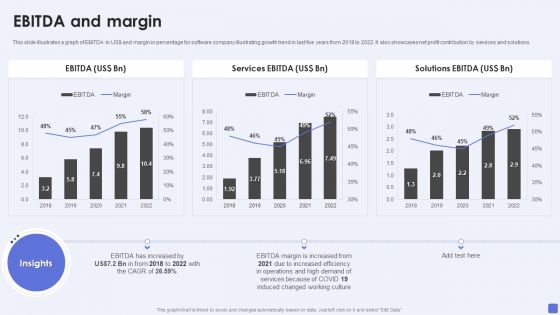
Software Services Business Profile EBITDA And Margin Ppt PowerPoint Presentation Gallery Slide Portrait PDF
This slide illustrates a graph of EBITDA in US dollar and margin in percentage for software company illustrating growth trend in last five years from 2018 to 2022. It also showcases net profit contribution by services and solutions. Deliver an awe inspiring pitch with this creative Software Services Business Profile EBITDA And Margin Ppt PowerPoint Presentation Gallery Slide Portrait PDF bundle. Topics like Services EB, Solutions EBITDA, EBITDA Margin can be discussed with this completely editable template. It is available for immediate download depending on the needs and requirements of the user.
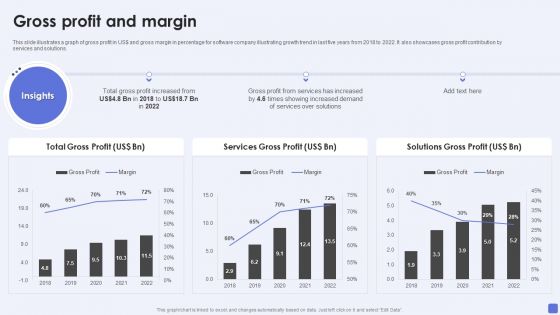
Software Services Business Profile Gross Profit And Margin Ppt PowerPoint Presentation Gallery Templates PDF
This slide illustrates a graph of gross profit in US dollar and gross margin in percentage for software company illustrating growth trend in last five years from 2018 to 2022. It also showcases gross profit contribution by services and solutions. Deliver an awe inspiring pitch with this creative Software Services Business Profile Gross Profit And Margin Ppt PowerPoint Presentation Gallery Templates PDF bundle. Topics like Total Gross Profit, Services Gross Profit, Solutions Gross Profit can be discussed with this completely editable template. It is available for immediate download depending on the needs and requirements of the user.
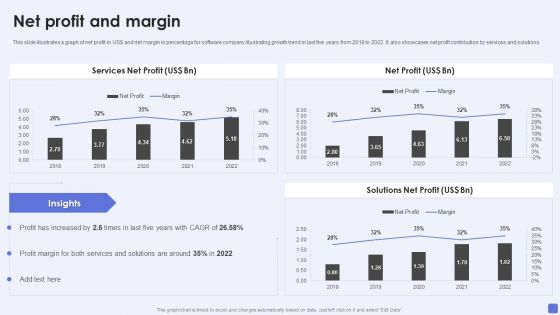
Software Services Business Profile Net Profit And Margin Ppt PowerPoint Presentation File Slides PDF
This slide illustrates a graph of net profit in US dollar and net margin in percentage for software company illustrating growth trend in last five years from 2018 to 2022. It also showcases net profit contribution by services and solutions. Deliver an awe inspiring pitch with this creative Software Services Business Profile Net Profit And Margin Ppt PowerPoint Presentation File Slides PDF bundle. Topics like Services Net Profit, Net Profit, Solutions Net Profit can be discussed with this completely editable template. It is available for immediate download depending on the needs and requirements of the user.
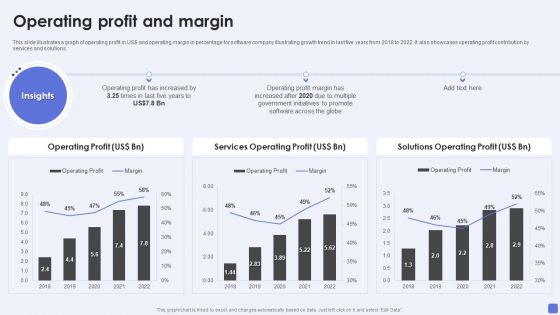
Software Services Business Profile Operating Profit And Margin Ppt PowerPoint Presentation Gallery Inspiration PDF
This slide illustrates a graph of operating profit in US dollar and operating margin in percentage for software company illustrating growth trend in last five years from 2018 to 2022. It also showcases operating profit contribution by services and solutions. Deliver and pitch your topic in the best possible manner with this Software Services Business Profile Operating Profit And Margin Ppt PowerPoint Presentation Gallery Inspiration PDF. Use them to share invaluable insights on Operating Profit, Services Operating Profit, Solutions Operating Profit and impress your audience. This template can be altered and modified as per your expectations. So, grab it now.
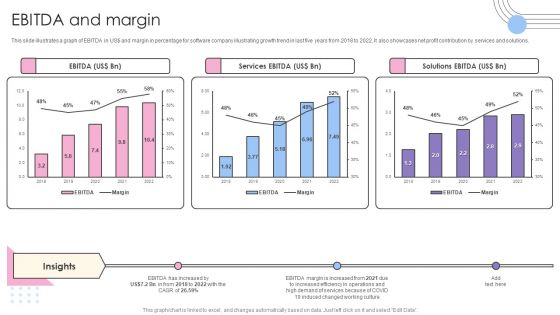
Software Products And Solutions Firm Details EBITDA And Margin Structure PDF
This slide illustrates a graph of EBITDA in US dollar and margin in percentage for software company illustrating growth trend in last five years from 2018 to 2022. It also showcases net profit contribution by services and solutions. Deliver an awe inspiring pitch with this creative Software Products And Solutions Firm Details EBITDA And Margin Structure PDF bundle. Topics like EBITDA, Services EBITDA, Solutions EBITDA, 2018 To 2022 can be discussed with this completely editable template. It is available for immediate download depending on the needs and requirements of the user.
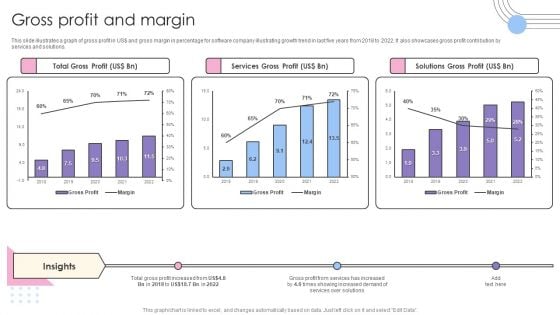
Software Products And Solutions Firm Details Gross Profit And Margin Pictures PDF
This slide illustrates a graph of gross profit in US dollar and gross margin in percentage for software company illustrating growth trend in last five years from 2018 to 2022. It also showcases gross profit contribution by services and solutions. Deliver and pitch your topic in the best possible manner with this Software Products And Solutions Firm Details Gross Profit And Margin Pictures PDF. Use them to share invaluable insights on Total Gross Profit, Services Gross Profit, Solutions Gross Profit and impress your audience. This template can be altered and modified as per your expectations. So, grab it now.
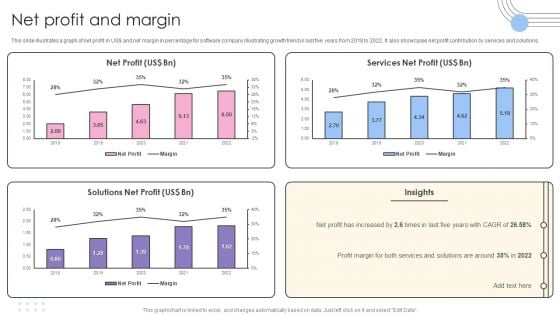
Software Products And Solutions Firm Details Net Profit And Margin Information PDF
This slide illustrates a graph of net profit in US dollar and net margin in percentage for software company illustrating growth trend in last five years from 2018 to 2022. It also showcases net profit contribution by services and solutions. Deliver and pitch your topic in the best possible manner with this Software Products And Solutions Firm Details Net Profit And Margin Information PDF. Use them to share invaluable insights on Net Profit, Services Net Profit, Solutions Net Profit and impress your audience. This template can be altered and modified as per your expectations. So, grab it now.

Software Products And Solutions Firm Details Operating Profit And Margin Mockup PDF
This slide illustrates a graph of operating profit in US dollar and operating margin in percentage for software company illustrating growth trend in last five years from 2018 to 2022. It also showcases operating profit contribution by services and solutions. Deliver an awe inspiring pitch with this creative Software Products And Solutions Firm Details Operating Profit And Margin Mockup PDF bundle. Topics like Operating Profit, Services Operating Profit, Solutions Operating Profit can be discussed with this completely editable template. It is available for immediate download depending on the needs and requirements of the user.
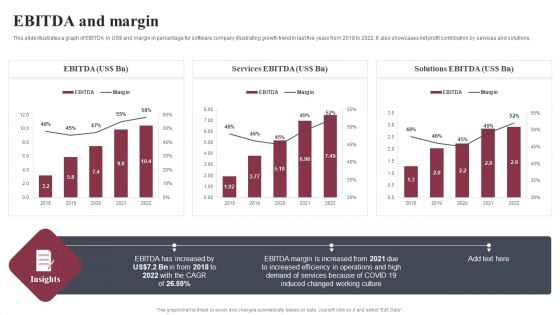
Business Software Development Company Profile EBITDA And Margin Summary PDF
This slide illustrates a graph of EBITDA in US dollar and margin in percentage for software company illustrating growth trend in last five years from 2018 to 2022. It also showcases net profit contribution by services and solutions. Deliver an awe inspiring pitch with this creative Business Software Development Company Profile EBITDA And Margin Summary PDF bundle. Topics like EBITDA, Services EBITDA, Solutions EBITDA can be discussed with this completely editable template. It is available for immediate download depending on the needs and requirements of the user.
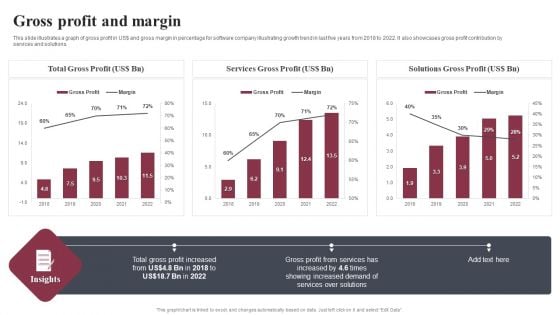
Business Software Development Company Profile Gross Profit And Margin Microsoft PDF
This slide illustrates a graph of gross profit in US dollar and gross margin in percentage for software company illustrating growth trend in last five years from 2018 to 2022. It also showcases gross profit contribution by services and solutions. Deliver and pitch your topic in the best possible manner with this Business Software Development Company Profile Gross Profit And Margin Microsoft PDF. Use them to share invaluable insights on Total Gross Profit, Services Gross Profit, Solutions Gross Profit and impress your audience. This template can be altered and modified as per your expectations. So, grab it now.
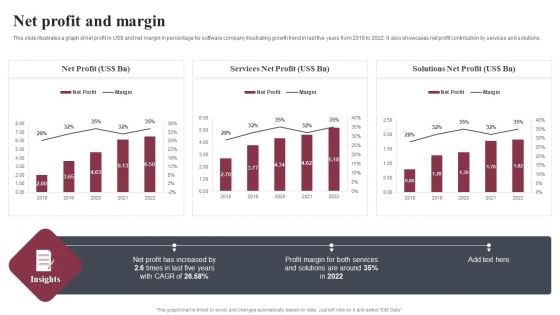
Business Software Development Company Profile Net Profit And Margin Mockup PDF
This slide illustrates a graph of net profit in US dollar and net margin in percentage for software company illustrating growth trend in last five years from 2018 to 2022. It also showcases net profit contribution by services and solutions. Deliver an awe inspiring pitch with this creative Business Software Development Company Profile Net Profit And Margin Mockup PDF bundle. Topics like Net Profit, Services Net Profit, Solutions Net Profit can be discussed with this completely editable template. It is available for immediate download depending on the needs and requirements of the user.
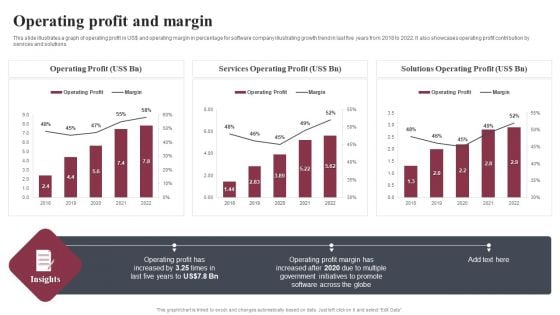
Business Software Development Company Profile Operating Profit And Margin Summary PDF
This slide illustrates a graph of operating profit in US dollar and operating margin in percentage for software company illustrating growth trend in last five years from 2018 to 2022. It also showcases operating profit contribution by services and solutions. Deliver and pitch your topic in the best possible manner with this Business Software Development Company Profile Operating Profit And Margin Summary PDF. Use them to share invaluable insights on Operating Profit, Services Operating Profit, Solutions Operating Profit and impress your audience. This template can be altered and modified as per your expectations. So, grab it now.
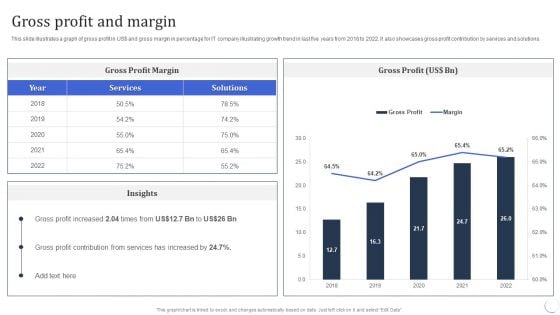
Infotech Solutions Research And Development Company Summary Gross Profit And Margin Ideas PDF
This slide illustrates a graph of gross profit in US dollar and gross margin in percentage for IT company illustrating growth trend in last five years from 2018 to 2022. It also showcases gross profit contribution by services and solutions. Deliver an awe inspiring pitch with this creative Infotech Solutions Research And Development Company Summary Gross Profit And Margin Ideas PDF bundle. Topics like Services, Gross Profit Margin can be discussed with this completely editable template. It is available for immediate download depending on the needs and requirements of the user.
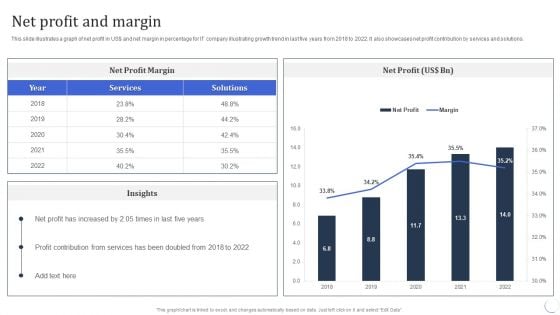
Infotech Solutions Research And Development Company Summary Net Profit And Margin Information PDF
This slide illustrates a graph of net profit in US dollar and net margin in percentage for IT company illustrating growth trend in last five years from 2018 to 2022. It also showcases net profit contribution by services and solutions. Deliver and pitch your topic in the best possible manner with this Infotech Solutions Research And Development Company Summary Net Profit And Margin Information PDF. Use them to share invaluable insights on Profit Contribution, Services, Net Profit and impress your audience. This template can be altered and modified as per your expectations. So, grab it now.
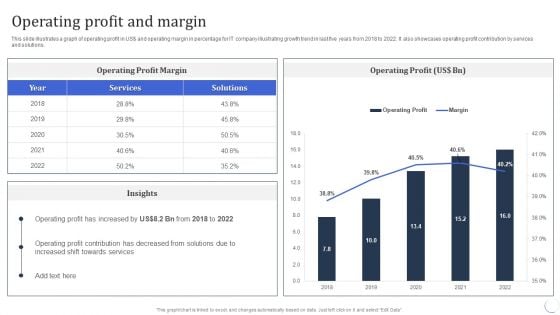
Infotech Solutions Research And Development Company Summary Operating Profit And Margin Download PDF
This slide illustrates a graph of operating profit in US dollar and operating margin in percentage for IT company illustrating growth trend in last five years from 2018 to 2022. It also showcases operating profit contribution by services and solutions. Deliver an awe inspiring pitch with this creative Infotech Solutions Research And Development Company Summary Operating Profit And Margin Download PDF bundle. Topics like Services, Operating Profit can be discussed with this completely editable template. It is available for immediate download depending on the needs and requirements of the user.
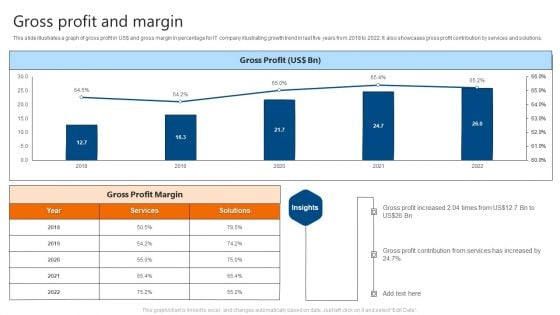
Gross Profit And Margin IT Software Development Company Profile Slides PDF
This slide illustrates a graph of gross profit in US doller and gross margin in percentage for IT company illustrating growth trend in last five years from 2018 to 2022. It also showcases gross profit contribution by services and solutions. Deliver and pitch your topic in the best possible manner with this Gross Profit And Margin IT Software Development Company Profile Slides PDF. Use them to share invaluable insights on Gross Profit, Margin and impress your audience. This template can be altered and modified as per your expectations. So, grab it now.
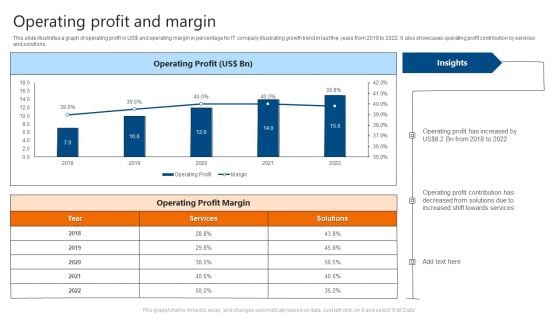
Operating Profit And Margin IT Software Development Company Profile Guidelines PDF
This slide illustrates a graph of operating profit in US doller and operating margin in percentage for IT company illustrating growth trend in last five years from 2018 to 2022. It also showcases operating profit contribution by services and solutions. Deliver and pitch your topic in the best possible manner with this Operating Profit And Margin IT Software Development Company Profile Guidelines PDF. Use them to share invaluable insights on Operating Profit, Operating Profit Margin and impress your audience. This template can be altered and modified as per your expectations. So, grab it now.
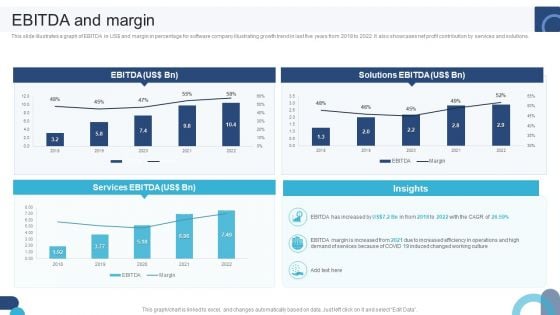
Digital Application Software Development Business Profile EBITDA And Margin Guidelines PDF
This slide illustrates a graph of EBITDA in US dollar and margin in percentage for software company illustrating growth trend in last five years from 2018 to 2022. It also showcases net profit contribution by services and solutions. If your project calls for a presentation, then Slidegeeks is your go-to partner because we have professionally designed, easy-to-edit templates that are perfect for any presentation. After downloading, you can easily edit Digital Application Software Development Business Profile EBITDA And Margin Guidelines PDF and make the changes accordingly. You can rearrange slides or fill them with different images. Check out all the handy templates

Engineering Services Company Report Gross Profit And Margin Ppt PowerPoint Presentation File Show PDF
This slide illustrates a graph of gross profit in US dollar and gross margin in percentage for engineering company illustrating growth trend in last five years from 2018 to 2022. From laying roadmaps to briefing everything in detail, our templates are perfect for you. You can set the stage with your presentation slides. All you have to do is download these easy-to-edit and customizable templates. Engineering Services Company Report Gross Profit And Margin Ppt PowerPoint Presentation File Show PDF will help you deliver an outstanding performance that everyone would remember and praise you for. Do download this presentation today.
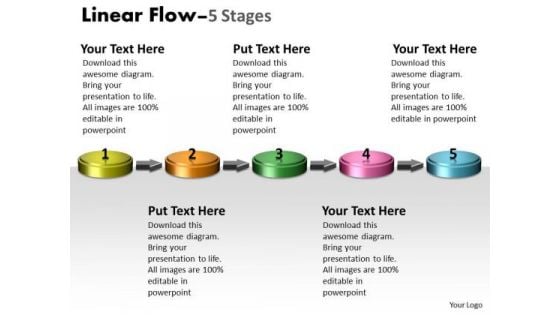
Ppt Template 3d Linear Flow Five Steps Spider Diagram PowerPoint 1 Graphic
We present our PPT template 3d linear flow five steps spider diagram PowerPoint 1 Graphic. Use our Arrows PowerPoint Templates because, Expound on how you plan to gain their confidence and assure them of continued and consistent excellence in quality of service. Use our Symbol PowerPoint Templates because, the plans are in your head, stage by stage, year by year. Use our Business PowerPoint Templates because, However it requires care and diligence to function well. Use our Spheres PowerPoint Templates because, our cleverly selected background hues are guaranteed to achieve this aim. Use our Metaphor PowerPoint Templates because, they are indicators of the path you have in mind. Use these PowerPoint slides for presentations relating to Arrow, Background, Business, Chart, Diagram, Financial, Flow, Graphic, Gray, Icon, Illustration, Linear, Management, Perspective, Process, Reflection, Spheres, Stage, Text. The prominent colors used in the PowerPoint template are Green, Orange, and Pink Enhance your charisma with our Ppt Template 3d Linear Flow Five Steps Spider Diagram PowerPoint 1 Graphic. Allow your aura to flow around.
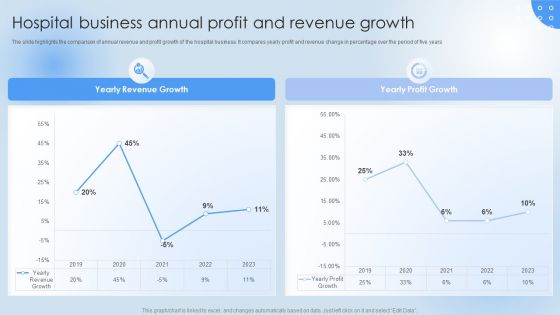
Pharmaceutical Company Financial Summary Hospital Business Annual Profit Template PDF
The slide highlights the comparison of annual revenue and profit growth of the hospital business. It compares yearly profit and revenue change in percentage over the period of five years. Do you know about Slidesgeeks Pharmaceutical Company Financial Summary Hospital Business Annual Profit Template PDF These are perfect for delivering any kind od presentation. Using it, create PowerPoint presentations that communicate your ideas and engage audiences. Save time and effort by using our pre-designed presentation templates that are perfect for a wide range of topic. Our vast selection of designs covers a range of styles, from creative to business, and are all highly customizable and easy to edit. Download as a PowerPoint template or use them as Google Slides themes.


 Continue with Email

 Home
Home


