Agenda Infographic
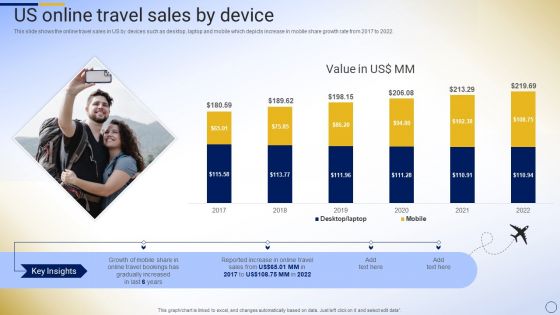
Online Tour And Travel Company Profile US Online Travel Sales By Device Infographics PDF
This slide shows the online travel sales in US by devices such as desktop, laptop and mobile which depicts increase in mobile share growth rate from 2017 to 2022.Deliver and pitch your topic in the best possible manner with this Online Tour And Travel Company Profile US Online Travel Sales By Device Infographics PDF. Use them to share invaluable insights on Growth Mobile, Travel Bookings, Gradually Increased and impress your audience. This template can be altered and modified as per your expectations. So, grab it now.
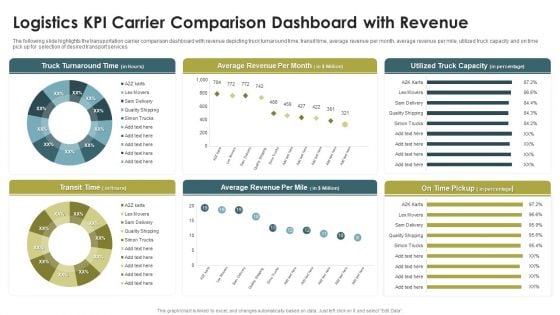
Logistics KPI Carrier Comparison Dashboard With Revenue Ppt Infographics Portfolio PDF
The following slide highlights the transportation carrier comparison dashboard with revenue depicting truck turnaround time, transit time, average revenue per month, average revenue per mile, utilized truck capacity and on time pick up for selection of desired transport services. Pitch your topic with ease and precision using this Logistics KPI Carrier Comparison Dashboard With Revenue Ppt Infographics Portfolio PDF. This layout presents information on Truck Turnaround Time, Average Revenue, Per Month, Transit Time. It is also available for immediate download and adjustment. So, changes can be made in the color, design, graphics or any other component to create a unique layout.
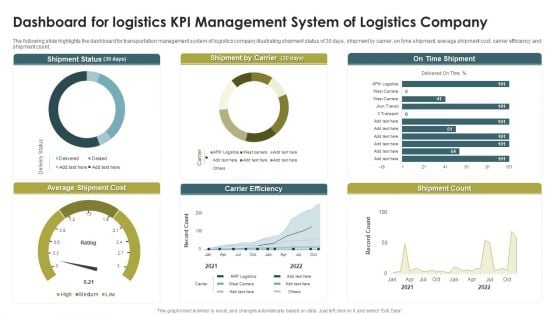
Dashboard For Logistics KPI Management System Of Logistics Company Infographics PDF
The following slide highlights the dashboard for transportation management system of logistics company illustrating shipment status of 30 days, shipment by carrier, on time shipment, average shipment cost, carrier efficiency and shipment count. Pitch your topic with ease and precision using this Dashboard For Logistics KPI Management System Of Logistics Company Infographics PDF. This layout presents information on Shipment Status, Shipment By Carrier, On Time Shipment. It is also available for immediate download and adjustment. So, changes can be made in the color, design, graphics or any other component to create a unique layout.
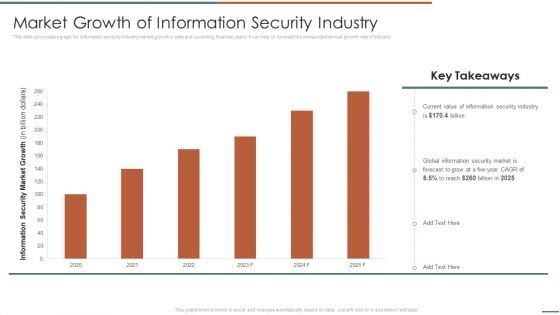
Information Security Risk Evaluation Market Growth Of Information Security Industry Infographics PDF
This slide showcases graph for information security industry market growth in past and upcoming financial years. It can help to forecast the compunded annual growth rate of industry .Deliver and pitch your topic in the best possible manner with this Information Security Risk Evaluation Market Growth Of Information Security Industry Infographics PDF. Use them to share invaluable insights on Information Security, Global Information, Security Market and impress your audience. This template can be altered and modified as per your expectations. So, grab it now.
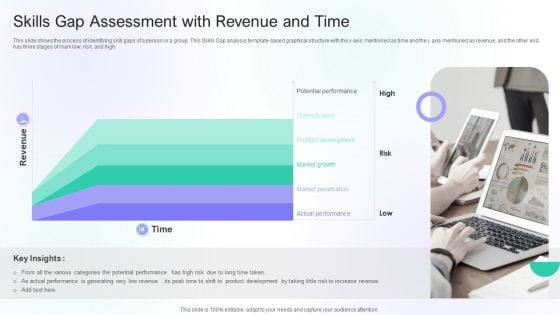
Skills Gap Assessment With Revenue And Time Ppt PowerPoint Presentation Infographics Format PDF
This slide shows the process of identifying skill gaps of a person or a group. This Skills Gap analysis template-based graphical structure with the x axis mentioned as time and the y axis mentioned as revenue, and the other end has three stages of mark low, risk, and high. Showcasing this set of slides titled Skills Gap Assessment With Revenue And Time Ppt PowerPoint Presentation Infographics Format PDF. The topics addressed in these templates are Potential Performance, Product Development, Market Penetration. All the content presented in this PPT design is completely editable. Download it and make adjustments in color, background, font etc. as per your unique business setting.
Online Customer Interaction Dashboard For Tracking Customer Service Team Performance Infographics PDF
This slide covers the KPI dashboard for analyzing the performance of client support department. It includes metrics such as first call resolution, unresolved calls, average response rate, the best day to call, average time to solve issues, etc. Deliver and pitch your topic in the best possible manner with this Online Customer Interaction Dashboard For Tracking Customer Service Team Performance Infographics PDF. Use them to share invaluable insights on Response Time, Issue Solving, Call Resolution and impress your audience. This template can be altered and modified as per your expectations. So, grab it now.
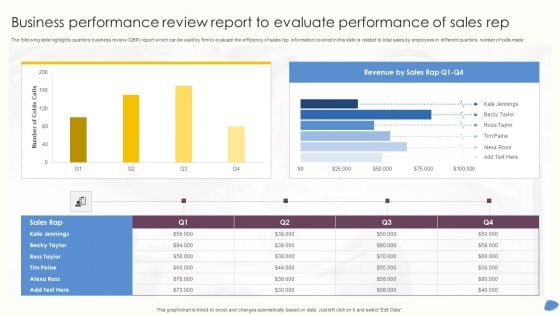
Business Performance Review Report To Evaluate Performance Of Sales Rep Infographics PDF
The following slide highlights quarterly business review QBR report which can be used by firm to evaluate the efficiency of sales rep. information covered in this slide is related to total sales by employees in different quarters, number of calls made. Pitch your topic with ease and precision using this Business Performance Review Report To Evaluate Performance Of Sales Rep Infographics PDF. This layout presents information on Revenue Sales, Tim Paine, Number Colds Calls. It is also available for immediate download and adjustment. So, changes can be made in the color, design, graphics or any other component to create a unique layout.
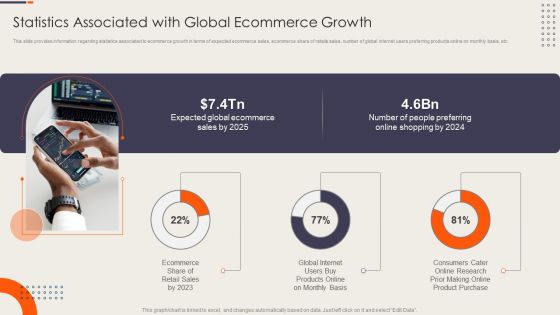
Strategy Playbook For Ecommerce Business Statistics Associated With Global Ecommerce Growth Infographics PDF
This slide provides information regarding statistics associated to ecommerce growth in terms of expected ecommerce sales, ecommerce share of retails sales, number of global internet users preferring products online on monthly basis, etc. Deliver and pitch your topic in the best possible manner with this Strategy Playbook For Ecommerce Business Statistics Associated With Global Ecommerce Growth Infographics PDF. Use them to share invaluable insights on Global Ecommerce, People Preferring, Ecommerce Share and impress your audience. This template can be altered and modified as per your expectations. So, grab it now.
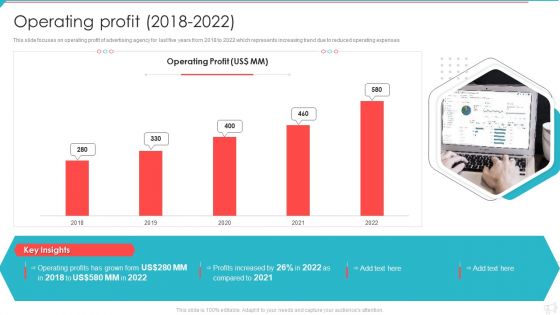
Advertisement And Marketing Agency Company Profile Operating Profit 2018 To 2022 Infographics PDF
This slide focuses on operating profit of advertising agency for last five years from 2018 to 2022 which represents increasing trend due to reduced operating expenses. Deliver and pitch your topic in the best possible manner with this Advertisement And Marketing Agency Company Profile Operating Profit 2018 To 2022 Infographics PDF. Use them to share invaluable insights on Operating Profit, Profits Increased, 2018 To 2022 and impress your audience. This template can be altered and modified as per your expectations. So, grab it now.
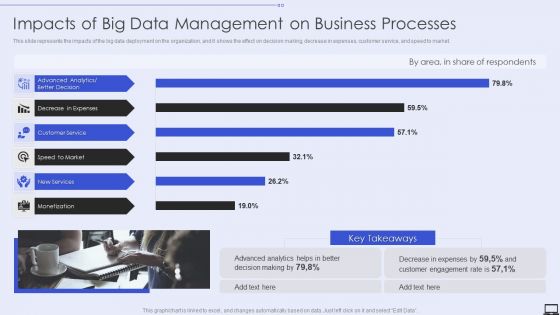
Impacts Of Big Data Management On Business Processes Ppt PowerPoint Presentation File Infographics PDF
This slide represents the impacts of the big data deployment on the organization, and it shows the effect on decision making, decrease in expenses, customer service, and speed to market. Deliver and pitch your topic in the best possible manner with this Impacts Of Big Data Management On Business Processes Ppt PowerPoint Presentation File Infographics PDF. Use them to share invaluable insights on Decision Making, Expenses, Customer Engagement Rate and impress your audience. This template can be altered and modified as per your expectations. So, grab it now.
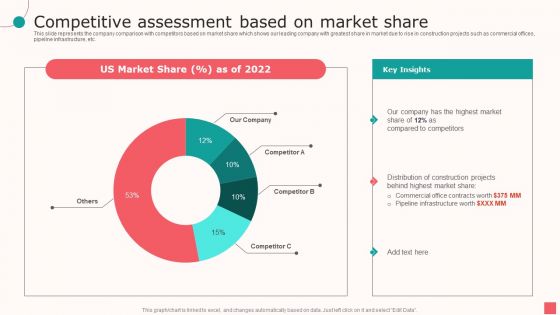
Real Estate Company Details Competitive Assessment Based On Market Share Ppt PowerPoint Presentation Summary Infographics PDF
This slide represents the company comparison with competitors based on market share which shows our leading company with greatest share in market due to rise in construction projects such as commercial offices, pipeline infrastructure, etc.Deliver an awe inspiring pitch with this creative Real Estate Company Details Competitive Assessment Based On Market Share Ppt PowerPoint Presentation Summary Infographics PDF bundle. Topics like Compared Competitors, Distribution Construction, Pipeline Infrastructure can be discussed with this completely editable template. It is available for immediate download depending on the needs and requirements of the user.
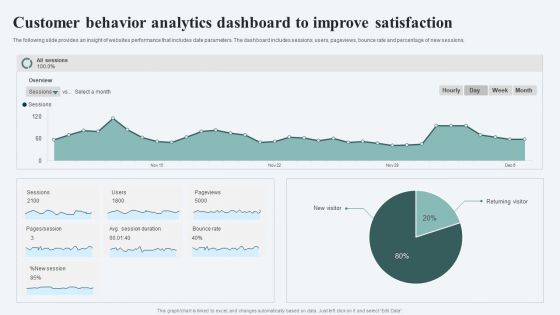
Customer Behavior Analytics Dashboard To Improve Satisfaction Ppt File Infographics PDF
The following slide provides an insight of websites performance that includes date parameters. The dashboard includes sessions, users, pageviews, bounce rate and percentage of new sessions. Pitch your topic with ease and precision using this Customer Behavior Analytics Dashboard To Improve Satisfaction Ppt File Infographics PDF. This layout presents information on Session, Avg Session Duration, Bounce Rate. It is also available for immediate download and adjustment. So, changes can be made in the color, design, graphics or any other component to create a unique layout.
Warehouse Automation Deployment Dashboard For Tracking Impact Of Warehouse House Infographics PDF
This slide covers the dashboard with after automation warehouse overview. It include KPIs such as autonomous robots status, robotic arms status, battery level, performance, time to return, etc. Deliver and pitch your topic in the best possible manner with this Warehouse Automation Deployment Dashboard For Tracking Impact Of Warehouse House Infographics PDF. Use them to share invaluable insights on Autonomous Robot, Systems Engineer, Warehouse Manager and impress your audience. This template can be altered and modified as per your expectations. So, grab it now.
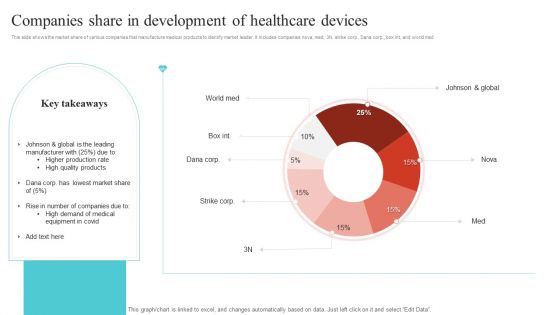
Companies Share In Development Of Healthcare Devices Ppt Summary Infographics PDF
This slide shows the market share of various companies that manufacture medical products to identify market leader. It includes companies nova, med, 3N, strike corp., Dana corp., box int, and world med. Showcasing this set of slides titled Companies Share In Development Of Healthcare Devices Ppt Summary Infographics PDF. The topics addressed in these templates are Johnson And Global, High Quality Products, Higher Production Rate. All the content presented in this PPT design is completely editable. Download it and make adjustments in color, background, font etc. as per your unique business setting.
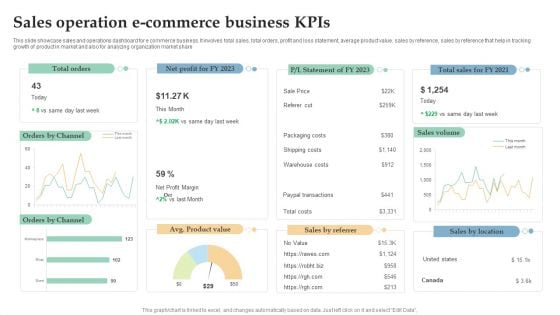
Sales Operation E Commerce Business Kpis Ppt Infographics Design Templates PDF
This slide showcase sales and operations dashboard for e commerce business. It involves total sales, total orders, profit and loss statement, average product value, sales by reference, sales by reference that help in tracking growth of product in market and also for analyzing organization market share. Pitch your topic with ease and precision using this Sales Operation E Commerce Business Kpis Ppt Infographics Design Templates PDF. This layout presents information on Total Orders, Sales Volume, Orders Channel. It is also available for immediate download and adjustment. So, changes can be made in the color, design, graphics or any other component to create a unique layout.
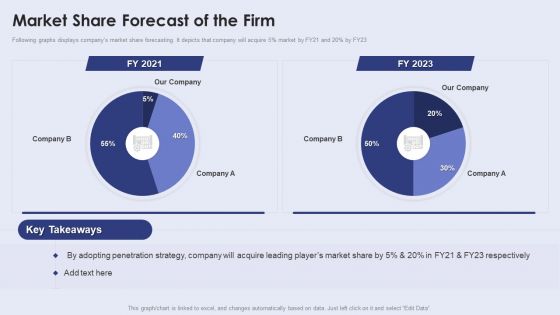
Creating New Product Launch Campaign Strategy Market Share Forecast Of The Firm Infographics PDF
Following graphs displays companys market share forecasting. It depicts that company will acquire 5 percent market by FY21 and 20 percent by FY23. This Creating New Product Launch Campaign Strategy Market Share Forecast Of The Firm Infographics PDF is perfect for any presentation, be it in front of clients or colleagues. It is a versatile and stylish solution for organizing your meetings. The product features a modern design for your presentation meetings. The adjustable and customizable slides provide unlimited possibilities for acing up your presentation. Slidegeeks has done all the homework before launching the product for you. So, dont wait, grab the presentation templates today.
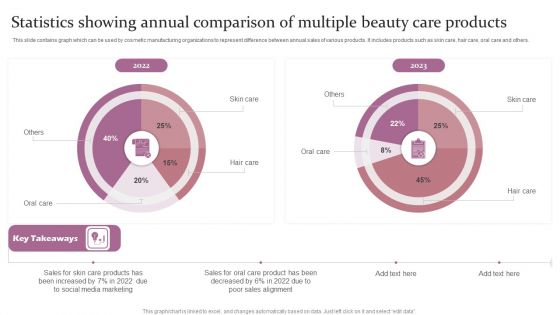
Statistics Showing Annual Comparison Of Multiple Beauty Care Products Ppt Infographics Objects PDF
This slide contains graph which can be used by cosmetic manufacturing organizations to represent difference between annual sales of various products. It includes products such as skin care, hair care, oral care and others. Showcasing this set of slides titled Statistics Showing Annual Comparison Of Multiple Beauty Care Products Ppt Infographics Objects PDF. The topics addressed in these templates are Skin Care, Hair Care, 2022 To 2023. All the content presented in this PPT design is completely editable. Download it and make adjustments in color, background, font etc. as per your unique business setting.
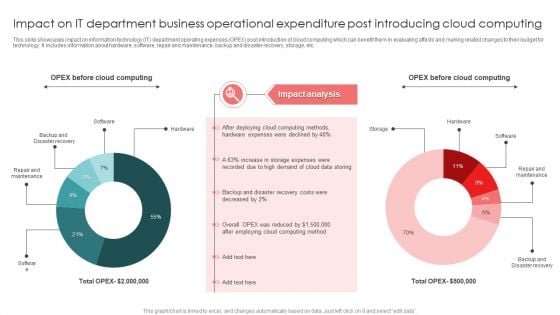
Impact On IT Department Business Operational Expenditure Post Introducing Cloud Computing Infographics PDF
This slide showcases impact on information technology IT department operating expenses OPEX post introduction of cloud computing which can benefit them in evaluating affects and making related changes to their budget for technology. It includes information about hardware, software, repair and maintenance, backup and disaster recovery, storage, etc. Showcasing this set of slides titled Impact On IT Department Business Operational Expenditure Post Introducing Cloud Computing Infographics PDF. The topics addressed in these templates are Software, Hardware, Storage. All the content presented in this PPT design is completely editable. Download it and make adjustments in color, background, font etc. as per your unique business setting.
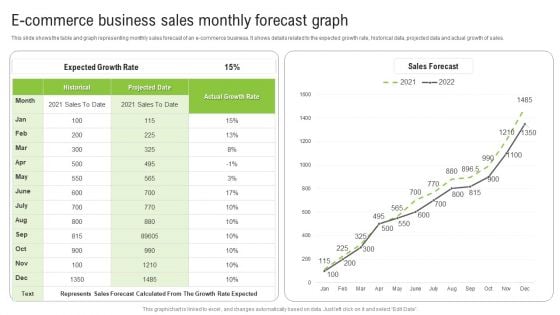
E Commerce Business Sales Monthly Forecast Graph Ppt Infographics Show PDF
This slide shows the table and graph representing monthly sales forecast of an e-commerce business. It shows details related to the expected growth rate, historical data, projected data and actual growth of sales. Pitch your topic with ease and precision using this E Commerce Business Sales Monthly Forecast Graph Ppt Infographics Show PDF. This layout presents information on Expected Growth Rate, Historical, Actual Growth Rate. It is also available for immediate download and adjustment. So, changes can be made in the color, design, graphics or any other component to create a unique layout.
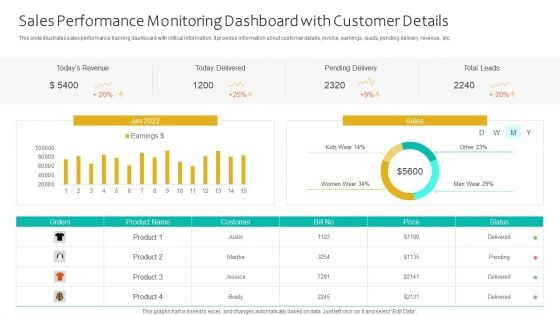
Sales Performance Monitoring Dashboard With Customer Details Ppt Infographics Themes PDF
This slide illustrates sales performance tracking dashboard with critical information. It provides information about customer details, invoice, earnings, leads, pending delivery, revenue, etc. Pitch your topic with ease and precision using this Sales Performance Monitoring Dashboard With Customer Details Ppt Infographics Themes PDF. This layout presents information on Todays Revenue, Today Delivered, Pending Delivery, Total Leads. It is also available for immediate download and adjustment. So, changes can be made in the color, design, graphics or any other component to create a unique layout.
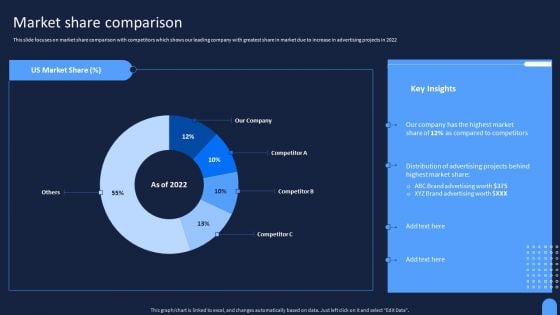
Ad And Media Agency Company Profile Market Share Comparison Infographics PDF
This slide focuses on market share comparison with competitors which shows our leading company with greatest share in market due to increase in advertising projects in 2022. If your project calls for a presentation, then Slidegeeks is your go-to partner because we have professionally designed, easy-to-edit templates that are perfect for any presentation. After downloading, you can easily edit Ad And Media Agency Company Profile Market Share Comparison Infographics PDF and make the changes accordingly. You can rearrange slides or fill them with different images. Check out all the handy templates.
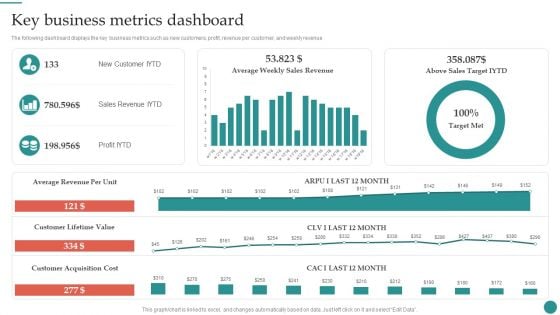
Key Business Metrics Dashboard Company Process Administration And Optimization Playbook Infographics PDF
The following dashboard displays the key business metrics such as new customers, profit, revenue per customer, and weekly revenue. Slidegeeks is here to make your presentations a breeze with Key Business Metrics Dashboard Company Process Administration And Optimization Playbook Infographics PDF With our easy-to-use and customizable templates, you can focus on delivering your ideas rather than worrying about formatting. With a variety of designs to choose from, you are sure to find one that suits your needs. And with animations and unique photos, illustrations, and fonts, you can make your presentation pop. So whether you are giving a sales pitch or presenting to the board, make sure to check out Slidegeeks first.
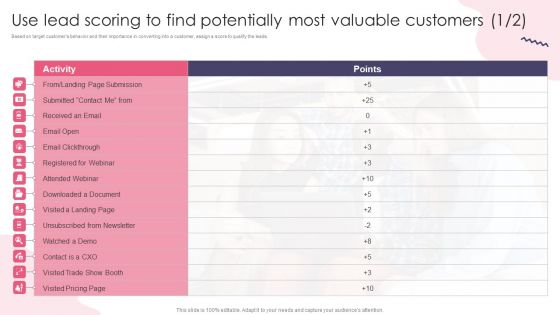
Use Lead Scoring To Find Potentially Most Valuable Customers Infographics PDF
Based on target customers behavior and their importance in converting into a customer, assign a score to qualify the leads. Retrieve professionally designed Use Lead Scoring To Find Potentially Most Valuable Customers Infographics PDF to effectively convey your message and captivate your listeners. Save time by selecting pre-made slideshows that are appropriate for various topics, from business to educational purposes. These themes come in many different styles, from creative to corporate, and all of them are easily adjustable and can be edited quickly. Access them as PowerPoint templates or as Google Slides themes. You do not have to go on a hunt for the perfect presentation because Slidegeeks got you covered from everywhere.
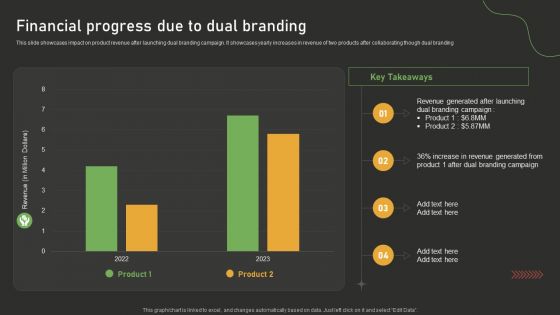
Financial Progress Due To Dual Branding Dual Branding Campaign For Product Promotion Infographics PDF
This slide showcases impact on product revenue after launching dual branding campaign. It showcases yearly increases in revenue of two products after collaborating though dual branding.Make sure to capture your audiences attention in your business displays with our gratis customizable Financial Progress Due To Dual Branding Dual Branding Campaign For Product Promotion Infographics PDF. These are great for business strategies, office conferences, capital raising or task suggestions. If you desire to acquire more customers for your tech business and ensure they stay satisfied, create your own sales presentation with these plain slides.
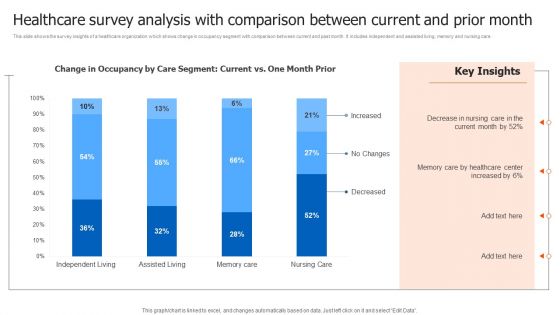
Healthcare Survey Analysis With Comparison Between Current And Prior Month Infographics PDF
This slide shows the survey insights of a healthcare organization which shows change in occupancy segment with comparison between current and past month. It includes independent and assisted living, memory and nursing care. Showcasing this set of slides titled Healthcare Survey Analysis With Comparison Between Current And Prior Month Infographics PDF. The topics addressed in these templates are Healthcare Survey Analysis, Comparison Between Current. All the content presented in this PPT design is completely editable. Download it and make adjustments in color, background, font etc. as per your unique business setting.
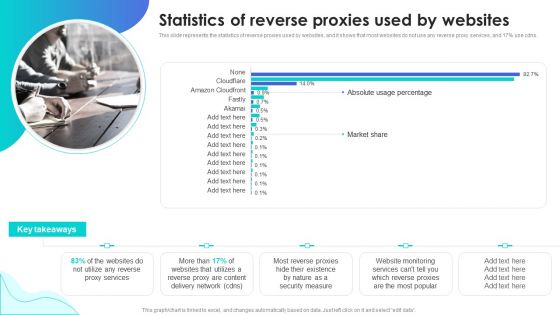
Reverse Proxy Web Server Statistics Of Reverse Proxies Used By Websites Infographics PDF
This slide represents the statistics of reverse proxies used by websites, and it shows that most websites do not use any reverse proxy services, and 17 percent use cdns. Boost your pitch with our creative Reverse Proxy Web Server Statistics Of Reverse Proxies Used By Websites Infographics PDF. Deliver an awe-inspiring pitch that will mesmerize everyone. Using these presentation templates you will surely catch everyones attention. You can browse the ppts collection on our website. We have researchers who are experts at creating the right content for the templates. So you dont have to invest time in any additional work. Just grab the template now and use them.
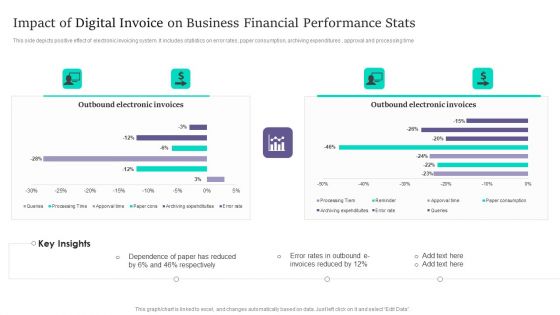
Impact Of Digital Invoice On Business Financial Performance Stats Infographics PDF
This side depicts positive effect of electronic invoicing system. It includes statistics on error rates, paper consumption, archiving expenditures , approval and processing time. Pitch your topic with ease and precision using this Impact Of Digital Invoice On Business Financial Performance Stats Infographics PDF. This layout presents information on Impact Of Digital Invoice, Business Financial Performance Stats. It is also available for immediate download and adjustment. So, changes can be made in the color, design, graphics or any other component to create a unique layout.
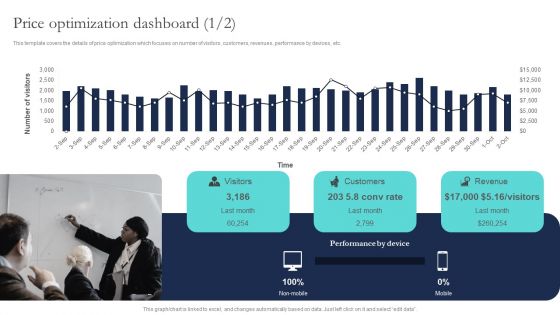
Optimizing Smart Pricing Tactics To Improve Sales Price Optimization Dashboard Infographics PDF
This template covers the details of price optimization which focuses on number of visitors, customers, revenues, performance by devices, etc. From laying roadmaps to briefing everything in detail, our templates are perfect for you. You can set the stage with your presentation slides. All you have to do is download these easy to edit and customizable templates. Optimizing Smart Pricing Tactics To Improve Sales Price Optimization Dashboard Infographics PDF will help you deliver an outstanding performance that everyone would remember and praise you for. Do download this presentation today.
Construction Project Instructions Playbook Ongoing Construction Project Progress Tracking Dashboard Infographics PDF
This slide provides information regarding ongoing construction project progress tracking dashboard along with details such as project status, project type, project progress, etc. This modern and well arranged Construction Project Instructions Playbook Ongoing Construction Project Progress Tracking Dashboard Infographics PDF provides lots of creative possibilities. It is very simple to customize and edit with the Powerpoint Software. Just drag and drop your pictures into the shapes. All facets of this template can be edited with Powerpoint no extra software is necessary. Add your own material, put your images in the places assigned for them, adjust the colors, and then you can show your slides to the world, with an animated slide included.
Essential Retail Store Activities Tracking Dashboard Customer Engagement Administration Infographics PDF
This slide provides details regarding the dashboard for tracking retail store activities in terms of sales, conversion rate, traffic, average transaction value, recommendations, etc. This modern and well-arranged Essential Retail Store Activities Tracking Dashboard Customer Engagement Administration Infographics PDF provides lots of creative possibilities. It is very simple to customize and edit with the Powerpoint Software. Just drag and drop your pictures into the shapes. All facets of this template can be edited with Powerpoint no extra software is necessary. Add your own material, put your images in the places assigned for them, adjust the colors, and then you can show your slides to the world, with an animated slide included.
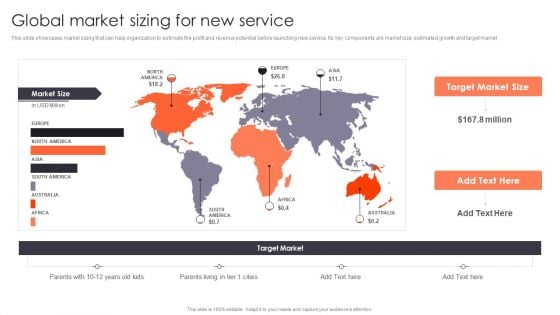
Promotion Strategies For New Service Launch Global Market Sizing For New Service Infographics PDF
This slide showcases market sizing that can help organization to estimate the profit and revenue potential before launching new service. Its key components are market size, estimated growth and target market. Take your projects to the next level with our ultimate collection of Promotion Strategies For New Service Launch Global Market Sizing For New Service Infographics PDF. Slidegeeks has designed a range of layouts that are perfect for representing task or activity duration, keeping track of all your deadlines at a glance. Tailor these designs to your exact needs and give them a truly corporate look with your own brand colors they will make your projects stand out from the rest.
Issues Tracking Dashboard For Organizational Building Management Ppt Infographics Topics PDF
This slide showcases dashboard which can help organization to keep track of issues plus faults during facility management and rectify them within stipulated time. Its key elements are issues reported, fault tracking, etc. Pitch your topic with ease and precision using this Issues Tracking Dashboard For Organizational Building Management Ppt Infographics Topics PDF. This layout presents information on Fault Tracking, Issues Reported, Location. It is also available for immediate download and adjustment. So, changes can be made in the color, design, graphics or any other component to create a unique layout.
Operational Savings Due To Adoption Of Cloud Based Service Ppt Infographics Icons PDF
This slide depicts cloud spending corresponds with lower spending on traditional IT services. It includes saving on infrastructure outsourcing, contractors, systems integration, application outsourcing, technical consulting, etc. Showcasing this set of slides titled Operational Savings Due To Adoption Of Cloud Based Service Ppt Infographics Icons PDF. The topics addressed in these templates are Infrastructure Outsourcing Expenses, Traditional Services Reduced, Technical Consulting Expenses. All the content presented in this PPT design is completely editable. Download it and make adjustments in color, background, font etc. as per your unique business setting.
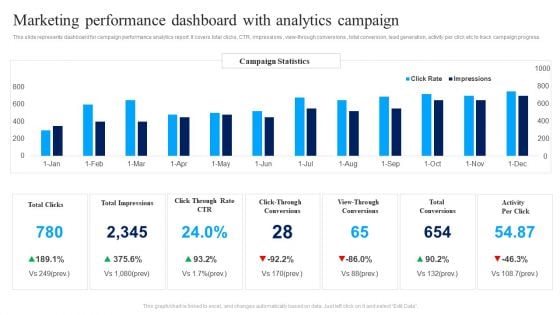
Marketing Performance Dashboard With Analytics Campaign Ppt Infographics Background Images PDF
This slide represents dashboard for campaign performance analytics report. It covers total clicks, CTR, impressions , view-through conversions , total conversion, lead generation, activity per click etc to track campaign progress. Showcasing this set of slides titled Marketing Performance Dashboard With Analytics Campaign Ppt Infographics Background Images PDF. The topics addressed in these templates are Total Clicks, Total Impressions, Total Conversions, Activity Per Click. All the content presented in this PPT design is completely editable. Download it and make adjustments in color, background, font etc. as per your unique business setting.
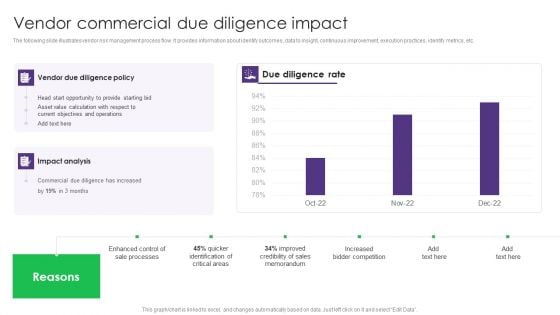
Vendor Commercial Due Diligence Impact Vendor Management System Deployment Infographics PDF
The following slide illustrates vendor risk management process flow. It provides information about identify outcomes, data to insight, continuous improvement, execution practices, identify metrics, etc. The Vendor Commercial Due Diligence Impact Vendor Management System Deployment Infographics PDF is a compilation of the most recent design trends as a series of slides. It is suitable for any subject or industry presentation, containing attractive visuals and photo spots for businesses to clearly express their messages. This template contains a variety of slides for the user to input data, such as structures to contrast two elements, bullet points, and slides for written information. Slidegeeks is prepared to create an impression.
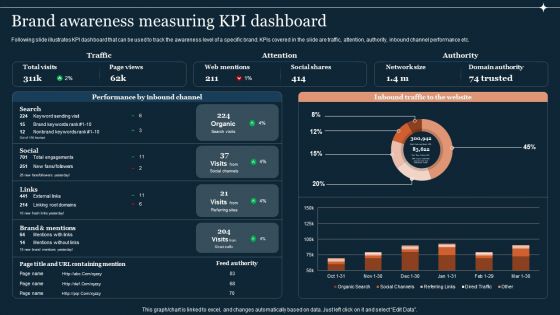
Guide To Develop And Estimate Brand Value Brand Awareness Measuring Kpi Dashboard Infographics PDF
Following slide illustrates KPI dashboard that can be used to track the awareness level of a specific brand. KPIs covered in the slide are traffic, attention, authority, inbound channel performance etc.From laying roadmaps to briefing everything in detail, our templates are perfect for you. You can set the stage with your presentation slides. All you have to do is download these easy-to-edit and customizable templates. Guide To Develop And Estimate Brand Value Brand Awareness Measuring Kpi Dashboard Infographics PDF will help you deliver an outstanding performance that everyone would remember and praise you for. Do download this presentation today.
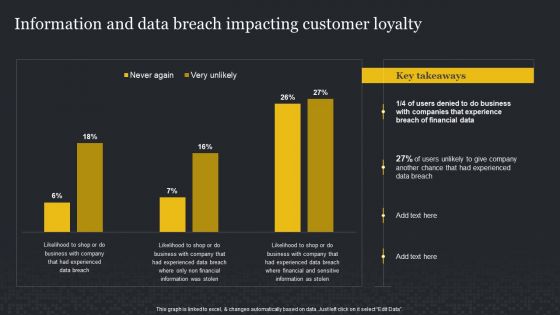
Information And Data Breach Impacting Customer Loyalty Cybersecurity Risk Assessment Infographics PDF
Retrieve professionally designed Information And Data Breach Impacting Customer Loyalty Cybersecurity Risk Assessment Infographics PDF to effectively convey your message and captivate your listeners. Save time by selecting pre-made slideshows that are appropriate for various topics, from business to educational purposes. These themes come in many different styles, from creative to corporate, and all of them are easily adjustable and can be edited quickly. Access them as PowerPoint templates or as Google Slides themes. You do not have to go on a hunt for the perfect presentation because Slidegeeks got you covered from everywhere.
Deploying Cloud Technology Cloud Dashboard For Tracking Project Sprints Ppt Infographics Brochure PDF
The following slide depicts cloud dashboard for monitoring project sprints. It provides information about sprint blockers, resolved issues, under performers, sprint health, releases, sprint burndown, etc. Boost your pitch with our creative Deploying Cloud Technology Cloud Dashboard For Tracking Project Sprints Ppt Infographics Brochure PDF. Deliver an awe-inspiring pitch that will mesmerize everyone. Using these presentation templates you will surely catch everyones attention. You can browse the ppts collection on our website. We have researchers who are experts at creating the right content for the templates. So you do not have to invest time in any additional work. Just grab the template now and use them.
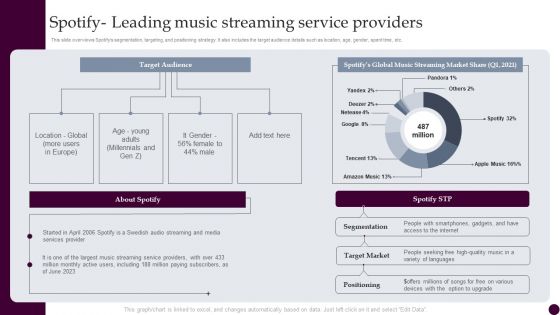
Spotify Leading Music Streaming Service Providers Strategies For Acquiring Consumers Infographics PDF
This slide overviews Spotifys segmentation, targeting, and positioning strategy. It also includes the target audience details such as location, age, gender, spent time, etc. Take your projects to the next level with our ultimate collection of Spotify Leading Music Streaming Service Providers Strategies For Acquiring Consumers Infographics PDF. Slidegeeks has designed a range of layouts that are perfect for representing task or activity duration, keeping track of all your deadlines at a glance. Tailor these designs to your exact needs and give them a truly corporate look with your own brand colors they well make your projects stand out from the rest.
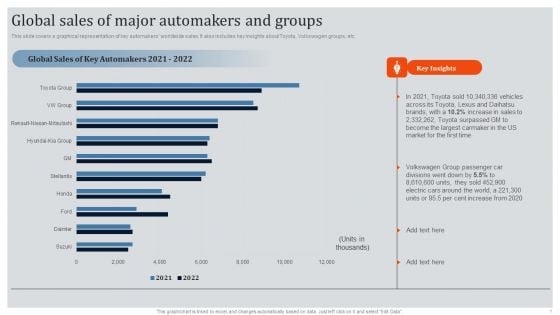
Global Automotive Industry Research And Analysis Global Sales Of Major Automakers And Groups Infographics PDF
This slide covers a graphical representation of key automakers worldwide sales. It also includes key insights about Toyota, Volkswagen groups, etc. The Global Automotive Industry Research And Analysis Global Sales Of Major Automakers And Groups Infographics PDF is a compilation of the most recent design trends as a series of slides. It is suitable for any subject or industry presentation, containing attractive visuals and photo spots for businesses to clearly express their messages. This template contains a variety of slides for the user to input data, such as structures to contrast two elements, bullet points, and slides for written information. Slidegeeks is prepared to create an impression.
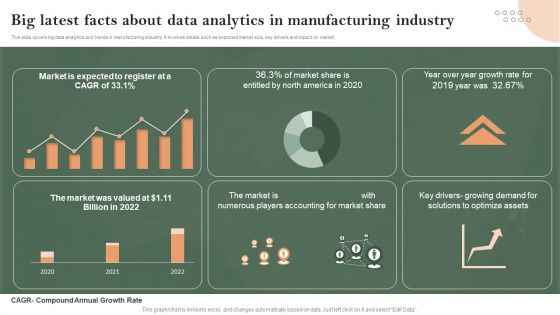
Big Latest Facts About Data Analytics In Manufacturing Industry Infographics PDF
This slide covers big data analytics and trends in manufacturing industry. It involves details such as expected market size, key drivers and impact on market. Pitch your topic with ease and precision using this Big Latest Facts About Data Analytics In Manufacturing Industry Infographics PDF. This layout presents information on Big Latest Facts, About Data Analytics, Manufacturing Industry. It is also available for immediate download and adjustment. So, changes can be made in the color, design, graphics or any other component to create a unique layout.
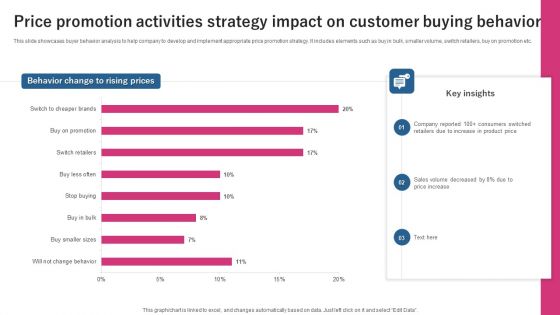
Price Promotion Activities Strategy Impact On Customer Buying Behavior Infographics PDF
This slide showcases buyer behavior analysis to help company to develop and implement appropriate price promotion strategy. It includes elements such as buy in bulk, smaller volume, switch retailers, buy on promotion etc. Showcasing this set of slides titled Price Promotion Activities Strategy Impact On Customer Buying Behavior Infographics PDF. The topics addressed in these templates are Behavior Change, Rising Prices, Key Insights. All the content presented in this PPT design is completely editable. Download it and make adjustments in color, background, font etc. as per your unique business setting.
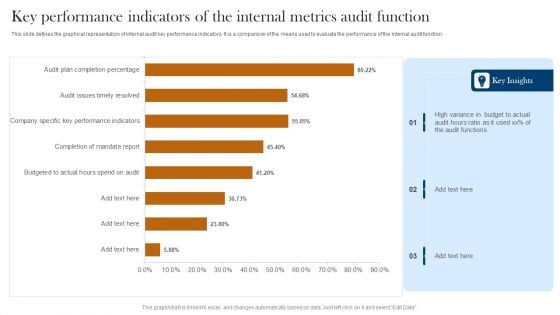
Key Performance Indicators Of The Internal Metrics Audit Function Infographics PDF
This slide defines the graphical representation of internal audit key performance indicators. It is a comparison of the means used to evaluate the performance of the internal audit function. Pitch your topic with ease and precision using this Key Performance Indicators Of The Internal Metrics Audit Function Infographics PDF. This layout presents information on High Variance, Budget To Actual, Audit Functions. It is also available for immediate download and adjustment. So, changes can be made in the color, design, graphics or any other component to create a unique layout.
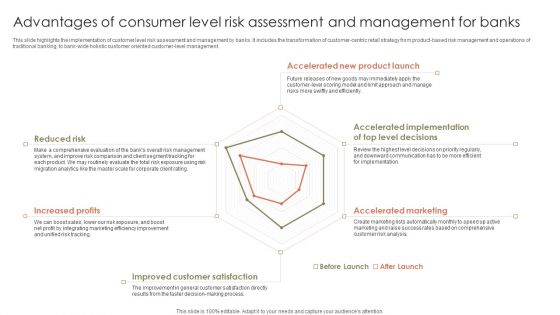
Advantages Of Consumer Level Risk Assessment And Management For Banks Infographics PDF
This slide highlights the implemention of customer level risk assessment and management by banks. it includes the transformation of customer centric retail strategy from product based risk management and operations of traditional banking to bank wide holistic customer oriented customer level management. Pitch your topic with ease and precision using this Advantages Of Consumer Level Risk Assessment And Management For Banks Infographics PDF. This layout presents information on Reduced Risk, Increased Profits, Accelerated Marketing. It is also available for immediate download and adjustment. So, changes can be made in the color, design, graphics or any other component to create a unique layout.
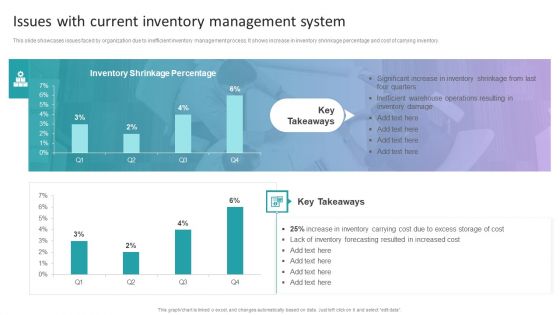
Stock Inventory Acquisition Issues With Current Inventory Management System Infographics PDF
This slide showcases issues faced by organization due to inefficient inventory management process. It shows increase in inventory shrinkage percentage and cost of carrying inventory. Slidegeeks is one of the best resources for PowerPoint templates. You can download easily and regulate Stock Inventory Acquisition Issues With Current Inventory Management System Infographics PDF for your personal presentations from our wonderful collection. A few clicks is all it takes to discover and get the most relevant and appropriate templates. Use our Templates to add a unique zing and appeal to your presentation and meetings. All the slides are easy to edit and you can use them even for advertisement purposes.
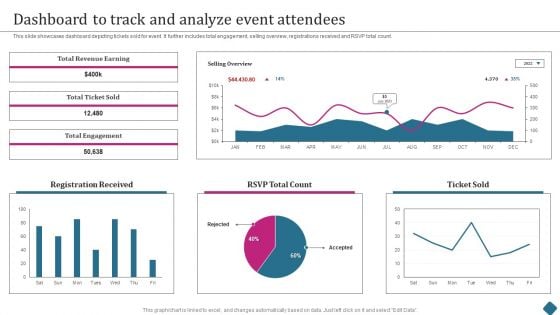
Smart Phone Launch Event Management Tasks Dashboard To Track And Analyze Event Attendees Infographics PDF
This slide showcases dashboard depicting tickets sold for event. It further includes total engagement, selling overview, registrations received and RSVP total count. Find a pre designed and impeccable Smart Phone Launch Event Management Tasks Dashboard To Track And Analyze Event Attendees Infographics PDF. The templates can ace your presentation without additional effort. You can download these easy to edit presentation templates to make your presentation stand out from others. So, what are you waiting for Download the template from Slidegeeks today and give a unique touch to your presentation.
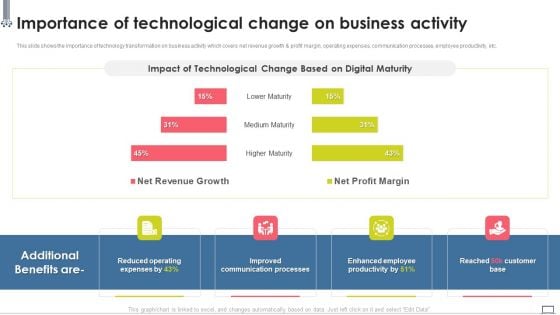
Change Management Strategy Importance Of Technological Change On Business Infographics PDF
This slide shows the importance of technology transformation on business activity which covers net revenue growth and profit margin, operating expenses, communication processes, employee productivity, etc. Find a pre-designed and impeccable Change Management Strategy Importance Of Technological Change On Business Infographics PDF. The templates can ace your presentation without additional effort. You can download these easy-to-edit presentation templates to make your presentation stand out from others. So, what are you waiting for Download the template from Slidegeeks today and give a unique touch to your presentation.
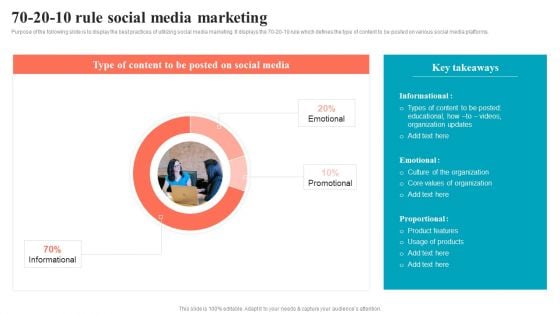
Brand Positioning Through Successful 70 20 10 Rule Social Media Marketing Infographics PDF
Purpose of the following slide is to display the best practices of utilizing social media marketing. It displays the 70 20 10 rule which defines the type of content to be posted on various social media platforms. Find a pre designed and impeccable Brand Positioning Through Successful 70 20 10 Rule Social Media Marketing Infographics PDF. The templates can ace your presentation without additional effort. You can download these easy to edit presentation templates to make your presentation stand out from others. So, what are you waiting for Download the template from Slidegeeks today and give a unique touch to your presentation.
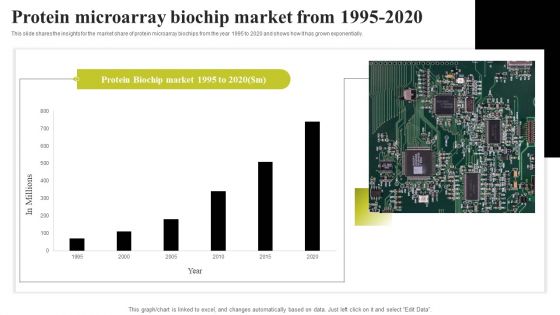
Biochip Technology Protein Microarray Biochip Market From 1995 2020 Infographics PDF
This slide shares the insights for the market share of protein microarray biochips from the year 1995 to 2020 and shows how it has grown exponentially. Make sure to capture your audiences attention in your business displays with our gratis customizable Biochip Technology Protein Microarray Biochip Market From 1995 2020 Infographics PDF. These are great for business strategies, office conferences, capital raising or task suggestions. If you desire to acquire more customers for your tech business and ensure they stay satisfied, create your own sales presentation with these plain slides.
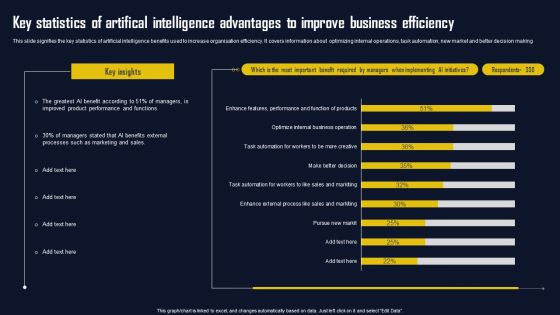
Key Statistics Of Artifical Intelligence Advantages To Improve Business Efficiency Infographics PDF
This slide signifies the key statistics of artificial intelligence benefits used to increase organisation efficiency. It covers information about optimizing internal operations, task automation, new market and better decision making Showcasing this set of slides titled Key Statistics Of Artifical Intelligence Advantages To Improve Business Efficiency Infographics PDF. The topics addressed in these templates are Greatest AI Benefit, Managers Stated, Benefits External Processes. All the content presented in this PPT design is completely editable. Download it and make adjustments in color, background, font etc. as per your unique business setting.
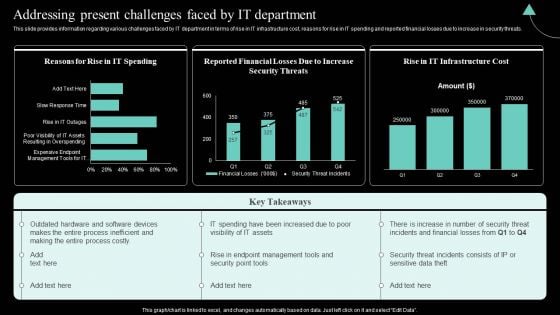
IT Cost Reduction Strategies Addressing Present Challenges Faced By IT Infographics PDF
This slide provides information regarding various challenges faced by IT department in terms of rise in IT infrastructure cost, reasons for rise in IT spending and reported financial losses due to increase in security threats. Boost your pitch with our creative IT Cost Reduction Strategies Addressing Present Challenges Faced By IT Infographics PDF. Deliver an awe-inspiring pitch that will mesmerize everyone. Using these presentation templates you will surely catch everyones attention. You can browse the ppts collection on our website. We have researchers who are experts at creating the right content for the templates. So you dont have to invest time in any additional work. Just grab the template now and use them.
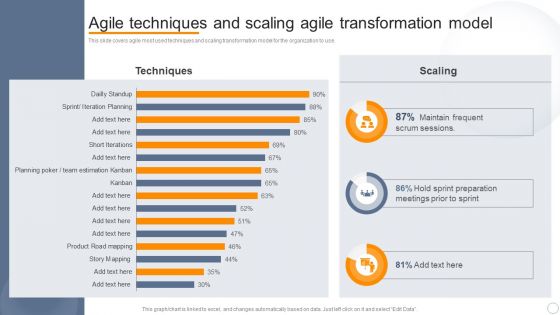
Agile Virtual Project Management Agile Techniques And Scaling Agile Infographics PDF
This slide covers agile most used techniques and scaling transformation model for the organization to use. Slidegeeks is here to make your presentations a breeze with Agile Virtual Project Management Agile Techniques And Scaling Agile Infographics PDF With our easy-to-use and customizable templates, you can focus on delivering your ideas rather than worrying about formatting. With a variety of designs to choose from, youre sure to find one that suits your needs. And with animations and unique photos, illustrations, and fonts, you can make your presentation pop. So whether youre giving a sales pitch or presenting to the board, make sure to check out Slidegeeks first.
Actual Time Marketing Challenges In Using Social Data Ppt PowerPoint Presentation Icon Infographics PDF
The slide inculcates a survey highlighting various barriers in real-time marketing for using social data to increase customer engagement. Various challenges included are inadequate budget, inappropriate skills, limited search analytical tools, etc. Pitch your topic with ease and precision using this Actual Time Marketing Challenges In Using Social Data Ppt PowerPoint Presentation Icon Infographics PDF. This layout presents information on Inadequate Budget, Inappropriate Skills, Limited Staff Abilities, Quick Responses. It is also available for immediate download and adjustment. So, changes can be made in the color, design, graphics or any other component to create a unique layout.

Expense Incurred On Digital And Offline Marketing Promotion Ppt Slides Infographics PDF
This slide showcases analysis of amount spent on online and offline marketing over the years. The following bar graph shows expense spent on advertising through online channels increased as it has proved more to be more effective. Showcasing this set of slides titled Expense Incurred On Digital And Offline Marketing Promotion Ppt Slides Infographics PDF. The topics addressed in these templates are Growth, Online Product Promotion, 2018 To 2023. All the content presented in this PPT design is completely editable. Download it and make adjustments in color, background, font etc. as per your unique business setting.
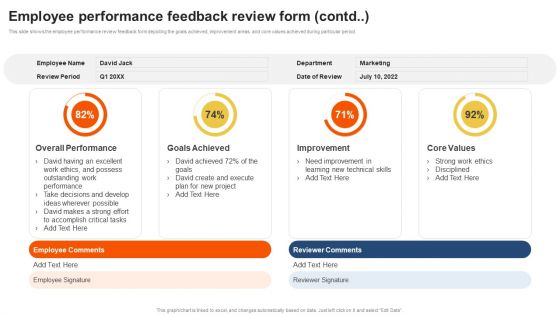
Staff Performance Evaluation Process Employee Performance Feedback Review Form Contd Infographics PDF
This slide shows the employee performance review feedback form depicting the goals achieved, improvement areas and core values achieved during particular period. From laying roadmaps to briefing everything in detail, our templates are perfect for you. You can set the stage with your presentation slides. All you have to do is download these easy to edit and customizable templates. Staff Performance Evaluation Process Employee Performance Feedback Review Form Contd Infographics PDF will help you deliver an outstanding performance that everyone would remember and praise you for. Do download this presentation today.
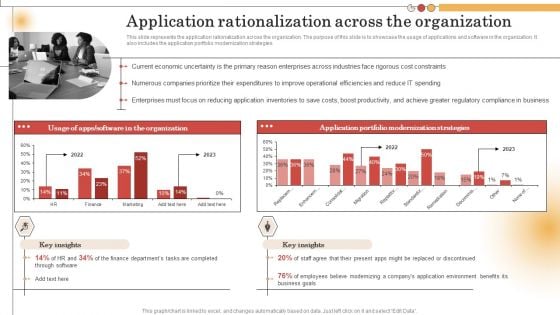
IT Alignment For Strategic Application Rationalization Across The Organization Infographics PDF
This slide represents the application rationalization across the organization. The purpose of this slide is to showcase the usage of applications and software in the organization. It also includes the application portfolio modernization strategies. Boost your pitch with our creative IT Alignment For Strategic Application Rationalization Across The Organization Infographics PDF. Deliver an awe-inspiring pitch that will mesmerize everyone. Using these presentation templates you will surely catch everyones attention. You can browse the ppts collection on our website. We have researchers who are experts at creating the right content for the templates. So you do not have to invest time in any additional work. Just grab the template now and use them.
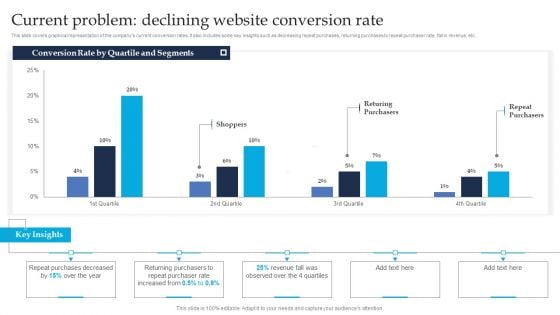
Retargeting Strategies To Improve Sales Current Problem Declining Website Conversion Rate Infographics PDF
This slide covers graphical representation of the companys current conversion rates. It also includes some key insights such as decreasing repeat purchases, returning purchases to repeat purchaser rate, fall in revenue, etc. Boost your pitch with our creative Retargeting Strategies To Improve Sales Current Problem Declining Website Conversion Rate Infographics PDF. Deliver an awe-inspiring pitch that will mesmerize everyone. Using these presentation templates you will surely catch everyones attention. You can browse the ppts collection on our website. We have researchers who are experts at creating the right content for the templates. So you do not have to invest time in any additional work. Just grab the template now and use them.
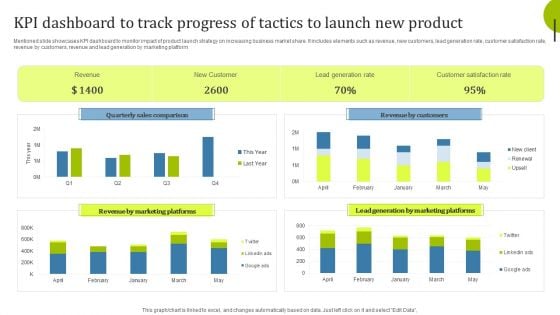
Kpi Dashboard To Track Progress Of Tactics To Launch New Product Infographics PDF
Mentioned slide showcases KPI dashboard to monitor impact of product launch strategy on increasing business market share. It includes elements such as revenue, new customers, lead generation rate, customer satisfaction rate, revenue by customers, revenue and lead generation by marketing platform. Showcasing this set of slides titled Kpi Dashboard To Track Progress Of Tactics To Launch New Product Infographics PDF. The topics addressed in these templates are Quarterly Sales Comparison, Revenue Marketing, Revenue Customers. All the content presented in this PPT design is completely editable. Download it and make adjustments in color, background, font etc. as per your unique business setting.
Google Keyword Assessment KPI Dashboard For Tracking Improvement In Website Traffic Infographics PDF
Following slide demonstrates keyword analysis dashboard which can be used by business to track website traffic performance. It includes metrics such as average keyword position, keyword ranking distribution, keyword ranking, keyword in top 3, top 10, top 20 and top 100. Showcasing this set of slides titled Google Keyword Assessment KPI Dashboard For Tracking Improvement In Website Traffic Infographics PDF. The topics addressed in these templates are Keyword Ranking, Keyword Ranking Distribution, Average Keyword Position. All the content presented in this PPT design is completely editable. Download it and make adjustments in color, background, font etc. as per your unique business setting.
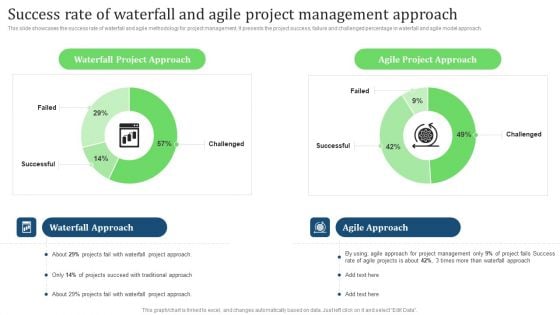
Success Rate Of Waterfall And Agile Project Management Approach Infographics PDF
This slide showcases the success rate of waterfall and agile methodology for project management. It presents the project success, failure and challenged percentage in waterfall and agile model approach. If your project calls for a presentation, then Slidegeeks is your go-to partner because we have professionally designed, easy-to-edit templates that are perfect for any presentation. After downloading, you can easily edit Success Rate Of Waterfall And Agile Project Management Approach Infographics PDF and make the changes accordingly. You can rearrange slides or fill them with different images. Check out all the handy templates


 Continue with Email

 Home
Home


