Agenda Infographic
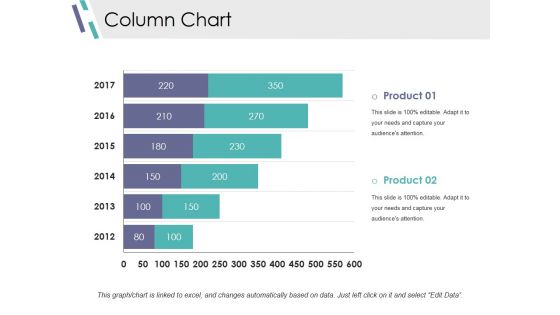
Column Chart Ppt PowerPoint Presentation Infographics Design Inspiration
This is a column chart ppt powerpoint presentation infographics design inspiration. This is a two stage process. The stages in this process are slide bar, marketing, strategy, finance, planning.
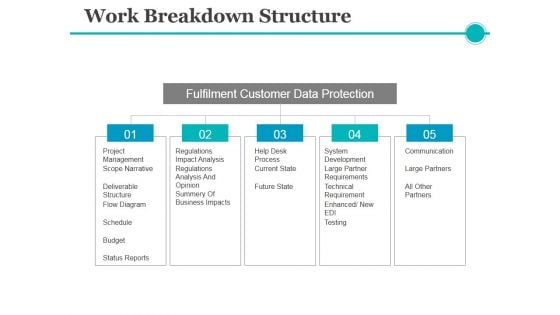
Work Breakdown Structure Ppt PowerPoint Presentation Infographics Skills
This is a work breakdown structure ppt powerpoint presentation infographics skills. This is a five stage process. The stages in this process are communication, large partners, future state, schedule, budget.
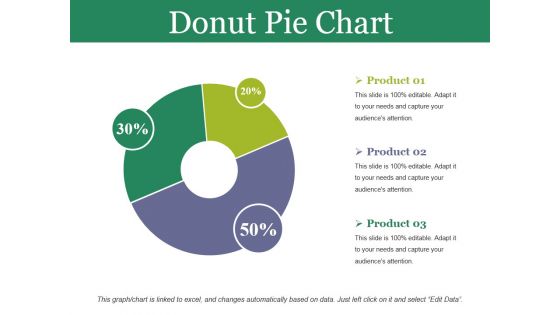
Donut Pie Chart Ppt PowerPoint Presentation Infographics Design Inspiration
This is a donut pie chart ppt powerpoint presentation infographics design inspiration. This is a three stage process. The stages in this process are donut pie chart, business, marketing, strategy, planning.

Donut Pie Chart Ppt PowerPoint Presentation Infographics Outfit
This is a donut pie chart ppt powerpoint presentation infographics outfit. This is a three stage process. The stages in this process are business, strategy, analysis, planning, dashboard, finance.
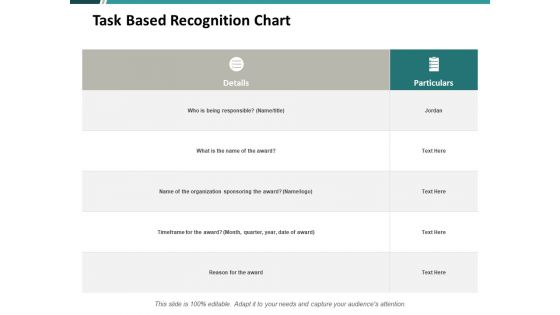
Task Based Recognition Chart Ppt PowerPoint Presentation Infographics Pictures
This is a task based recognition chart ppt powerpoint presentation infographics pictures. This is a three stage process. The stages in this process are compare, marketing, business, management, planning.
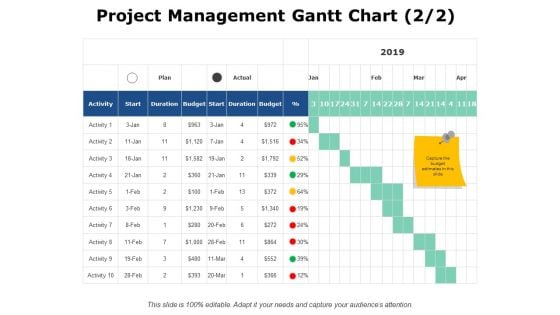
Project Management Gantt Chart Finance Ppt PowerPoint Presentation Infographics Files
This is a project management gantt chart finance ppt powerpoint presentation infographics files. This is a six stage process. The stages in this process are business, planning, strategy, marketing, management.
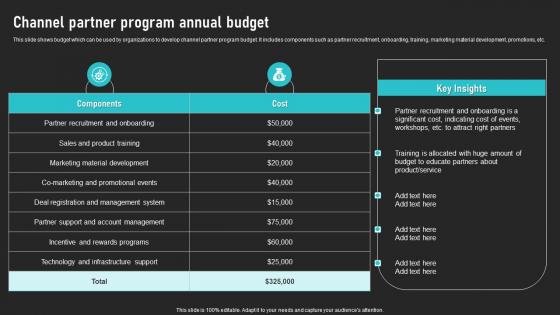
Channel Partner Program Annual Budget Cooperative Sales Tactics Infographics Pdf
This slide shows budget which can be used by organizations to develop channel partner program budget. It includes components such as partner recruitment, onboarding, training, marketing material development, promotions, etc. Coming up with a presentation necessitates that the majority of the effort goes into the content and the message you intend to convey. The visuals of a PowerPoint presentation can only be effective if it supplements and supports the story that is being told. Keeping this in mind our experts created Channel Partner Program Annual Budget Cooperative Sales Tactics Infographics Pdf to reduce the time that goes into designing the presentation. This way, you can concentrate on the message while our designers take care of providing you with the right template for the situation. This slide shows budget which can be used by organizations to develop channel partner program budget. It includes components such as partner recruitment, onboarding, training, marketing material development, promotions, etc.
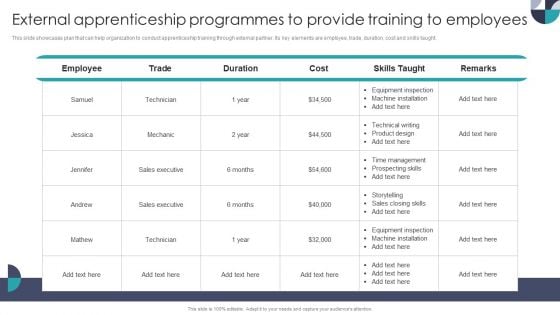
External Apprenticeship Programmes To Provide Training To Employees Infographics PDF
This slide showcases plan that can help organization to conduct apprenticeship training through external partner. Its key elements are employee, trade, duration, cost and skills taught. There are so many reasons you need a External Apprenticeship Programmes To Provide Training To Employees Infographics PDF. The first reason is you can not spend time making everything from scratch, Thus, Slidegeeks has made presentation templates for you too. You can easily download these templates from our website easily.
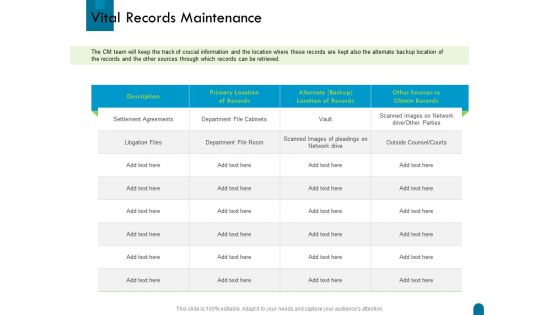
Crisis Management Vital Records Maintenance Ppt Infographics Portfolio PDF
Deliver an awe-inspiring pitch with this creative crisis management vital records maintenance ppt infographics portfolio pdf bundle. Topics like description, primary location of records, alternate, other sources to obtain records can be discussed with this completely editable template. It is available for immediate download depending on the needs and requirements of the user.

Steps Of Customer Onboarding Process Schedule Infographics PDF
This slide showcases steps involved in user onboarding and their status. The steps covered are brand awareness, initial contact, welcome email, first login, feature promotion, product walkthrough, regular updates and progress tracking. Get a simple yet stunning designed Steps Of Customer Onboarding Process Schedule Infographics PDF. It is the best one to establish the tone in your meetings. It is an excellent way to make your presentations highly effective. So, download this PPT today from Slidegeeks and see the positive impacts. Our easy to edit Steps Of Customer Onboarding Process Schedule Infographics PDF can be your go to option for all upcoming conferences and meetings. So, what are you waiting for Grab this template today.
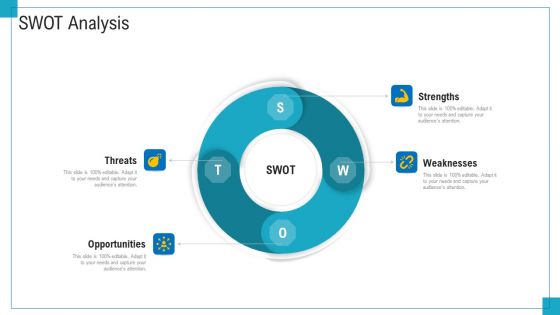
Program And PME SWOT Analysis Ppt Outline Infographics PDF
Presenting program and PME SWOT analysis ppt outline infographics pdf to provide visual cues and insights. Share and navigate important information on four stages that need your due attention. This template can be used to pitch topics like threats, opportunities, weaknesses, strengths. In addtion, this PPT design contains high resolution images, graphics, etc, that are easily editable and available for immediate download.

Table Of Contents Strategic Brand Playbook Rules Infographics PDF
Do you have to make sure that everyone on your team knows about any specific topic I yes, then you should give Table Of Contents Strategic Brand Playbook Rules Infographics PDF a try. Our experts have put a lot of knowledge and effort into creating this impeccable Table Of Contents Strategic Brand Playbook Rules Infographics PDF. You can use this template for your upcoming presentations, as the slides are perfect to represent even the tiniest detail. You can download these templates from the Slidegeeks website and these are easy to edit. So grab these today
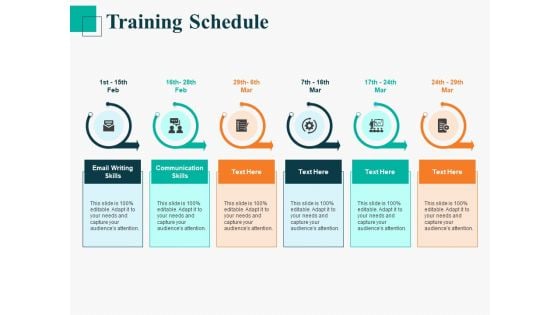
Human Capital Management Procedure Training Schedule Ppt Infographics PDF
This is a human capital management procedure training schedule ppt infographics pdf template with various stages. Focus and dispense information on six stages using this creative set, that comes with editable features. It contains large content boxes to add your information on topics like email writing skills, communication skills. You can also showcase facts, figures, and other relevant content using this PPT layout. Grab it now.
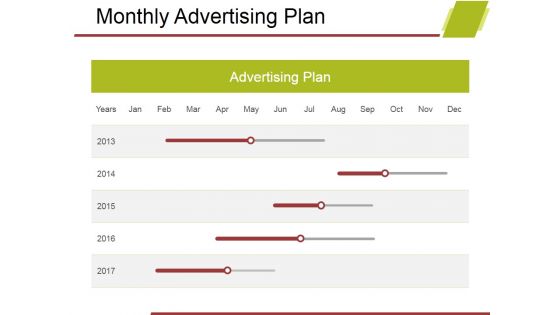
Monthly Advertising Plan Ppt PowerPoint Presentation Infographics Pictures
This is a monthly advertising plan ppt powerpoint presentation infographics pictures. This is a five stage process. The stages in this process are advertising plan, business, marketing, planning, management.
Business Planning Vector Icon Ppt PowerPoint Presentation Infographics Graphics Tutorials
This is a business planning vector icon ppt powerpoint presentation infographics graphics tutorials. This is a four stage process. The stages in this process are business development, corporate development.
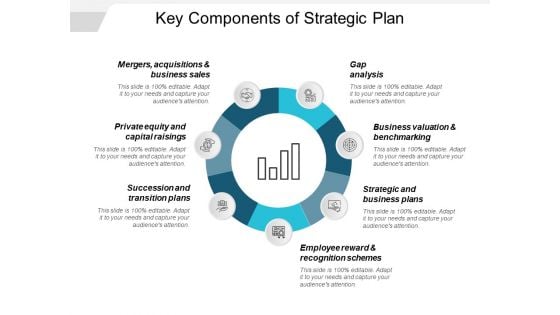
Key Components Of Strategic Plan Ppt PowerPoint Presentation Infographics Examples
This is a key components of strategic plan ppt powerpoint presentation infographics examples. This is a seven stage process. The stages in this process are due diligence, value gap analysis, value maximization process.
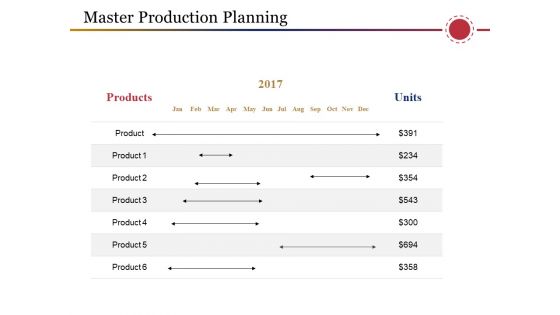
Master Production Planning Template 1 Ppt PowerPoint Presentation Infographics Tips
This is a master production planning template 1 ppt powerpoint presentation infographics tips. This is a two stage process. The stages in this process are products, units, years, business, planning.
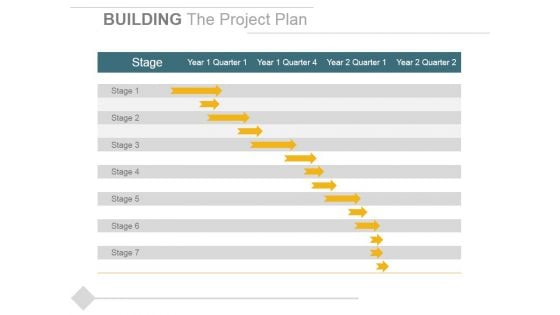
Building The Project Plan Ppt PowerPoint Presentation Infographics Example File
This is a building the project plan ppt powerpoint presentation infographics example file. This is a two stage process. The stages in this process are arrows, business, marketing, success, strategy.

Risk Assessment Plan Ppt PowerPoint Presentation Infographics Designs Download
This is a risk assessment plan ppt powerpoint presentation infographics designs download. This is a seven stage process. The stages in this process are activity steps, potential hazards risks, risk rating, risk control measures, risk rating.

Organizations Departments Structure Chart Ppt PowerPoint Presentation Infographics Slide Portrait
This is a organizations departments structure chart ppt powerpoint presentation infographics slide portrait. This is a six stage process. The stages in this process are flow chart, org chart, hierarchy chart.

Pilot Program Plan For Software Development Infographics PDF
This slide mentions the pilot program plan to be implemented while taking up software development activities for clients. The activities include project initiation meeting, feasibility study and client meeting. Showcasing this set of slides titled Pilot Program Plan For Software Development Infographics PDF. The topics addressed in these templates are Implementation Strategy, Determining Appropriate, Financing Schemes. All the content presented in this PPT design is completely editable. Download it and make adjustments in color, background, font etc. as per your unique business setting.
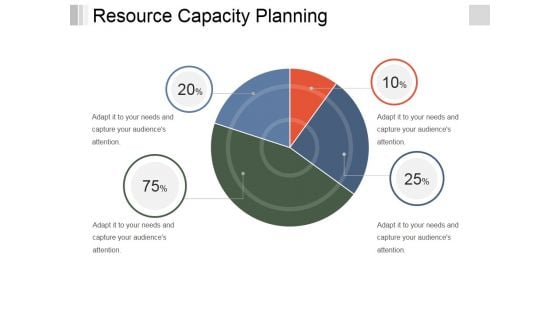
Resource Capacity Planning Template 1 Ppt PowerPoint Presentation Infographics Topics
This is a resource capacity planning template 1 ppt powerpoint presentation infographics topics. This is a four stage process. The stages in this process are business, pie, planning, process, marketing, strategy.
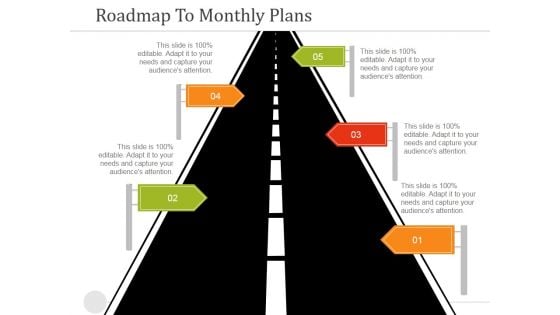
Roadmap To Monthly Plans Ppt PowerPoint Presentation Infographics Show
This is a roadmap to monthly plans ppt powerpoint presentation infographics show. This is a five stage process. The stages in this process are roadmap to monthly plans, business, marketing, success, strategy.
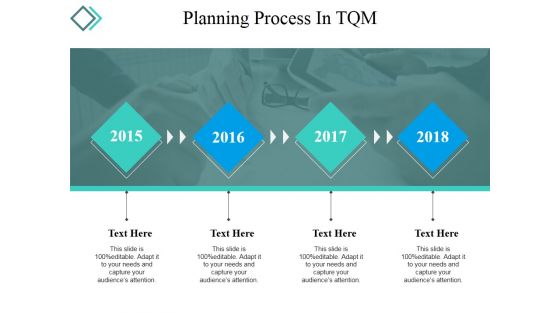
Planning Process In Tqm Ppt PowerPoint Presentation Infographics Template
This is a planning process in tqm ppt powerpoint presentation infographics template. This is a four stage process. The stages in this process are year, growth, success, time planning, business.
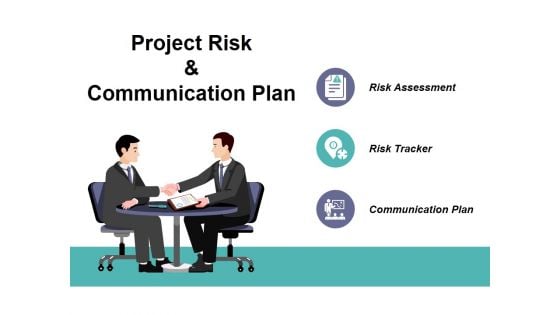
Project Risk And Communication Plan Ppt PowerPoint Presentation Infographics Themes
This is a project risk and communication plan ppt powerpoint presentation infographics themes. This is a three stage process. The stages in this process are risk assessment, risk tracker, communication plan.

Planning Process In TQM Ppt PowerPoint Presentation Infographics Graphics
This is a planning process in tqm ppt powerpoint presentation infographics graphics. This is a seven stage process. The stages in this process are year, growth, success, time planning, business.
Event Planning Guide With Icons Ppt PowerPoint Presentation Infographics Ideas
This is a event planning guide with icons ppt powerpoint presentation infographics ideas. This is a four stage process. The stages in this process are project management, event management, event planning.
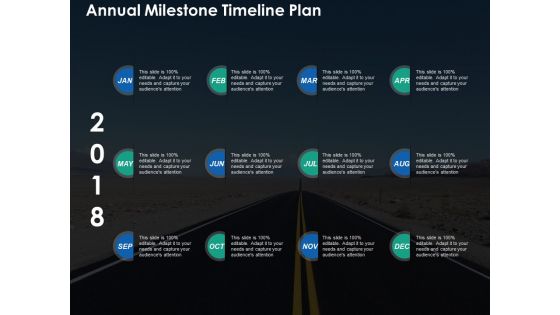
Annual Milestone Timeline Plan Management Ppt PowerPoint Presentation Infographics Graphics
This is a annual milestone timeline plan management ppt powerpoint presentation infographics graphics. This is a Twelve stage process. The stages in this process are annual milestone, timeline plan, time table, time management.
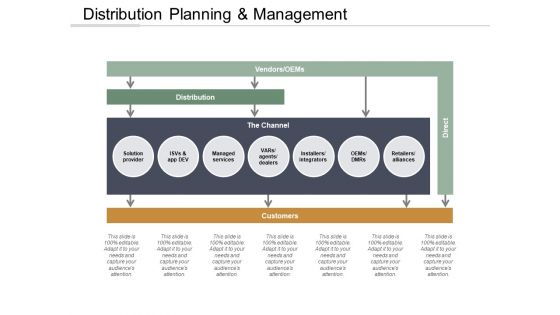
Distribution Planning And Management Ppt PowerPoint Presentation Infographics Graphics
This is a distribution planning and management ppt powerpoint presentation infographics graphics. This is a four stage process. The stages in this process are marketing communication plan, marketing communication, marketing communication strategy.
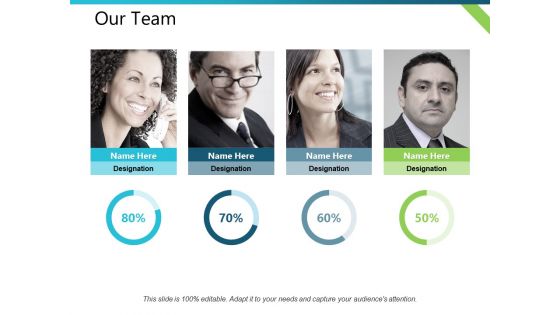
Our Team Distribution Plan Ppt PowerPoint Presentation Infographics Portrait
This is a our team distribution plan ppt powerpoint presentation infographics portrait. This is a four stage process. The stages in this process are business, management, planning, analysis, strategy.
Risk Item Tracking Inadequate Planning Ppt PowerPoint Presentation Infographics Brochure
This is a risk item tracking inadequate planning ppt powerpoint presentation infographics brochure. This is a three stage process. The stages in this process are inadequate planning, absence of leadership, poor time estimates.
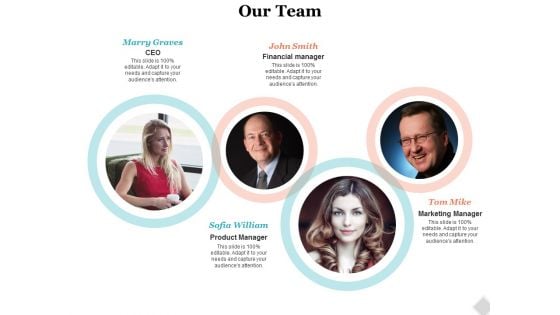
Our Team Communication Process Planning Ppt PowerPoint Presentation Infographics Summary
This is a our team communication process planning ppt powerpoint presentation infographics summary. This is a four stage process. The stages in this process are our team, communication, management, planning, business.
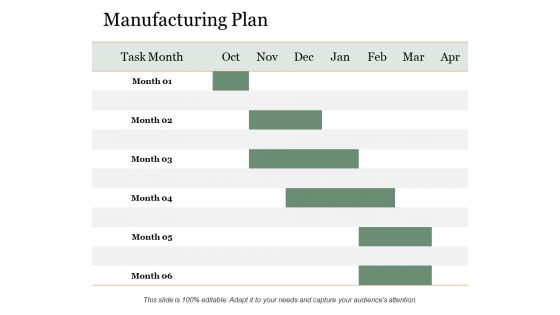
Manufacturing Plan Ppt PowerPoint Presentation Infographics Graphic Tips
This is a manufacturing plan ppt powerpoint presentation infographics graphic tips. This is a six stage process. The stages in this process are manufacturing plan, month, business, marketing, analysis.
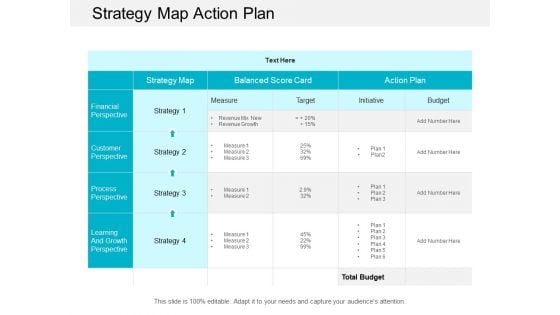
Strategy Map Action Plan Ppt Powerpoint Presentation Infographics Example File
This is a strategy map action plan ppt powerpoint presentation infographics example file. This is a three stage process. The stages in this process are change strategy, change plan, change approach.
Disaster Recovery Planning Checklist Ppt Powerpoint Presentation Infographics Model Cpb
This is a disaster recovery planning checklist ppt powerpoint presentation infographics model cpb. This is a three stage process. The stages in this process are disaster recovery planning checklist.
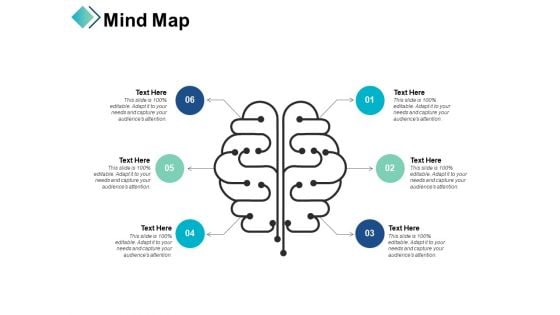
Mind Map Business Planning Ppt PowerPoint Presentation Infographics Deck
This is a mind map business planning ppt powerpoint presentation infographics deck. This is a six stage process. The stages in this process are business, marketing, management, strategy, planning.
Autonomation Icons Slide Planning Ppt PowerPoint Presentation Infographics Mockup
This is a autonomation icons slide planning ppt powerpoint presentation infographics mockup. This is a nine stage process. The stages in this process are business, planning, strategy, marketing, management.
B2B Sales Productivity Plan Ppt PowerPoint Presentation Infographics Shapes Cpb
This is a b2b sales productivity plan ppt powerpoint presentation infographics shapes cpb. This is a two stage process. The stages in this process are b2b sales productivity plan.
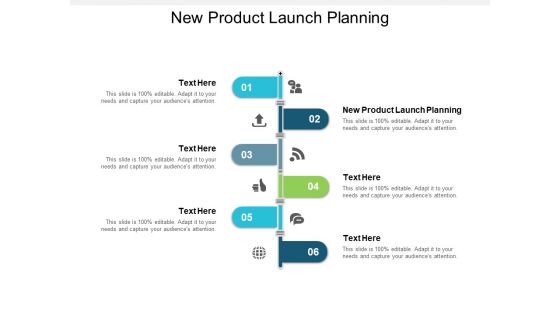
New Product Launch Planning Ppt PowerPoint Presentation Inspiration Infographics Cpb
This is a new product launch planning ppt powerpoint presentation inspiration infographics cpb. This is a six stage process. The stages in this process are new product launch planning.
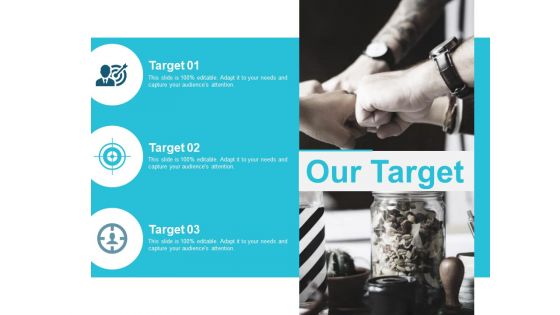
Our Target Planning Ppt PowerPoint Presentation Infographics Graphics Pictures
This is a our target planning ppt powerpoint presentation infographics graphics pictures. This is a three stage process. The stages in this process are our goal, arrow, business, planning, management.

Digital Marketing Budget Plan Ppt PowerPoint Presentation Infographics Deck Cpb
This is a digital marketing budget plan ppt powerpoint presentation infographics deck cpb. This is a six stage process. The stages in this process are digital marketing budget plan.
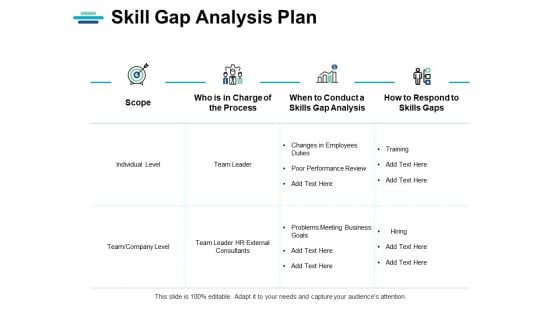
Skill Gap Analysis Plan Ppt PowerPoint Presentation Infographics Examples
This is a skill gap analysis plan ppt powerpoint presentation infographics examples. This is a four stage process. The stages in this process are compare, marketing, business, management, planning.
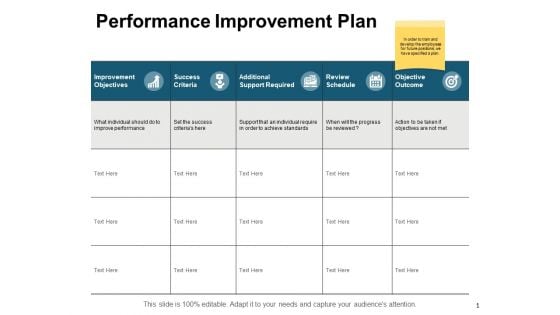
Performance Improvement Plan Ppt PowerPoint Presentation Infographics Microsoft
This is a performance improvement plan ppt powerpoint presentation infographics microsoft. The topics discussed in this diagram are marketing, business, management, planning, strategy This is a completely editable PowerPoint presentation, and is available for immediate download.
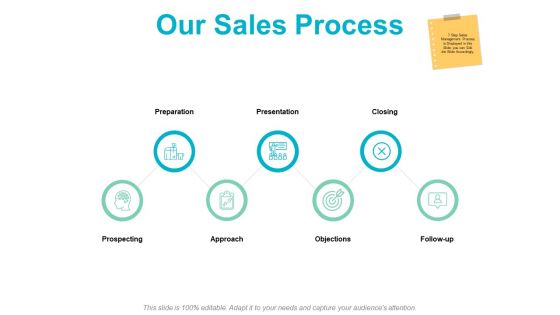
Our Sales Process Planning Ppt PowerPoint Presentation Infographics Backgrounds
This is a our sales process planning ppt powerpoint presentation infographics backgrounds. This is a seven stage process. The stages in this process are marketing, business, management, planning, strategy.
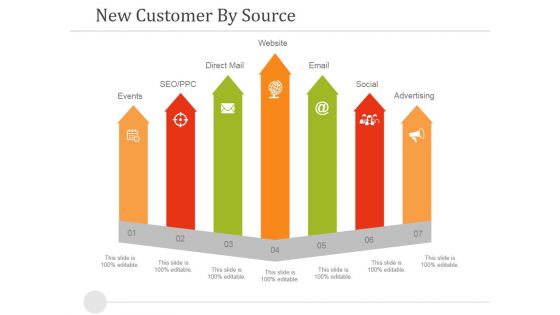
New Customer By Source Ppt PowerPoint Presentation Infographics Outline
This is a new customer by source ppt powerpoint presentation infographics outline. This is a seven stage process. The stages in this process are events, seo ppc, direct mail, website, email, social, advertising.
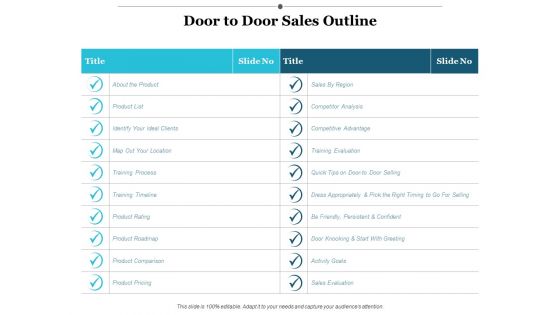
Door To Door Sales Outline Ppt PowerPoint Presentation Infographics Grid
This is a door to door sales outline ppt powerpoint presentation infographics grid. This is a two stage process. The stages in this process are competitive advantage, training evaluation, activity goals, sales evaluation, competitor analysis.

Omnichannel Ecommerce Marketing Strategies Ppt PowerPoint Presentation Infographics Outline
This is a omnichannel ecommerce marketing strategies ppt powerpoint presentation infographics outline. This is a three stage process. The stages in this process are multi channel marketing, multi channel promotion, multi channel branding.
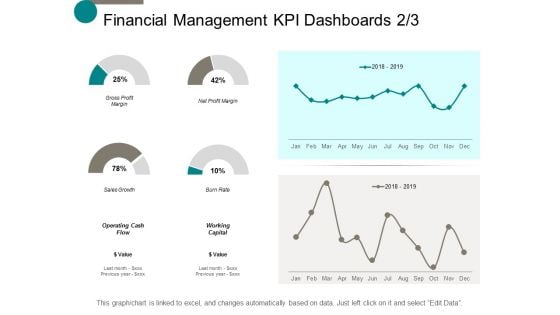
Financial Management Kpi Dashboards Marketing Ppt Powerpoint Presentation Infographics Outline
This is a financial management kpi dashboards marketing ppt powerpoint presentation infographics outline. This is a six stage process. The stages in this process are finance, marketing, management, investment, analysis.
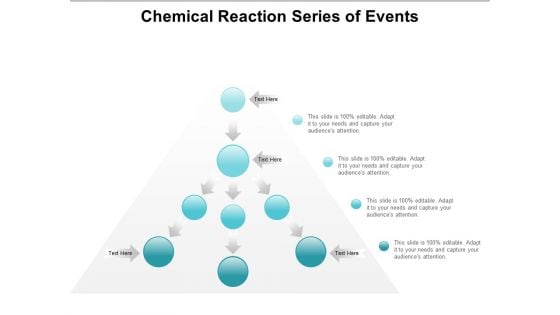
Chemical Reaction Series Of Events Ppt Powerpoint Presentation Infographics Outline
This is a chemical reaction series of events ppt powerpoint presentation infographics outline. This is a four stage process. The stages in this process are domino effect, cause and effect, chain reaction.

Project Management Budget Design Business Ppt PowerPoint Presentation Infographics Outline
This is a project management budget design business ppt powerpoint presentation infographics outline. This is a four stage process. The stages in this process are business, management, marketing, compare.
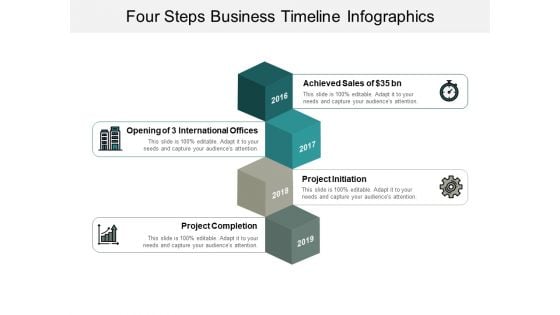
Four Steps Business Timeline Infographics Ppt Powerpoint Presentation Outline
This is a four steps business timeline infographics ppt powerpoint presentation outline. This is a four stage process. The stages in this process are block timeline, block roadmap, block linear process.

Radar Chart Template 1 Ppt PowerPoint Presentation Infographics Designs
This is a radar chart template 1 ppt powerpoint presentation infographics designs. This is a two stage process. The stages in this process are business, strategy, analysis, pretention, radar chart.
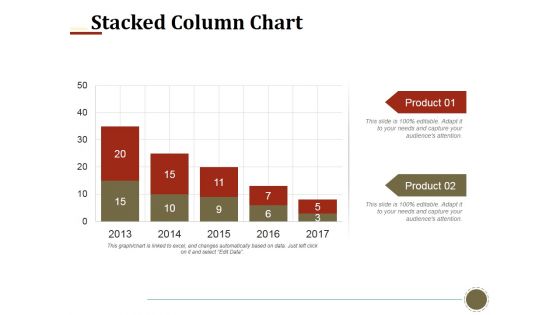
Stacked Column Chart Ppt PowerPoint Presentation Infographics Smartart
This is a stacked column chart ppt powerpoint presentation infographics smartart. This is a two stage process. The stages in this process are stacked column chart, business, finance, marketing, strategy.
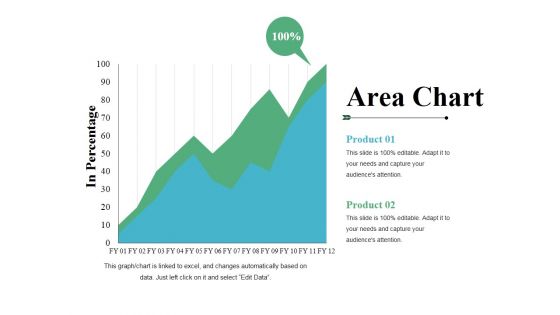
Area Chart Ppt PowerPoint Presentation Infographics Visual Aids
This is a area chart ppt powerpoint presentation infographics visual aids. This is a two stage process. The stages in this process are product, area chart, in percentage, growth, success.
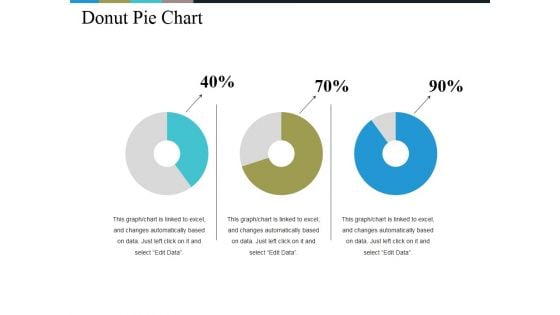
Donut Pie Chart Ppt PowerPoint Presentation Infographics Background Images
This is a donut pie chart ppt powerpoint presentation infographics background images. This is a three stage process. The stages in this process are chart, percentage, business, management, process.
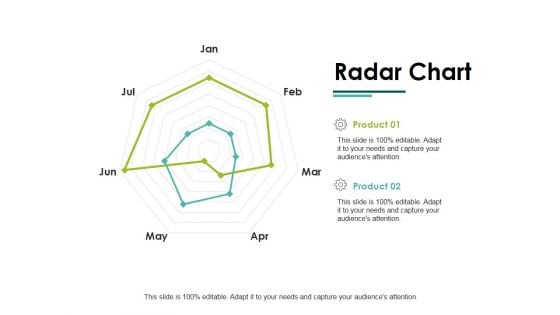
Radar Chart Ppt PowerPoint Presentation Infographics Slide Download
This is a radar chart ppt powerpoint presentation infographics slide download. This is a two stage process. The stages in this process are radar chart, finance, marketing, strategy, business.
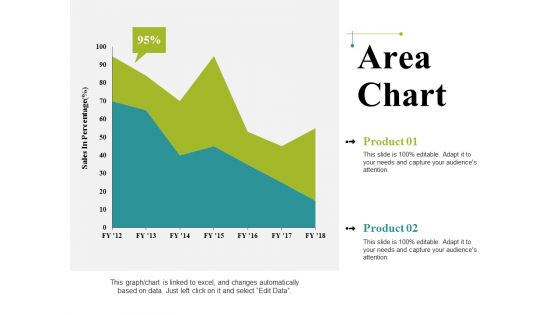
Area Chart Ppt PowerPoint Presentation Infographics Graphics Pictures
This is a area chart ppt powerpoint presentation infographics graphics pictures. This is a two stage process. The stages in this process are business, sales in percentage, area chart, marketing, graph.
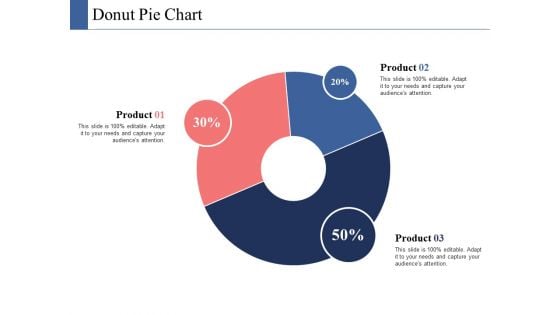
Donut Pie Chart Ppt PowerPoint Presentation Infographics Ideas
This is a donut pie chart ppt powerpoint presentation infographics ideas. This is a three stage process. The stages in this process are donut pie chart, finance, marketing, strategy, analysis.
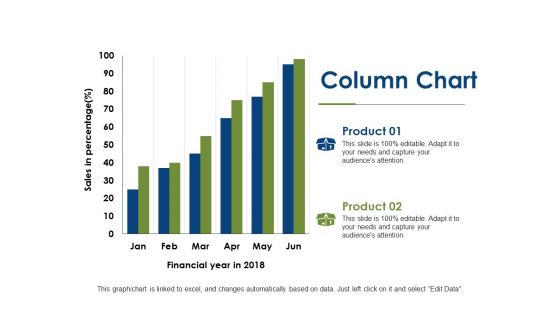
Column Chart Finance Ppt PowerPoint Presentation Infographics Backgrounds
This is a column chart finance ppt powerpoint presentation infographics backgrounds. This is a two stage process. The stages in this process are column chart, investment, marketing, finance, analysis.
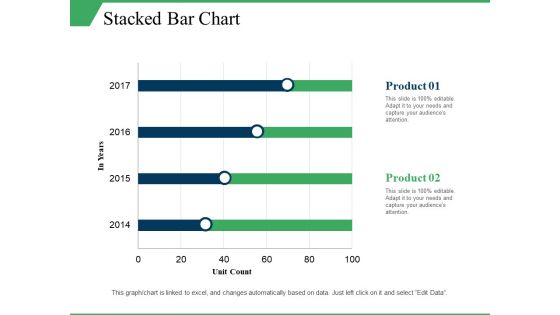
Stacked Bar Chart Ppt PowerPoint Presentation Infographics Elements
This is a stacked bar chart ppt powerpoint presentation infographics elements. This is a two stage process. The stages in this process are stacked bar chart, product, unit count, in year.


 Continue with Email

 Home
Home


