Agenda Infographic
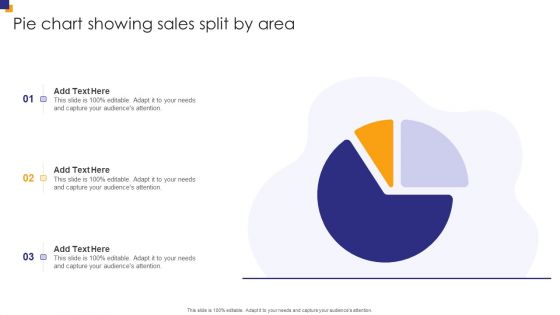
Pie Chart Showing Sales Split By Area Infographics PDF
Pitch your topic with ease and precision using this Pie Chart Showing Sales Split By Area Infographics PDF. This layout presents information on Pie Chart Showing, Sales Split Area. It is also available for immediate download and adjustment. So, changes can be made in the color, design, graphics or any other component to create a unique layout.
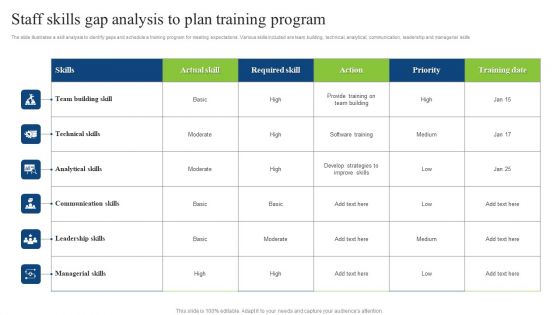
Staff Skills Gap Analysis To Plan Training Program Infographics PDF
The slide illustrates a skill analysis to identify gaps and schedule a training program for meeting expectations. Various skills included are team building, technical, analytical, communication, leadership and managerial skills. Showcasing this set of slides titled Staff Skills Gap Analysis To Plan Training Program Infographics PDF. The topics addressed in these templates are Actual Skill, Required Skill, Action. All the content presented in this PPT design is completely editable. Download it and make adjustments in color, background, font etc. as per your unique business setting.
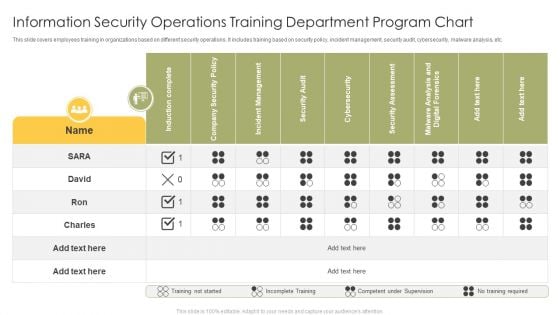
Information Security Operations Training Department Program Chart Infographics PDF
This slide covers employees training in organizations based on different security operations. It includes training based on security policy, incident management, security audit, cybersecurity, malware analysis, etc. Showcasing this set of slides titled Information Security Operations Training Department Program Chart Infographics PDF. The topics addressed in these templates are Induction Complete, Company Security Policy, Incident Management. All the content presented in this PPT design is completely editable. Download it and make adjustments in color, background, font etc. as per your unique business setting.
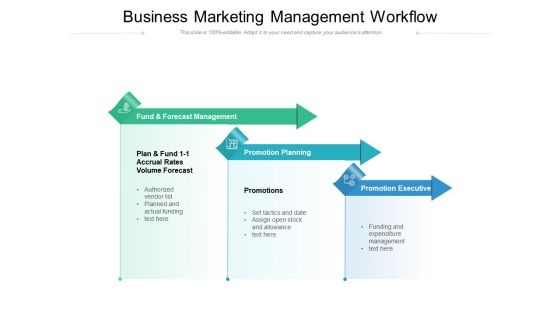
Business Marketing Management Workflow Ppt PowerPoint Presentation Infographics Portrait PDF
Presenting this set of slides with name business marketing management workflow ppt powerpoint presentation infographics portrait pdf. This is a three stage process. The stages in this process are fund and forecast management, promotion planning, promotion executive, funding and expenditure management, authorized vendor list. This is a completely editable PowerPoint presentation and is available for immediate download. Download now and impress your audience.
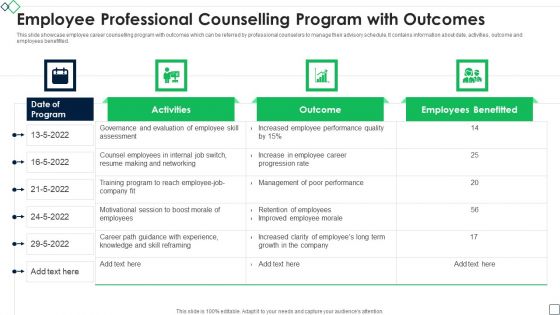
Employee Professional Counselling Program With Outcomes Infographics PDF
This slide showcase employee career counselling program with outcomes which can be referred by professional counselors to manage their advisory schedule. It contains information about date, activities, outcome and employees benefitted. Showcasing this set of slides titled Employee Professional Counselling Program With Outcomes Infographics PDF. The topics addressed in these templates are Activities, Outcome, Employees Benefitted. All the content presented in this PPT design is completely editable. Download it and make adjustments in color, background, font etc. as per your unique business setting.
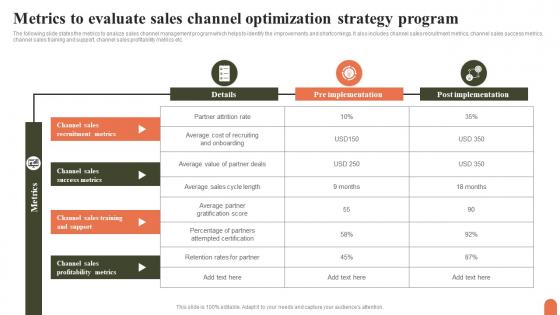
Metrics To Evaluate Sales Channel Optimization Strategy Program Infographics Pdf
The following slide states the metrics to analyze sales channel management program which helps to identify the improvements and shortcomings. It also includes channel sales recruitment metrics, channel sales success metrics, channel sales training and support, channel sales profitability metrics etc. Pitch your topic with ease and precision using this Metrics To Evaluate Sales Channel Optimization Strategy Program Infographics Pdf. This layout presents information on Channel Sales Success Metrics, Channel Sales Profitability Metrics, Channel Sales Recruitment Metrics. It is also available for immediate download and adjustment. So, changes can be made in the color, design, graphics or any other component to create a unique layout. The following slide states the metrics to analyze sales channel management program which helps to identify the improvements and shortcomings. It also includes channel sales recruitment metrics, channel sales success metrics, channel sales training and support, channel sales profitability metrics etc.
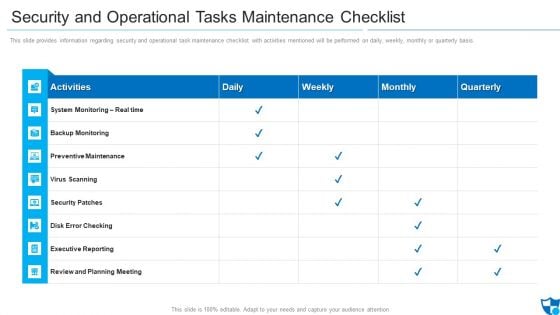
Security And Operational Tasks Maintenance Checklist Infographics PDF
This slide provides information regarding security and operational task maintenance checklist with activities mentioned will be performed on daily, weekly, monthly or quarterly basis.Deliver an awe inspiring pitch with this creative security and operational tasks maintenance checklist infographics pdf bundle. Topics like preventive maintenance, security patches, review and planning meeting can be discussed with this completely editable template. It is available for immediate download depending on the needs and requirements of the user.
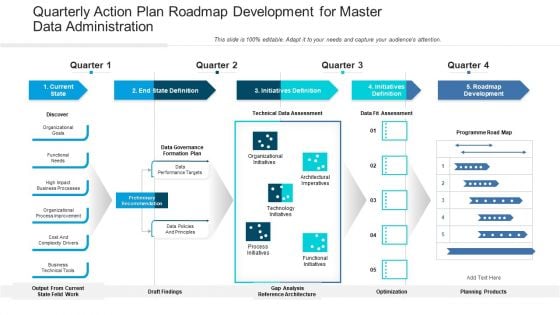
Quarterly Action Plan Roadmap Development For Master Data Administration Infographics
We present our quarterly action plan roadmap development for master data administration infographics. This PowerPoint layout is easy to edit so you can change the font size, font type, color, and shape conveniently. In addition to this, the PowerPoint layout is Google Slides compatible, so you can share it with your audience and give them access to edit it. Therefore, download and save this well researched quarterly action plan roadmap development for master data administration infographics in different formats like PDF, PNG, and JPG to smoothly execute your business plan.
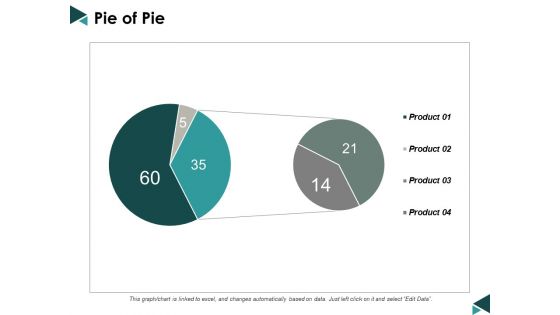
Pie Of Pie Ppt Powerpoint Presentation Infographics Layout Ideas
This is a pie of pie ppt powerpoint presentation infographics layout ideas. This is a four stage process. The stages in this process are pie chart, marketing, business, analysis, management.
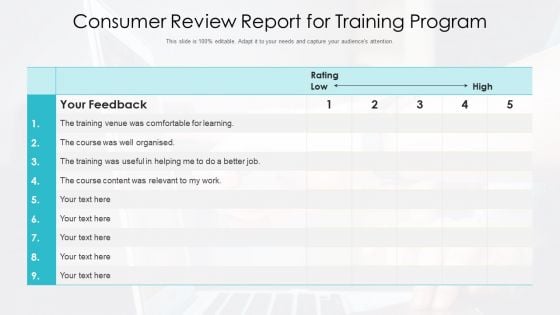
Consumer Review Report For Training Program Ppt Infographics Graphics PDF
Showcasing this set of slides titled consumer review report for training program ppt infographics graphics pdf. The topics addressed in these templates are consumer review report for training program. All the content presented in this PPT design is completely editable. Download it and make adjustments in color, background, font etc. as per your unique business setting.
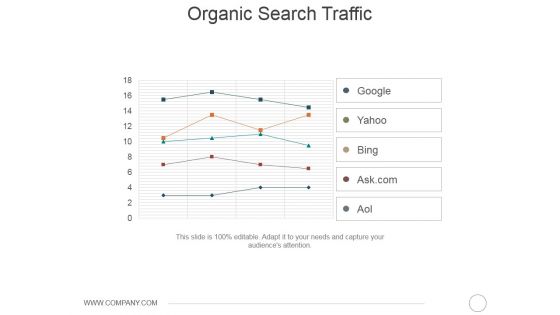
Organic Search Traffic Ppt PowerPoint Presentation Infographics Show
This is a organic search traffic ppt powerpoint presentation infographics show. This is a five stage process. The stages in this process are google, yahoo, bing, ask com, aol.
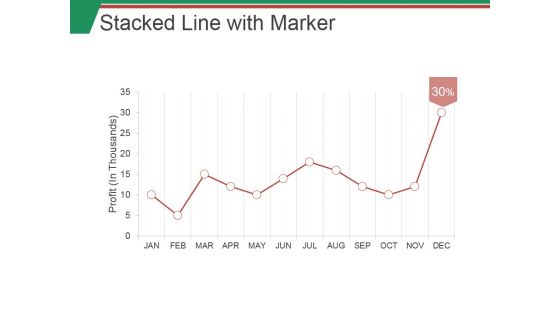
Stacked Line With Marker Ppt PowerPoint Presentation Infographics Images
This is a stacked line with marker ppt powerpoint presentation infographics images. This is a twelve stage process. The stages in this process are business, marketing, strategy, finance, success.
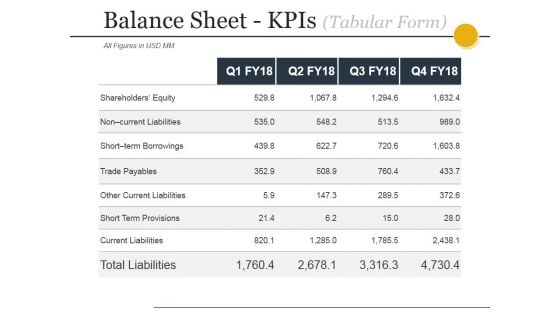
Balance Sheet Kpis Tabular Form Ppt PowerPoint Presentation Infographics Good
This is a balance sheet kpis tabular form ppt powerpoint presentation infographics good. This is a four stage process. The stages in this process are current assets, current liabilities, total assets, total liabilities.
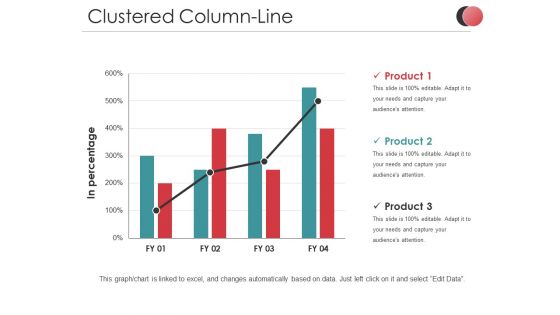
Clustered Column Line Ppt PowerPoint Presentation Infographics Templates
This is a clustered column line ppt powerpoint presentation infographics templates. This is a three stage process. The stages in this process are in percentage, business, marketing, product, finance, graph.
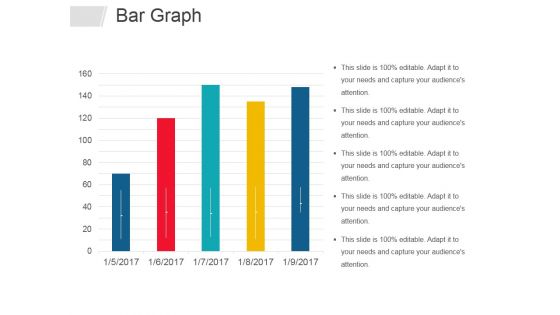
Bar Graph Ppt PowerPoint Presentation Infographics Graphics Design
This is a bar graph ppt powerpoint presentation infographics graphics design. This is a five stage process. The stages in this process are bar graph, business, years, marketing, management.
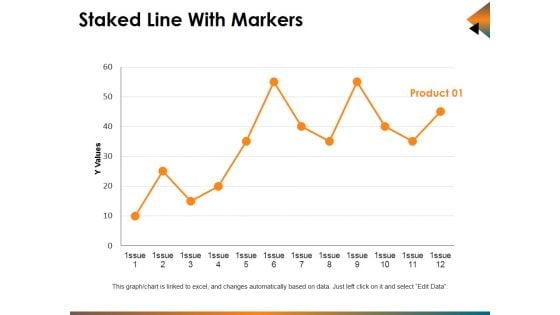
Staked Line With Markers Ppt PowerPoint Presentation Infographics Show
This is a staked line with markers ppt powerpoint presentation infographics show. This is a one stage process. The stages in this process are business, marketing, finance, line, analysis.
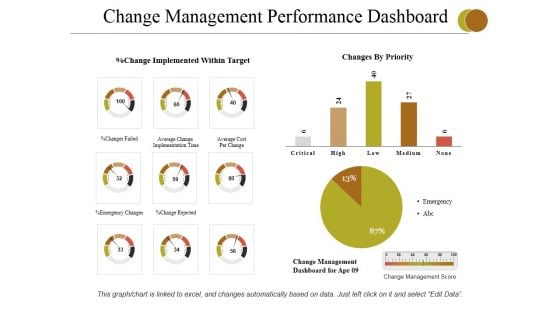
Change Management Performance Dashboard Ppt PowerPoint Presentation Infographics Topics
This is a change management performance dashboard ppt powerpoint presentation infographics topics. This is a Three stage process. The stages in this process are emergency changes, change rejected, changes failed, average cost per change, emergency.
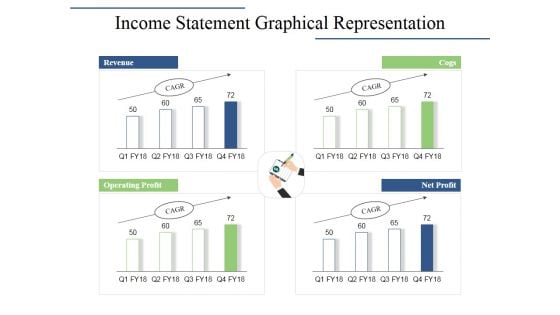
Income Statement Graphical Representation Ppt PowerPoint Presentation Infographics Layouts
This is a income statement graphical representation ppt powerpoint presentation infographics layouts. This is a four stage process. The stages in this process are revenue, cogs, operating profit, net profit.
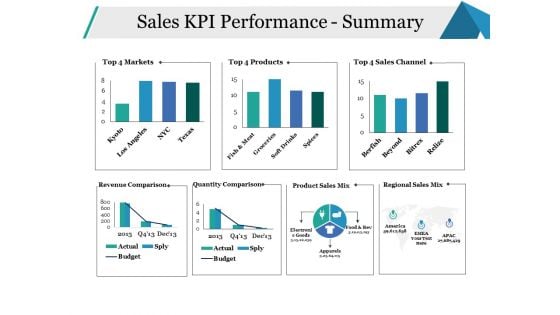
Sales KPI Performance Summary Ppt PowerPoint Presentation Infographics Model
This is a sales kpi performance summary ppt powerpoint presentation infographics model. This is a seven stage process. The stages in this process are sales channel, revenue comparison, quantity comparison, business, marketing.
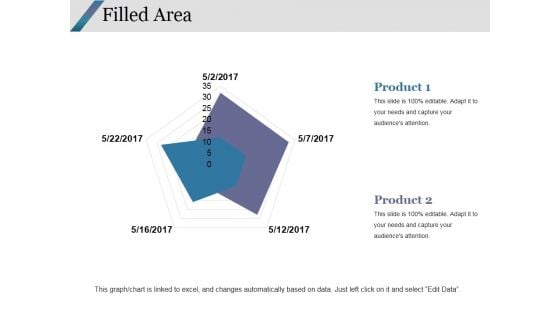
Filled Area Ppt PowerPoint Presentation Infographics Graphics Design
This is a filled area ppt powerpoint presentation infographics graphics design. This is a two stage process. The stages in this process are filled area, finance, marketing, strategy, analysis.
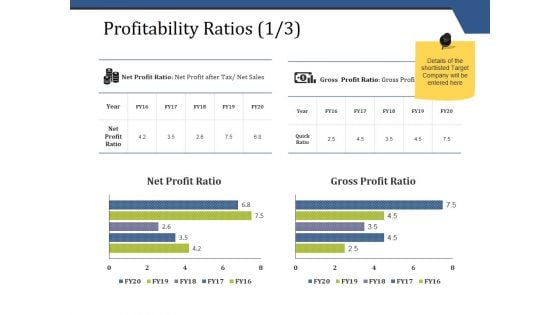
Profitability Ratios Template 1 Ppt PowerPoint Presentation Infographics Mockup
This is a profitability ratios template 1 ppt powerpoint presentation infographics mockup. This is a two stage process. The stages in this process are business, finance, marketing, strategy, analysis.
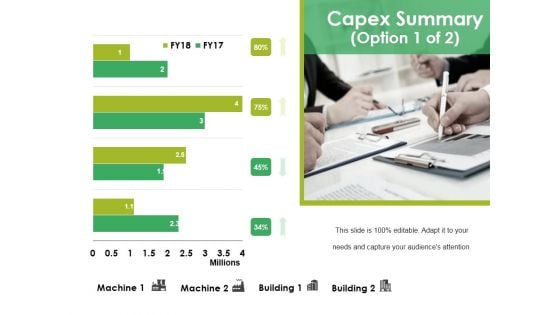
Capex Summary Template 1 Ppt PowerPoint Presentation Infographics Mockup
This is a capex summary template 1 ppt powerpoint presentation infographics mockup. This is a four stage process. The stages in this process are finance, marketing, business, analysis, strategy.
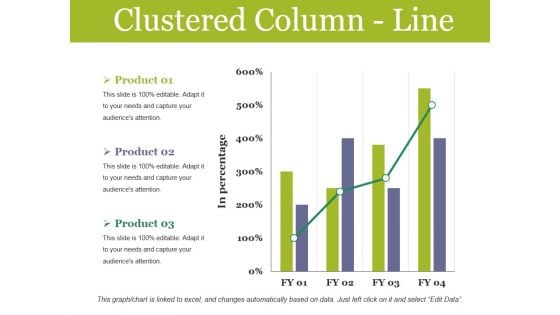
Clustered Column Line Ppt PowerPoint Presentation Infographics Graphics Design
This is a clustered column line ppt powerpoint presentation infographics graphics design. This is a three stage process. The stages in this process are finance, marketing, business, analysis, management.
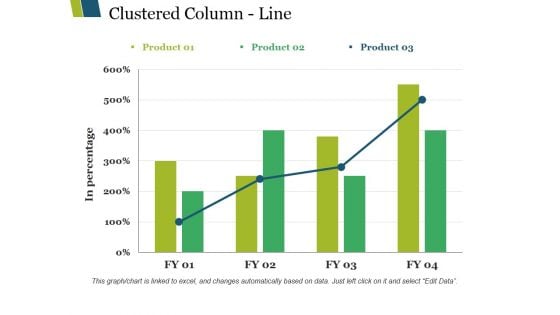
Clustered Column Line Ppt PowerPoint Presentation Infographics Background Images
This is a clustered column line ppt powerpoint presentation infographics background images. This is a three stage process. The stages in this process are clustered column line, finance, analysis, marketing, business.
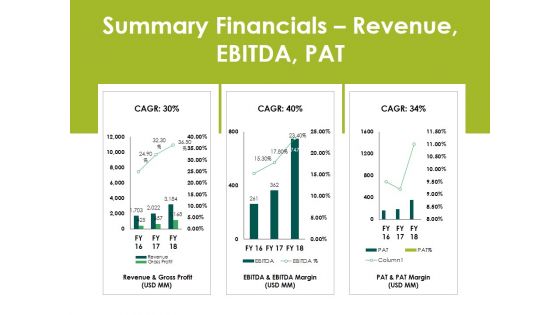
Summary Financials Revenue Ebitda Pat Ppt PowerPoint Presentation Infographics Ideas
This is a summary financials revenue ebitda pat ppt powerpoint presentation infographics ideas. This is a three stage process. The stages in this process are business, finance, analysis, marketing, strategy.
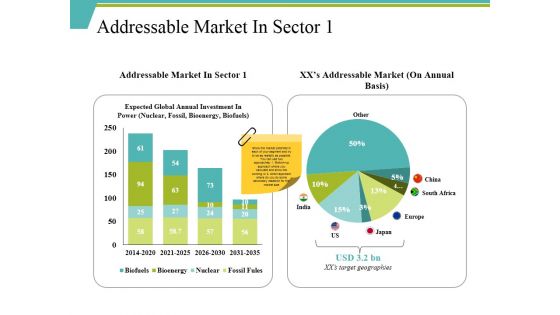
Addressable Market In Sector 1 Ppt PowerPoint Presentation Infographics Show
This is a addressable market in sector 1 ppt powerpoint presentation infographics show. This is a two stage process. The stages in this process are india, japan, europe, south africa, us.
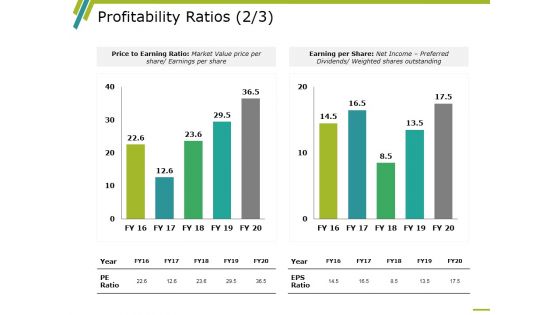
Profitability Ratios Template 4 Ppt PowerPoint Presentation Infographics Rules
This is a profitability ratios template 4 ppt powerpoint presentation infographics rules. This is a two stage process. The stages in this process are business, marketing, graph, price to earning ratio, earning per share.
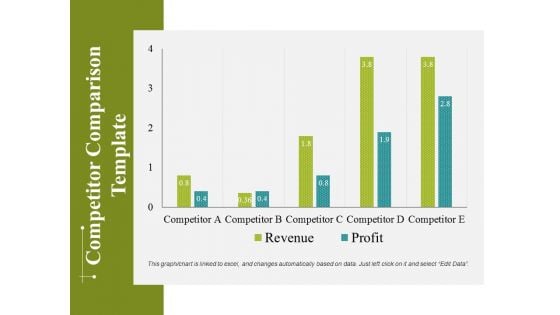
Competitor Comparison Template 2 Ppt PowerPoint Presentation Infographics Objects
This is a competitor comparison template 2 ppt powerpoint presentation infographics objects. This is a five stage process. The stages in this process are business, marketing, graph, finance, strategy.
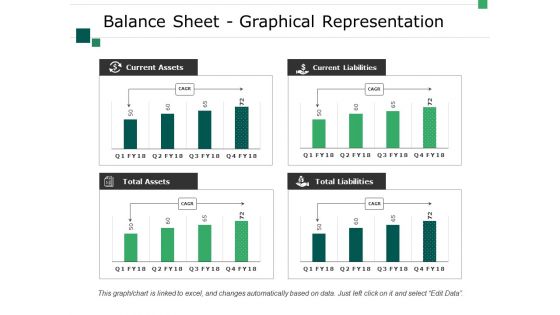
Balance Sheet Graphical Representation Ppt PowerPoint Presentation Infographics Layouts
This is a balance sheet graphical representation ppt powerpoint presentation infographics layouts. This is a four stage process. The stages in this process are business, current assets, total assets, total liabilities, current liabilities.
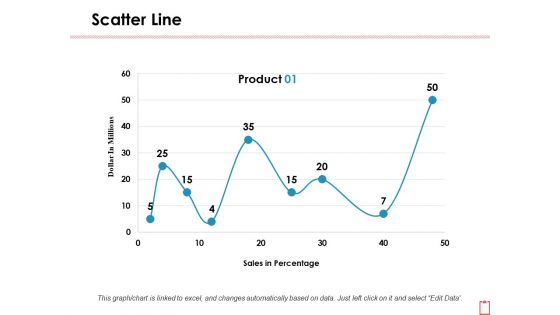
Scatter Line Ppt PowerPoint Presentation Infographics Background Images
This is a scatter line ppt powerpoint presentation infographics background images. This is a one stage process. The stages in this process are dollar in millions, product, sales in percentage.
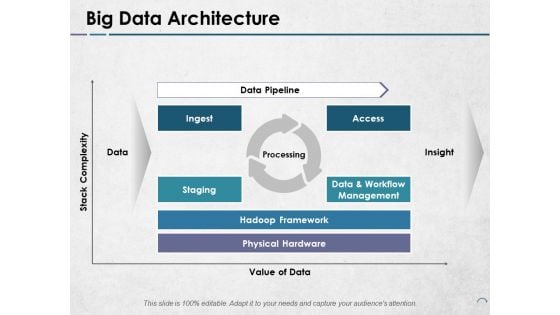
Big Data Architecture Ppt PowerPoint Presentation Infographics Design Inspiration
This is a big data architecture ppt powerpoint presentation infographics design inspiration. This is a four stage process. The stages in this process are data pipeline, processing, insight, value of data, staging.
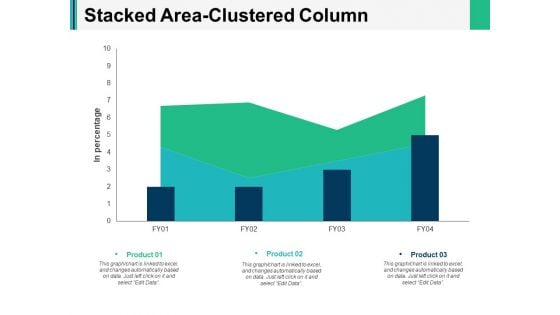
Stacked Area Clustered Column Ppt PowerPoint Presentation Infographics Backgrounds
This is a stacked area clustered column ppt powerpoint presentation infographics backgrounds. This is a three stage process. The stages in this process are finance, marketing, management, investment, analysis.
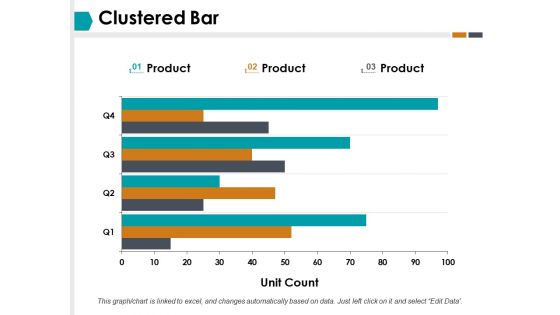
Clustered Bar Finance Ppt PowerPoint Presentation Infographics Graphics Template
This is a clustered bar finance ppt powerpoint presentation infographics graphics template. This is a three stage process. The stages in this process are clustered bar, finance, business, investment, marketing.
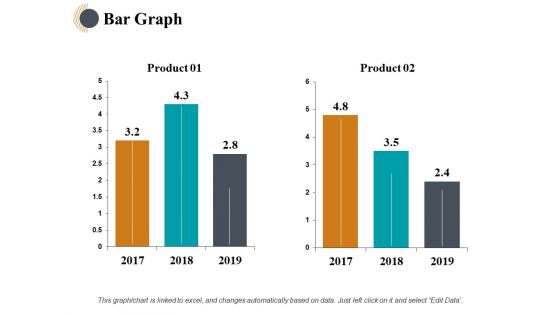
Bar Graph Finance Ppt PowerPoint Presentation Infographics Background Designs
This is a bar graph finance ppt powerpoint presentation infographics background designs. This is a two stage process. The stages in this process are finance, analysis, business, investment, marketing.
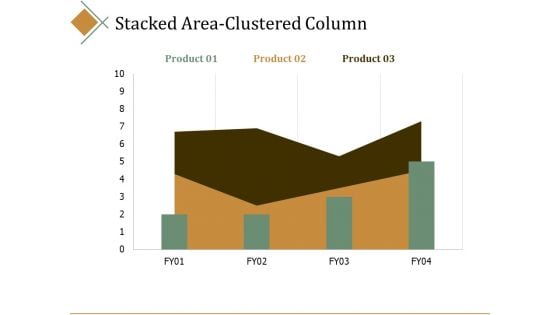
Stacked Area Clustered Column Ppt PowerPoint Presentation Infographics Portrait
This is a stacked area clustered column ppt powerpoint presentation infographics portrait. This is a three stage process. The stages in this process are percentage, product, business, management, marketing.
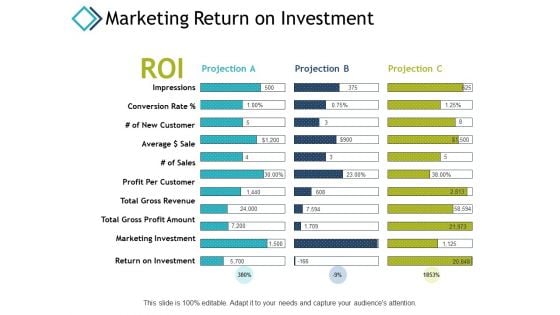
Marketing Return On Investment Ppt PowerPoint Presentation Infographics Files
This is a marketing return on investment ppt powerpoint presentation infographics files. This is a three stage process. The stages in this process are marketing investment, impressions, return on investment, finance, marketing.
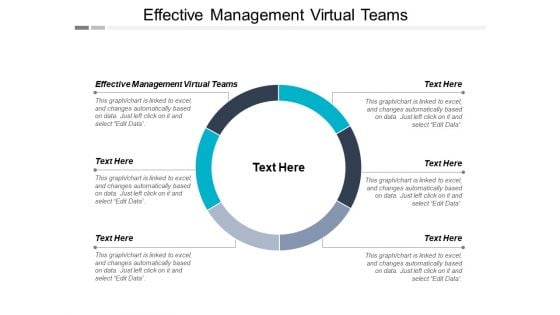
Effective Management Virtual Teams Ppt PowerPoint Presentation Infographics Ideas Cpb
This is a effective management virtual teams ppt powerpoint presentation infographics ideas cpb. This is a six stage process. The stages in this process are effective management virtual teams.
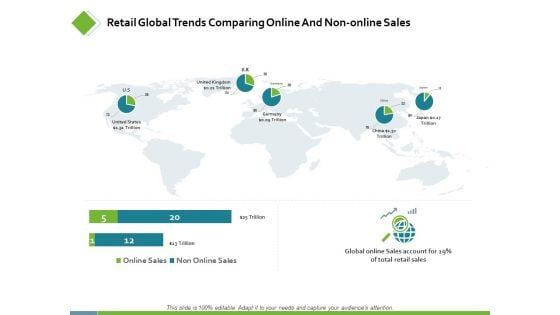
Retail Global Trends Comparing Online Ppt PowerPoint Presentation Infographics Guide
This is a retail global trends comparing online ppt powerpoint presentation infographics guide. This is a two stage process. The stages in this process are finance, analysis, business, investment, marketing.
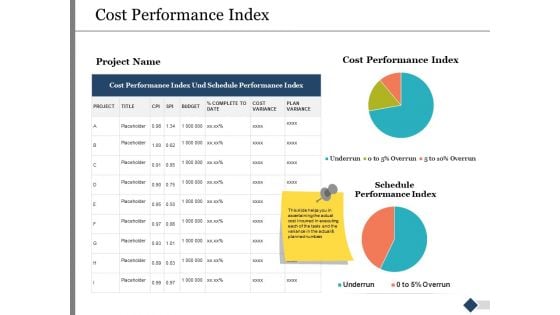
Cost Performance Index Ppt PowerPoint Presentation Infographics Mockup
This is a cost performance index ppt powerpoint presentation infographics mockup. This is a three stage process. The stages in this process are finance, marketing, management, investment, product, percentage.
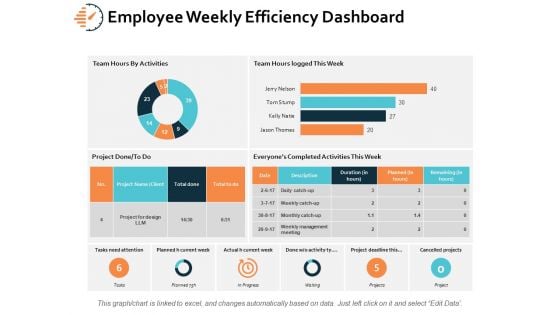
Employee Weekly Efficiency Dashboard Ppt PowerPoint Presentation Infographics Microsoft
This is a employee weekly efficiency dashboard ppt powerpoint presentation infographics microsoft. This is a six stage process. The stages in this process are finance, analysis, business, investment, marketing.

Stacked Column Percentage Product Ppt PowerPoint Presentation Infographics Outfit
This is a stacked column percentage product ppt powerpoint presentation infographics outfit. This is a two stage process. The stages in this process are marketing, business, management, percentage, product.
Drawing Of Down Arrow Ppt PowerPoint Presentation Infographics Maker
This is a drawing of down arrow ppt powerpoint presentation infographics maker. This is a stage process. The stages in this process are hand drawn arrow, hand outlined arrow, hand designed.
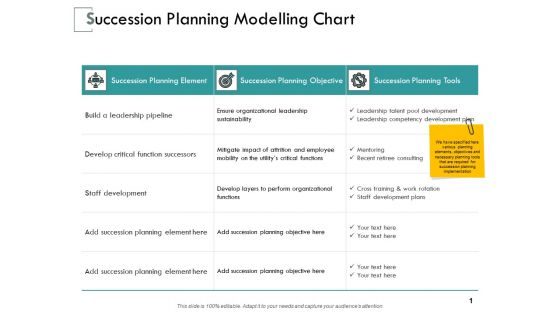
Succession Planning Modelling Chart Ppt PowerPoint Presentation Infographics Slide Portrait
Presenting this set of slides with name succession planning modelling chart ppt powerpoint presentation infographics slide portrait. The topics discussed in these slides are succession, planning, organizational, leadership, sustainability . This is a completely editable PowerPoint presentation and is available for immediate download. Download now and impress your audience.
Bulb Or Idea Ppt Powerpoint Presentation Infographics Icon
This is a bulb or idea ppt powerpoint presentation infographics icon. This is a one stage process. The stages in this process are bulb, technology, business, management, strategy, planning.
Post It Notes Ppt PowerPoint Presentation Infographics Slideshow
This is a post it notes ppt powerpoint presentation infographics slideshow. This is a four stage process. The stages in this process are business, marketing, strategy, post it, planning.
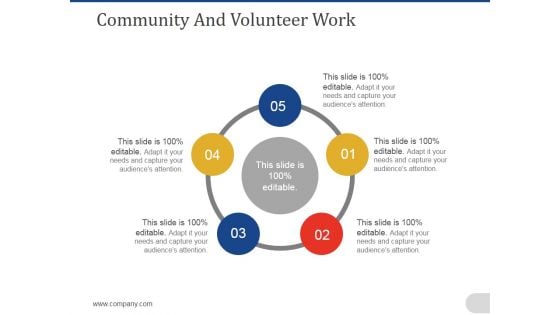
Community And Volunteer Work Ppt PowerPoint Presentation Infographics Smartart
This is a community and volunteer work ppt powerpoint presentation infographics smartart. This is a five stage process. The stages in this process are business, marketing, process, planning, strategy.

Thanks For Watching Ppt PowerPoint Presentation Infographics Tips
This is a thanks for watching ppt powerpoint presentation infographics tips. This is a one stage process. The stages in this process are thank you, success, marketing, strategy, management, planning.
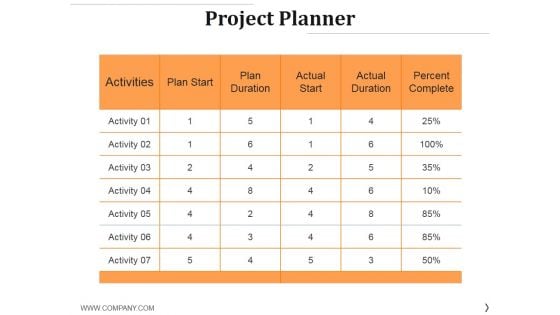
Project Planner Template 2 Ppt PowerPoint Presentation Infographics Layout
This is a project planner template 2 ppt powerpoint presentation infographics layout. This is a seven stage process. The stages in this process are activities, activity, plan duration, actual duration.

Contract Agreement Template 1 Ppt PowerPoint Presentation Infographics Tips
This is a contract agreement template 1 ppt powerpoint presentation infographics tips. This is a one stage process. The stages in this process are success, management, planning, marketing, business, strategy.

Thank You Ppt PowerPoint Presentation Infographics Example Topics
This is a thank you ppt powerpoint presentation infographics example topics. This is a one stage process. The stages in this process are thank you, planning, business, management, strategy.
Elevator Pitch Template 3 Ppt PowerPoint Presentation Infographics Elements
This is a elevator pitch template 3 ppt powerpoint presentation infographics elements. This is a one stage process. The stages in this process are magnifying glass, business, marketing, management, planning.
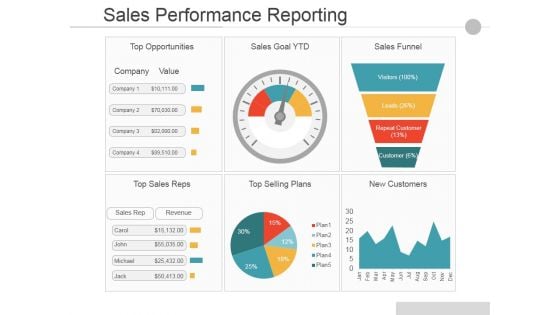
Sales Performance Reporting Ppt PowerPoint Presentation Infographics Portrait
This is a Sales Performance Reporting Ppt PowerPoint Presentation Infographics Portrait. This is a six stage process. The stages in this process are Top Opportunities, Sales Goal Ytd, Sales Funnel, Top Sales Reps, Top Selling Plans, New Customers.

Classification Of Solar System Ppt PowerPoint Presentation Infographics Images
This is a classification of solar system ppt powerpoint presentation infographics images. This is a one stage process. The stages in this process are green energy, management, planning, strategy, marketing.

Timeline Continued Template 2 Ppt PowerPoint Presentation Infographics Objects
This is a timeline continued template 2 ppt powerpoint presentation infographics objects. This is a two stage process. The stages in this process are year, growth, success, time planning, business.
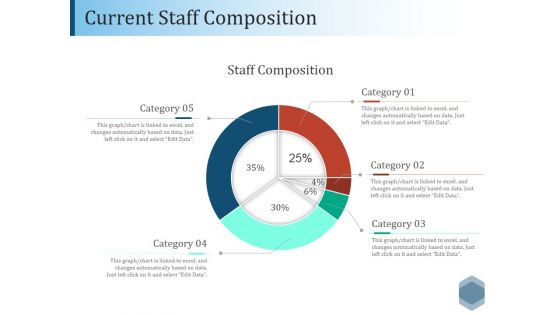
Current Staff Composition Ppt PowerPoint Presentation Infographics Design Inspiration
This is a current staff composition ppt powerpoint presentation infographics design inspiration. This is a five stage process. The stages in this process are staff composition, business, circle, process, planning.
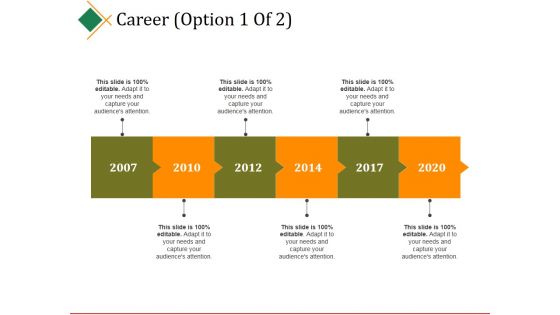
Career Template 1 Ppt PowerPoint Presentation Infographics Tips
This is a career template 1 ppt powerpoint presentation infographics tips. This is a six stage process. The stages in this process are year, growth, success, time planning, business.
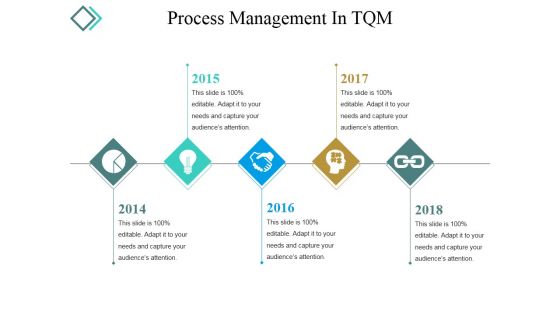
Process Management In Tqm Ppt PowerPoint Presentation Infographics Gridlines
This is a process management in tqm ppt powerpoint presentation infographics gridlines. This is a five stage process. The stages in this process are year, growth, success, time planning, business.
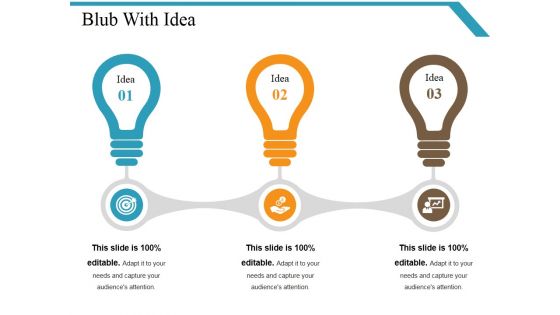
Blub With Idea Ppt PowerPoint Presentation Infographics Objects
This is a blub with idea ppt powerpoint presentation infographics objects. This is a three stage process. The stages in this process are technology, marketing, strategy, planning, light bulbs.
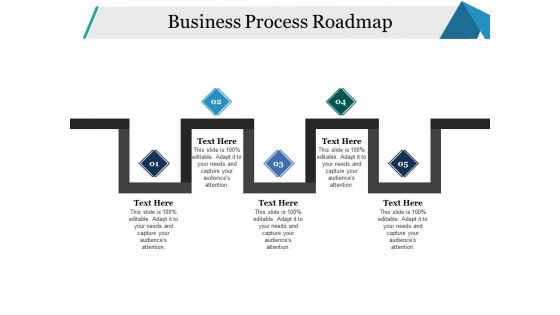
Business Process Roadmap Ppt PowerPoint Presentation Infographics Example Topics
This is a business process roadmap ppt powerpoint presentation infographics example topics. This is a five stage process. The stages in this process are process, business, management, strategy, planning.
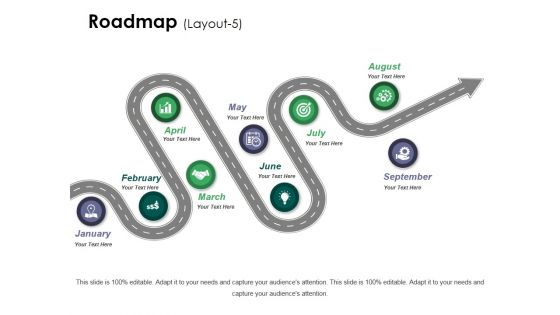
Roadmap Template 5 Ppt PowerPoint Presentation Infographics Show
This is a roadmap template 5 ppt powerpoint presentation infographics show. This is a nine stage process. The stages in this process are roadmap, process, management, icons, planning, success, growth.


 Continue with Email

 Home
Home


