Ai Icon
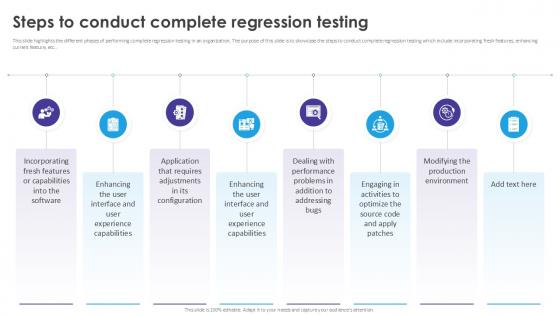
Steps To Conduct Complete Automated Regression Testing And Achieving PPT Slide
This slide highlights the different phases of performing complete regression testing in an organization. The purpose of this slide is to showcase the steps to conduct complete regression testing which include incorporating fresh features, enhancing current feature, etc.. The best PPT templates are a great way to save time, energy, and resources. Slidegeeks have 100 percent editable powerpoint slides making them incredibly versatile. With these quality presentation templates, you can create a captivating and memorable presentation by combining visually appealing slides and effectively communicating your message. Download Steps To Conduct Complete Automated Regression Testing And Achieving PPT Slide from Slidegeeks and deliver a wonderful presentation. This slide highlights the different phases of performing complete regression testing in an organization. The purpose of this slide is to showcase the steps to conduct complete regression testing which include incorporating fresh features, enhancing current feature, etc..
Android Automation Applications Comparative Survey Pictures PDF
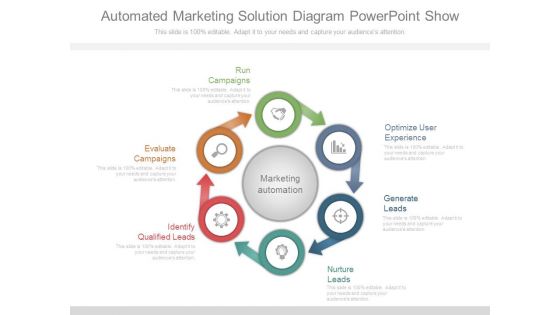
Automated Marketing Solution Diagram Powerpoint Show
This is an automated marketing solution diagram powerpoint show. This is a six stage process. The stages in this process are run campaigns, optimize user experience, generate leads, nurture leads, identify qualified leads, evaluate campaigns.
Strategic Management Text Box Steps 3 Marketing Diagram
Dreams Generate Thoughts, Thoughts Generate Ideas. Give Them Life With Our Strategic Management Text Box steps 3 Marketing Diagram Powerpoint Templates.
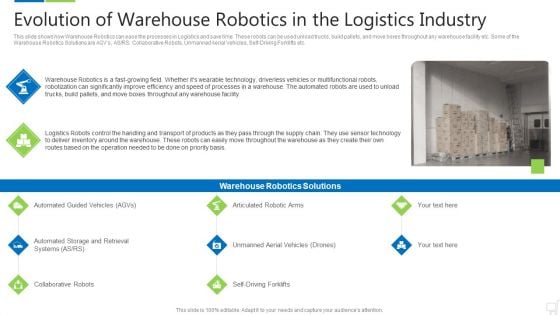
Evolution Of Warehouse Robotics In The Logistics Industry Diagrams PDF
This slide shows how Warehouse Robotics can ease the processes in Logistics and save time. These robots can be used unload trucks, build pallets, and move boxes throughout any warehouse facility etc. Some of the Warehouse Robotics Solutions are AGVs, AS RS, Collaborative Robots, Unmanned Aerial Vehicles, Self Driving Forklifts etc. Deliver an awe inspiring pitch with this creative evolution of warehouse robotics in the logistics industry diagrams pdf bundle. Topics like automated guided vehicles, articulated robotic arms, collaborative robots can be discussed with this completely editable template. It is available for immediate download depending on the needs and requirements of the user.
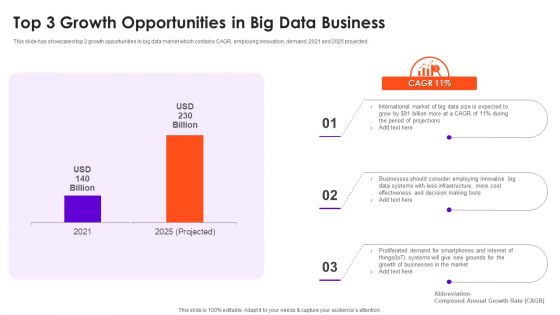
Top 3 Growth Opportunities In Big Data Business Download PDF
This slide has showcased top 3 growth opportunities in big data market which contains CAGR, employing innovation, demand, 2021 and 2025 projected. Pitch your topic with ease and precision using this Top 3 Growth Opportunities In Big Data Business Download PDF. This layout presents information on Cost, Businesses, Data Systems. It is also available for immediate download and adjustment. So, changes can be made in the color, design, graphics or any other component to create a unique layout.
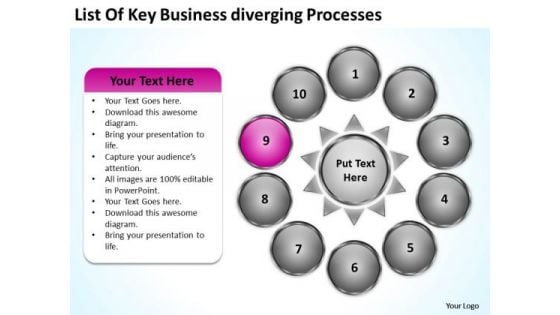
Nine Stages Diverging Factors Flow Chart Circular Diagram PowerPoint Templates
We present our nine stages diverging factors flow chart Circular Diagram PowerPoint templates.Download our Ring Charts PowerPoint Templates because the basic stages are in place, you need to build upon them with our PowerPoint templates. Download and present our Process and Flows PowerPoint Templates because brilliant ideas are your forte. Download and present our Circle charts PowerPoint Templates because you can Refine them all as you take them through the numerous filtering stages of the funnel of your quality control process. Download our Arrows PowerPoint Templates because this template contains the material to highlight the key issues of your presentation. Download our Success PowerPoint Templates because you have come up with a brilliant breakthrough idea. you can also visualise the interest it will generate.Use these PowerPoint slides for presentations relating to Arrow, blue, business, chart, check,circle, concept, control, creative, cycle,design, development, diagram, do,engineering, evaluate, flow, glossy,graphic, green, idea, infographic, life,lifecycle, management, marketing,method, model, pdca, plan, plan,docheckact, process, quality, red,research, software, spiral, step, strategy,success, system. The prominent colors used in the PowerPoint template are Pink, White, Gray. People tell us our nine stages diverging factors flow chart Circular Diagram PowerPoint templates look good visually. Customers tell us our chart PowerPoint templates and PPT Slides are Precious. Professionals tell us our nine stages diverging factors flow chart Circular Diagram PowerPoint templates are Beautiful. Presenters tell us our chart PowerPoint templates and PPT Slides will help you be quick off the draw. Just enter your specific text and see your points hit home. Use our nine stages diverging factors flow chart Circular Diagram PowerPoint templates are Spectacular. Presenters tell us our concept PowerPoint templates and PPT Slides are Second to none. Form plans with our Nine Stages Diverging Factors Flow Chart Circular Diagram PowerPoint Templates. Download without worries with our money back guaranteee.
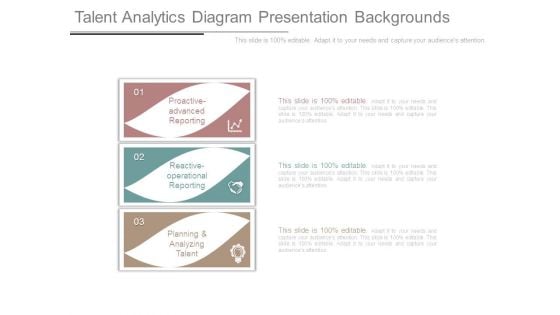
Talent Analytics Diagram Presentation Backgrounds
This is a talent analytics diagram presentation backgrounds. This is a three stage process. The stages in this process are proactive advanced reporting, reactive operational reporting, planning and analyzing talent.
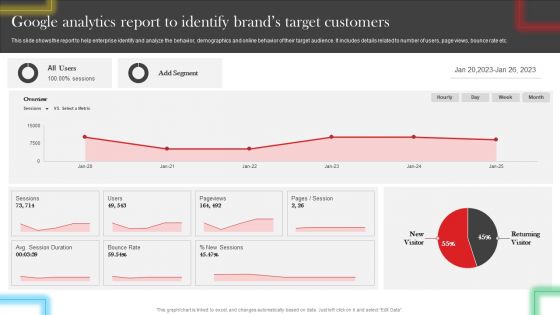
Google Analytics Report To Identify Brands Target Customers Diagrams PDF
This slide shows the report to help enterprise identify and analyze the behavior, demographics and online behavior of their target audience. It includes details related to number of users, page views, bounce rate etc. Present like a pro with Google Analytics Report To Identify Brands Target Customers Diagrams PDF Create beautiful presentations together with your team, using our easy-to-use presentation slides. Share your ideas in real-time and make changes on the fly by downloading our templates. So whether you are in the office, on the go, or in a remote location, you can stay in sync with your team and present your ideas with confidence. With Slidegeeks presentation got a whole lot easier. Grab these presentations today.
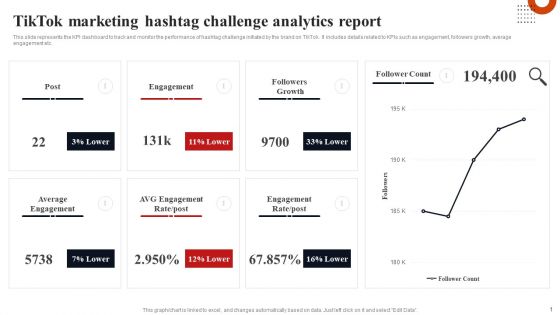
Tiktok Marketing Hashtag Challenge Analytics Report Diagrams PDF
This slide represents the KPI dashboard to track and monitor the performance of hashtag challenge initiated by the brand on TikTok. It includes details related to KPIs such as engagement, followers growth, average engagement etc. This modern and well arranged Tiktok Marketing Hashtag Challenge Analytics Report Diagrams PDF provides lots of creative possibilities. It is very simple to customize and edit with the Powerpoint Software. Just drag and drop your pictures into the shapes. All facets of this template can be edited with Powerpoint no extra software is necessary. Add your own material, put your images in the places assigned for them, adjust the colors, and then you can show your slides to the world, with an animated slide included.
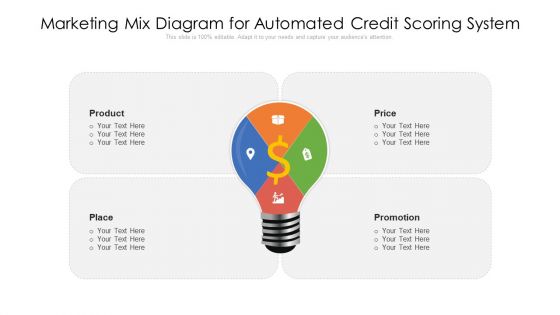
Marketing Mix Diagram For Automated Credit Scoring System Ppt Outline Display PDF
Presenting marketing mix diagram for automated credit scoring system ppt outline display pdf to dispense important information. This template comprises four stages. It also presents valuable insights into the topics including product, place, price, promotion. This is a completely customizable PowerPoint theme that can be put to use immediately. So, download it and address the topic impactfully.
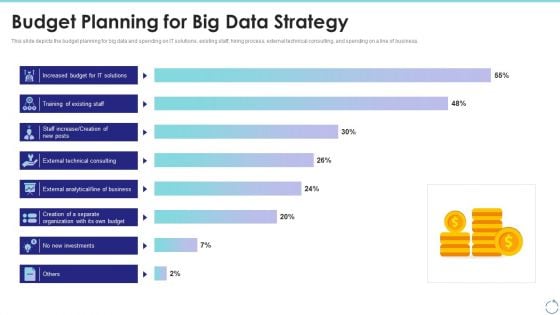
Budget Planning For Big Data Strategy Ppt Show Elements PDF
This slide depicts the budget planning for big data and spending on IT solutions, existing staff, hiring process, external technical consulting, and spending on a line of business. Deliver and pitch your topic in the best possible manner with this budget planning for big data strategy ppt show elements pdf. Use them to share invaluable insights on investments, budget, organization and impress your audience. This template can be altered and modified as per your expectations. So, grab it now.
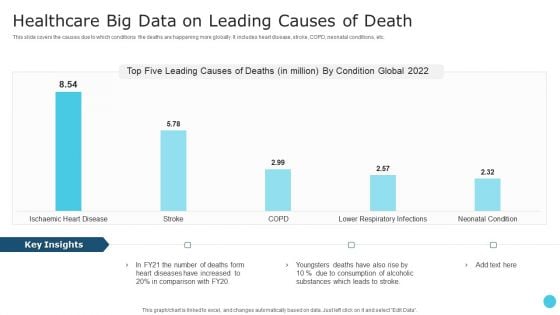
Healthcare Big Data On Leading Causes Of Death Information PDF
This slide covers the causes due to which conditions the deaths are happening more globally. It includes heart disease, stroke, COPD, neonatal conditions, etc. Showcasing this set of slides titled Healthcare Big Data On Leading Causes Of Death Information PDF. The topics addressed in these templates are Healthcare Big Data, Condition Global. All the content presented in this PPT design is completely editable. Download it and make adjustments in color, background, font etc. as per your unique business setting.

Technology And Skills Matrix For Data Interpretation And Evaluation Lifecycle Phases Slides PDF
This slide covers the matrix representing technology and skills required for each phase of data analytics and assessment infrastructure lifecycle. It includes four phases of analytics infrastructure lifecycle such as ingestion, data quality and governance, data lake administration and analytics. Presenting Technology And Skills Matrix For Data Interpretation And Evaluation Lifecycle Phases Slides PDF to dispense important information. This template comprises four stages. It also presents valuable insights into the topics including Ingestion, Data Lake Administration, Data Quality And Governance. This is a completely customizable PowerPoint theme that can be put to use immediately. So, download it and address the topic impactfully.
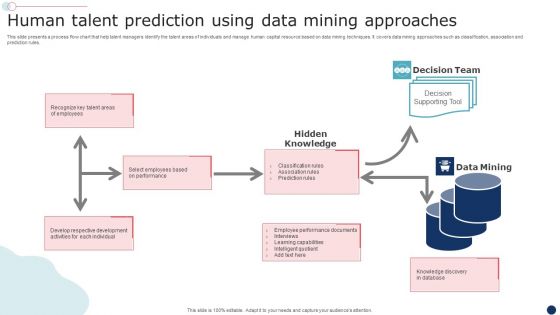
Human Talent Prediction Using Data Mining Approaches Mockup PDF
This slide presents a process flow chart that help talent managers identify the talent areas of individuals and manage human capital resource based on data mining techniques. It covers data mining approaches such as classification, association and prediction rules. Showcasing this set of slides titled Human Talent Prediction Using Data Mining Approaches Mockup PDF. The topics addressed in these templates are Human Talent, Prediction Using, Data Mining Approaches. All the content presented in this PPT design is completely editable. Download it and make adjustments in color, background, font etc. as per your unique business setting.
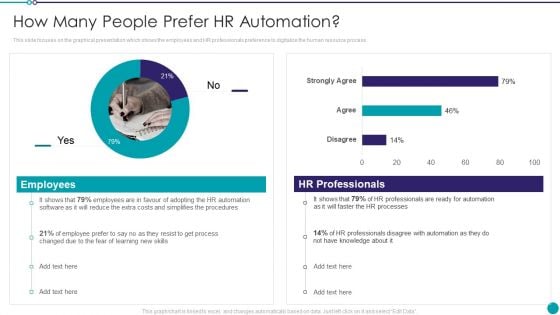
Automating Key Activities Of HR Manager How Many People Prefer HR Automation Themes PDF
This slide focuses on the graphical presentation which shows the employees and HR professionals preference to digitalize the human resource process.Deliver an awe inspiring pitch with this creative Automating Key Activities Of HR Manager How Many People Prefer HR Automation Themes PDF bundle. Topics like Professionals Automation, Professionals Disagree, Simplifies Procedures can be discussed with this completely editable template. It is available for immediate download depending on the needs and requirements of the user.
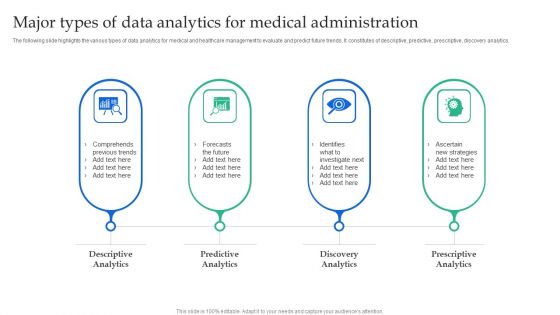
Major Types Of Data Analytics For Medical Administration Summary PDF
The following slide highlights the various types of data analytics for medical and healthcare management to evaluate and predict future trends. It constitutes of descriptive, predictive, prescriptive, discovery analytics.Presenting Major Types Of Data Analytics For Medical Administration Summary PDF to dispense important information. This template comprises four stages. It also presents valuable insights into the topics including Descriptive Analytics, Predictive Analytics, Discovery Analytics. This is a completely customizable PowerPoint theme that can be put to use immediately. So, download it and address the topic impactfully.
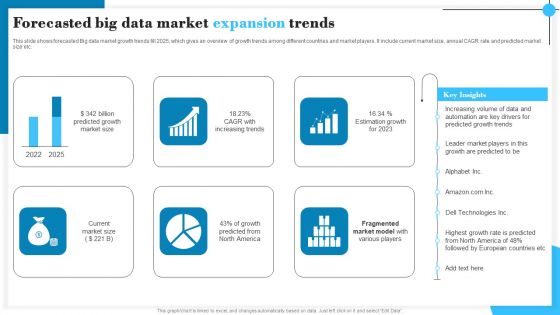
Forecasted Big Data Market Expansion Trends Download PDF
This slide shows forecasted Big data market growth trends till 2025, which gives an overview of growth trends among different countries and market players. It include current market size, annual CAGR rate and predicted market size etc. Pitch your topic with ease and precision using this Forecasted Big Data Market Expansion Trends Download PDF. This layout presents information on Billion Predicted Growth, Increasing Trends, Estimation Growth. It is also available for immediate download and adjustment. So, changes can be made in the color, design, graphics or any other component to create a unique layout.
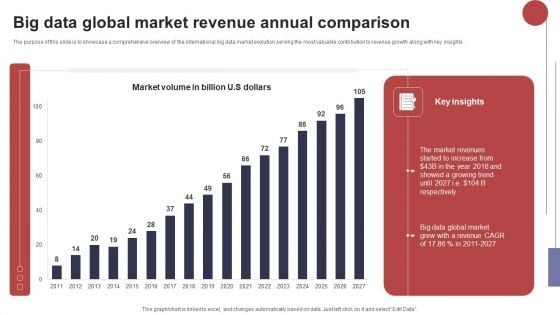
Big Data Global Market Revenue Annual Comparison Structure PDF
The purpose of this slide is to showcase a comprehensive overview of the international big data market evolution serving the most valuable contribution to revenue growth along with key insights. Pitch your topic with ease and precision using this Big Data Global Market Revenue Annual Comparison Structure PDF. This layout presents information on Market Revenues, Global Market, Growing Trend. It is also available for immediate download and adjustment. So, changes can be made in the color, design, graphics or any other component to create a unique layout.
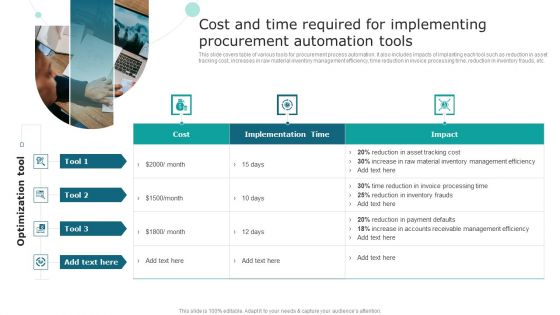
Cost And Time Required For Implementing Procurement Automation Tools Themes PDF
This slide covers table of various tools for procurement process automation. It also includes impacts of implanting each tool such as reduction in asset tracking cost, increases in raw material inventory management efficiency, time reduction in invoice processing time, reduction in inventory frauds, etc. Slidegeeks is one of the best resources for PowerPoint templates. You can download easily and regulate Cost And Time Required For Implementing Procurement Automation Tools Themes PDF for your personal presentations from our wonderful collection. A few clicks is all it takes to discover and get the most relevant and appropriate templates. Use our Templates to add a unique zing and appeal to your presentation and meetings. All the slides are easy to edit and you can use them even for advertisement purposes.
Automating Supply Chain Dashboard For Tracking Impact Of Procurement Process Automation Themes PDF
This slide covers the dashboard for analysing procurement performance after automation. It include KPIs such as on-time delivery, percentage of returns, compliance index percentage, procurement ROI, cost-saving, budget spent on training, etc. Deliver an awe inspiring pitch with this creative Automating Supply Chain Dashboard For Tracking Impact Of Procurement Process Automation Themes PDF bundle. Topics like Procurement ROI, Cost Saving, Perform Procurement can be discussed with this completely editable template. It is available for immediate download depending on the needs and requirements of the user.
Automating Supply Chain Dashboard For Tracking Impact Of Transport Automation Themes PDF
This slide covers the dashboard for tracking vehicle efficiency after transport automation. It include KPIs such as truck turnaround time, average revenue per hour, truckload capacity, transit time, on-time pickup, and average revenue per mile. Deliver an awe inspiring pitch with this creative Automating Supply Chain Dashboard For Tracking Impact Of Transport Automation Themes PDF bundle. Topics like Average Revenue, Per Mile, Truck Turnaround can be discussed with this completely editable template. It is available for immediate download depending on the needs and requirements of the user.

Graph Illustrating Impact Of Prescriptive Analytics Data Analytics SS V
This slide showcases graph highlighting impact analysis of prescriptive analytics on businesses via use of major performance indicators. It provides information total revenue, inventory levels and labour costs with key insights.Take your projects to the next level with our ultimate collection of Graph Illustrating Impact Of Prescriptive Analytics Data Analytics SS V. Slidegeeks has designed a range of layouts that are perfect for representing task or activity duration, keeping track of all your deadlines at a glance. Tailor these designs to your exact needs and give them a truly corporate look with your own brand colors they will make your projects stand out from the rest This slide showcases graph highlighting impact analysis of prescriptive analytics on businesses via use of major performance indicators. It provides information total revenue, inventory levels and labour costs with key insights.
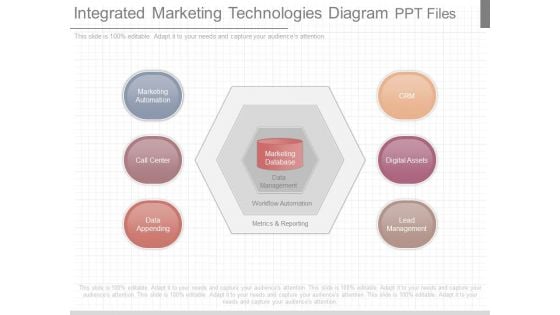
Integrated Marketing Technologies Diagram Ppt Files
This is a integrated marketing technologies diagram ppt files. This is a six stage process. The stages in this process are crm, digital assets, lead management, marketing, automation, call center, data appending, marketing database, data management, workflow automation, metrics and reporting.
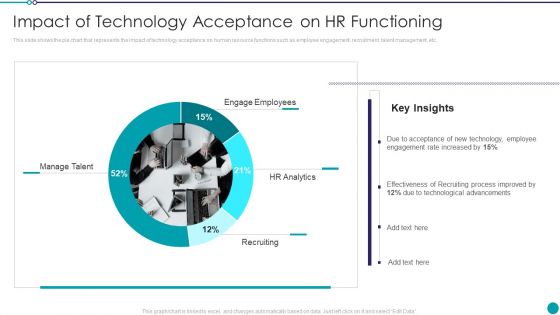
Automating Key Activities Of HR Manager Impact Of Technology Acceptance On HR Functioning Slides PDF
This slide shows the pie chart that represents the impact of technology acceptance on human resource functions such as employee engagement, recruitment, talent management, etc.Deliver and pitch your topic in the best possible manner with this Automating Key Activities Of HR Manager Impact Of Technology Acceptance On HR Functioning Slides PDF Use them to share invaluable insights on Acceptance Technology, Employee Engagement, Effectiveness Recruiting and impress your audience. This template can be altered and modified as per your expectations. So, grab it now.
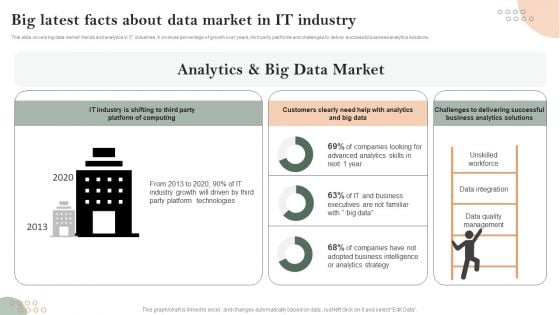
Big Latest Facts About Data Market In IT Industry Pictures PDF
This slide covers big data market trends and analytics in IT industries. It involves percentage of growth over years, third party platforms and challenges to deliver successful business analytics solutions. Showcasing this set of slides titled Big Latest Facts About Data Market In IT Industry Pictures PDF. The topics addressed in these templates are Unskilled Workforce, Data Integration, Data Quality Management. All the content presented in this PPT design is completely editable. Download it and make adjustments in color, background, font etc. as per your unique business setting.
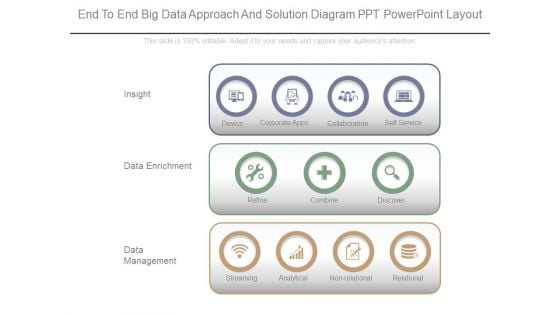
End To End Big Data Approach And Solution Diagram Ppt Powerpoint Layout
This is a end to end big data approach and solution diagram ppt powerpoint layout. This is a three stage process. The stages in this process are insight, data enrichment, data management, device, corporate apps, collaboration, self service, refine, combine, discover, relational, non relational, analytical, streaming.
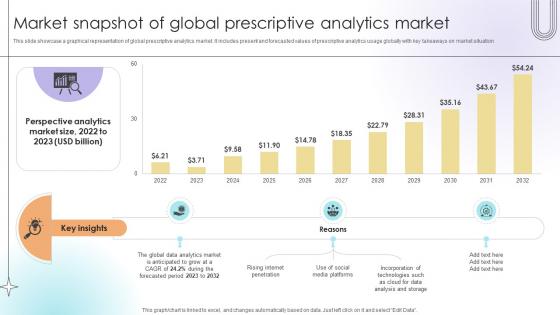
Market Snapshot Of Global Prescriptive Analytics Market Data Analytics SS V
This slide showcase a graphical representation of global prescriptive analytics market. It includes present and forecasted values of prescriptive analytics usage globally with key takeaways on market situation.Make sure to capture your audiences attention in your business displays with our gratis customizable Market Snapshot Of Global Prescriptive Analytics Market Data Analytics SS V. These are great for business strategies, office conferences, capital raising or task suggestions. If you desire to acquire more customers for your tech business and ensure they stay satisfied, create your own sales presentation with these plain slides. This slide showcase a graphical representation of global prescriptive analytics market. It includes present and forecasted values of prescriptive analytics usage globally with key takeaways on market situation.
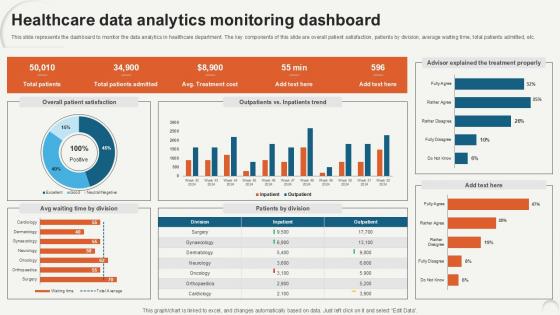
Healthcare Data Analytics Monitoring Data Analytics For Informed Decision Ppt PowerPoint
This slide represents the dashboard to monitor the data analytics in healthcare department. The key components of this slide are overall patient satisfaction, patients by division, average waiting time, total patients admitted, etc. Make sure to capture your audiences attention in your business displays with our gratis customizable Healthcare Data Analytics Monitoring Data Analytics For Informed Decision Ppt PowerPoint. These are great for business strategies, office conferences, capital raising or task suggestions. If you desire to acquire more customers for your tech business and ensure they stay satisfied, create your own sales presentation with these plain slides. This slide represents the dashboard to monitor the data analytics in healthcare department. The key components of this slide are overall patient satisfaction, patients by division, average waiting time, total patients admitted, etc.

Healthcare Big Data Assessment Dashboard Slide2 Introduction PDF
This slide covers the records about the patients used to describe massive volumes of information created by the adoption of digital technologies that collect patients records and help in managing hospital performance. Showcasing this set of slides titled Healthcare Big Data Assessment Dashboard Slide2 Introduction PDF. The topics addressed in these templates are Forecasted Patient Turnover, Service Indicators, Occupancy. All the content presented in this PPT design is completely editable. Download it and make adjustments in color, background, font etc. as per your unique business setting.
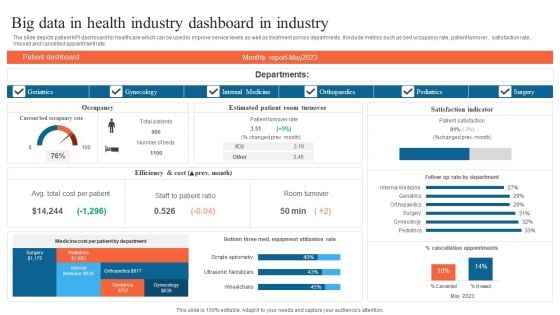
Big Data In Health Industry Dashboard In Industry Summary PDF
The slide depicts patient KPI dashboard for healthcare which can be used to improve service levels as well as treatment across departments. It include metrics such as bed occupancy rate, patient turnover, satisfaction rate, missed and cancelled appointment rate. Showcasing this set of slides titled Big Data In Health Industry Dashboard In Industry Summary PDF. The topics addressed in these templates are Geriatrics, Gynecology, Internal Medicine. All the content presented in this PPT design is completely editable. Download it and make adjustments in color, background, font etc. as per your unique business setting.

Toolkit For Data Science And Analytics Transition Data Analytics Value Stream Chain Pictures PDF
This slide illustrates the series of activities required for analyzing the data. It contains information such as data preparation, exploratory analysis, and predictive analytics etc. If you are looking for a format to display your unique thoughts, then the professionally designed Toolkit For Data Science And Analytics Transition Data Analytics Value Stream Chain Pictures PDF is the one for you. You can use it as a Google Slides template or a PowerPoint template. Incorporate impressive visuals, symbols, images, and other charts. Modify or reorganize the text boxes as you desire. Experiment with shade schemes and font pairings. Alter, share or cooperate with other people on your work. Download Toolkit For Data Science And Analytics Transition Data Analytics Value Stream Chain Pictures PDF and find out how to give a successful presentation. Present a perfect display to your team and make your presentation unforgettable.
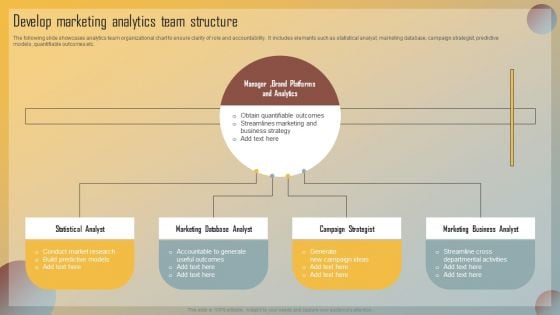
Guide For Marketing Analytics To Improve Decisions Develop Marketing Analytics Team Structure Professional PDF
The following slide showcases analytics team organizational chart to ensure clarity of role and accountability. It includes elements such as statistical analyst, marketing database, campaign strategist, predictive models, quantifiable outcomes etc. Get a simple yet stunning designed Guide For Marketing Analytics To Improve Decisions Develop Marketing Analytics Team Structure Professional PDF. It is the best one to establish the tone in your meetings. It is an excellent way to make your presentations highly effective. So, download this PPT today from Slidegeeks and see the positive impacts. Our easy to edit Guide For Marketing Analytics To Improve Decisions Develop Marketing Analytics Team Structure Professional PDF can be your go to option for all upcoming conferences and meetings. So, what are you waiting for Grab this template today.
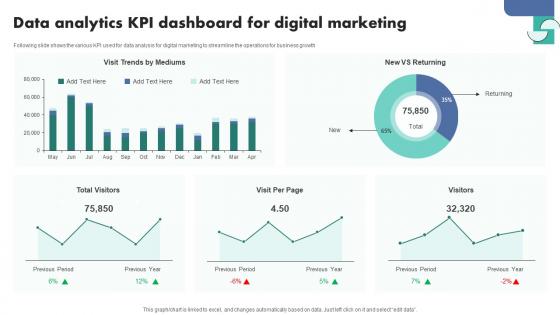
Data Analytics Kpi Dashboard For Digital Marketing Inspiration Pdf
Following slide shows the various KPI used for data analysis for digital marketing to streamline the operations for business growth.Showcasing this set of slides titled Data Analytics Kpi Dashboard For Digital Marketing Inspiration Pdf The topics addressed in these templates are Data Analytics KPI, Dashboard Digital Marketing All the content presented in this PPT design is completely editable. Download it and make adjustments in color, background, font etc. as per your unique business setting. Following slide shows the various KPI used for data analysis for digital marketing to streamline the operations for business growth.

Step 7 Monitor Analytics Implementation For Inventory Using Dashboard Data Analytics SS V
This slide provides a dashboard highlighting inventory performance aimed at helping businesses streamline operations. It covers details on sales orders, invoices, order value, invoice amount, YTD invoice value and sales growth. Welcome to our selection of the Step 7 Monitor Analytics Implementation For Inventory Using Dashboard Data Analytics SS V. These are designed to help you showcase your creativity and bring your sphere to life. Planning and Innovation are essential for any business that is just starting out. This collection contains the designs that you need for your everyday presentations. All of our PowerPoints are 100 percent editable, so you can customize them to suit your needs. This multi-purpose template can be used in various situations. Grab these presentation templates today. This slide provides a dashboard highlighting inventory performance aimed at helping businesses streamline operations. It covers details on sales orders, invoices, order value, invoice amount, YTD invoice value and sales growth.
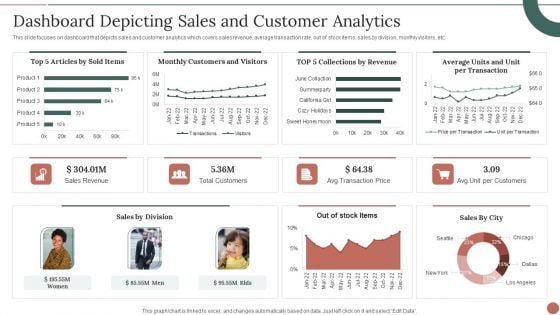
Retail Business Product Planning Procedure Dashboard Depicting Sales And Customer Analytics Themes PDF
This slide focuses on dashboard that depicts sales and customer analytics which covers sales revenue, average transaction rate, out of stock items, sales by division, monthly visitors, etc. Deliver and pitch your topic in the best possible manner with this Retail Business Product Planning Procedure Dashboard Depicting Sales And Customer Analytics Themes PDF. Use them to share invaluable insights on Sales Revenue, Total Customers, Sales By Division and impress your audience. This template can be altered and modified as per your expectations. So, grab it now.
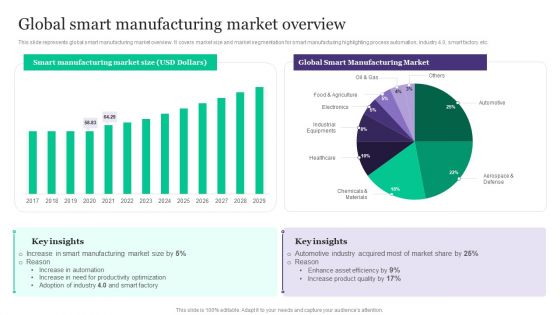
Deployment Of Automated Production Technology Global Smart Manufacturing Market Overview Clipart PDF
This slide represents global smart manufacturing market overview. It covers market size and market segmentation for smart manufacturing highlighting process automation, industry 4.0, smart factory etc.There are so many reasons you need a Deployment Of Automated Production Technology Global Smart Manufacturing Market Overview Clipart PDF. The first reason is you can not spend time making everything from scratch, Thus, Slidegeeks has made presentation templates for you too. You can easily download these templates from our website easily.
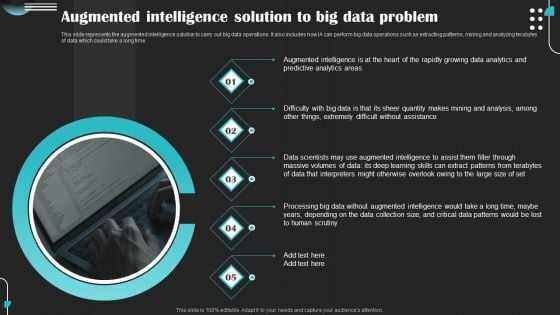
Intelligence Amplification IA IT Augmented Intelligence Solution To Big Data Problem Introduction PDF
This slide represents the augmented intelligence solution to carry out big data operations. It also includes how IA can perform big data operations such as extracting patterns, mining and analyzing terabytes of data which could take a long time. Retrieve professionally designed Intelligence Amplification IA IT Augmented Intelligence Solution To Big Data Problem Introduction PDF to effectively convey your message and captivate your listeners. Save time by selecting pre-made slideshows that are appropriate for various topics, from business to educational purposes. These themes come in many different styles, from creative to corporate, and all of them are easily adjustable and can be edited quickly. Access them as PowerPoint templates or as Google Slides themes. You do not have to go on a hunt for the perfect presentation because Slidegeeks got you covered from everywhere.

Global Data Security Industry Report Geographical Analysis For Cybersecurity Industry IR SS V
The slide highlights the geographical summary of current state of cybersecurity industry. The purpose of the slide is to provide insights on cybersecurity landscape, trends, development at regional levels. It helps stakeholders in understanding the market dynamics, regulatory environments and potential growth opportunities. If your project calls for a presentation, then Slidegeeks is your go-to partner because we have professionally designed, easy-to-edit templates that are perfect for any presentation. After downloading, you can easily edit Global Data Security Industry Report Geographical Analysis For Cybersecurity Industry IR SS V and make the changes accordingly. You can rearrange slides or fill them with different images. Check out all the handy templates The slide highlights the geographical summary of current state of cybersecurity industry. The purpose of the slide is to provide insights on cybersecurity landscape, trends, development at regional levels. It helps stakeholders in understanding the market dynamics, regulatory environments and potential growth opportunities.
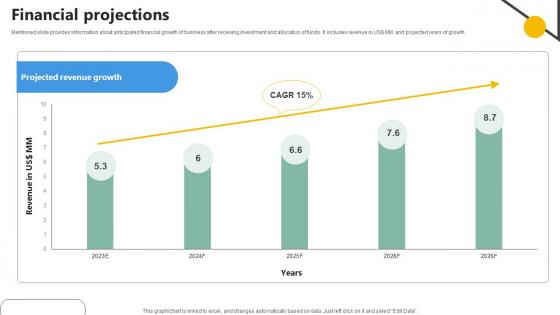
Financial Projections Analytics Company Investor Funding Elevator
Mentioned slide provides information about anticipated financial growth of business after receiving investment and allocation of funds. It includes revenue in USdollar MM and projected years of growthSlidegeeks has constructed Financial Projections Analytics Company Investor Funding Elevator after conducting extensive research and examination. These presentation templates are constantly being generated and modified based on user preferences and critiques from editors. Here, you will find the most attractive templates for a range of purposes while taking into account ratings and remarks from users regarding the content. This is an excellent jumping-off point to explore our content and will give new users an insight into our top-notch PowerPoint Templates. Mentioned slide provides information about anticipated financial growth of business after receiving investment and allocation of funds. It includes revenue in USdollar MM and projected years of growth
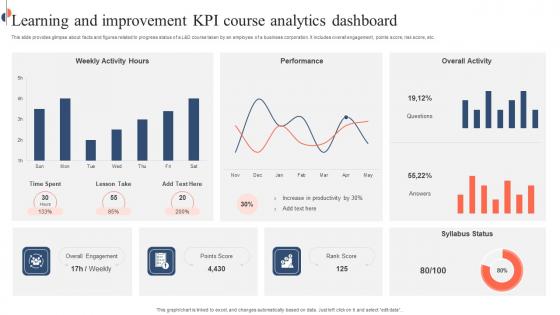
Learning And Improvement KPI Course Analytics Dashboard Inspiration Pdf
This slide provides glimpse about facts and figures related to progress status of a L and D course taken by an employee of a business corporation. It includes overall engagement, points score, risk score, etc. Showcasing this set of slides titled Learning And Improvement KPI Course Analytics Dashboard Inspiration Pdf. The topics addressed in these templates are Learning And Improvement KPI, Course Analytics Dashboard, Risk Score. All the content presented in this PPT design is completely editable. Download it and make adjustments in color, background, font etc. as per your unique business setting. This slide provides glimpse about facts and figures related to progress status of a L and D course taken by an employee of a business corporation. It includes overall engagement, points score, risk score, etc.
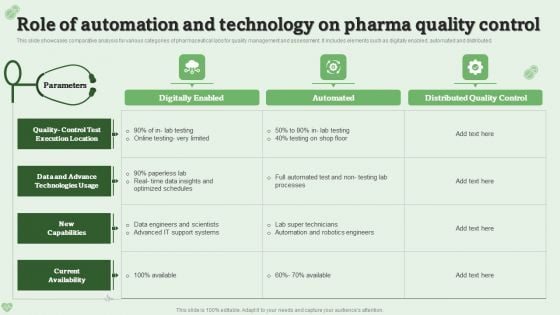
Role Of Automation And Technology On Pharma Quality Control Ppt PowerPoint Presentation Gallery Backgrounds PDF
This slide showcases comparative analysis for various categories of pharmaceutical labs for quality management and assessment. It includes elements such as digitally enabled, automated and distributed. Showcasing this set of slides titled Role Of Automation And Technology On Pharma Quality Control Ppt PowerPoint Presentation Gallery Backgrounds PDF. The topics addressed in these templates are Data Engineers, Current Availability, Quality Control. All the content presented in this PPT design is completely editable. Download it and make adjustments in color, background, font etc. as per your unique business setting.
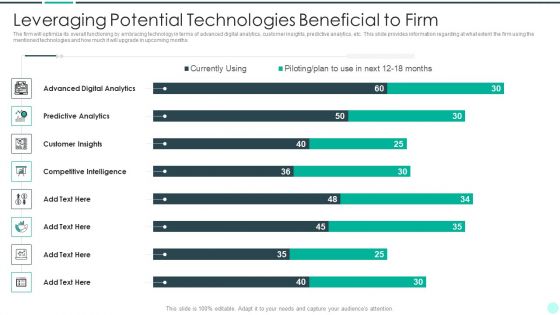
Executing Advance Data Analytics At Workspace Leveraging Potential Technologies Rules PDF
The firm will optimize its overall functioning by embracing technology in terms of advanced digital analytics, customer insights, predictive analytics, etc. This slide provides information regarding at what extent the firm using the mentioned technologies and how much it will upgrade in upcoming months. Deliver and pitch your topic in the best possible manner with this executing advance data analytics at workspace leveraging potential technologies rules pdf. Use them to share invaluable insights on leveraging potential technologies beneficial to firm and impress your audience. This template can be altered and modified as per your expectations. So, grab it now.
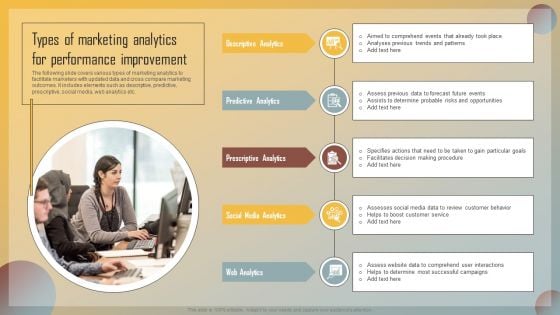
Guide For Marketing Analytics To Improve Decisions Types Of Marketing Analytics For Performance Improvement Demonstration PDF
The following slide covers various types of marketing analytics to facilitate marketers with updated data and cross compare marketing outcomes. It includes elements such as descriptive, predictive, prescriptive, social media, web analytics etc. Retrieve professionally designed Guide For Marketing Analytics To Improve Decisions Types Of Marketing Analytics For Performance Improvement Demonstration PDF to effectively convey your message and captivate your listeners. Save time by selecting pre made slideshows that are appropriate for various topics, from business to educational purposes. These themes come in many different styles, from creative to corporate, and all of them are easily adjustable and can be edited quickly. Access them as PowerPoint templates or as Google Slides themes. You do not have to go on a hunt for the perfect presentation because Slidegeeks got you covered from everywhere.
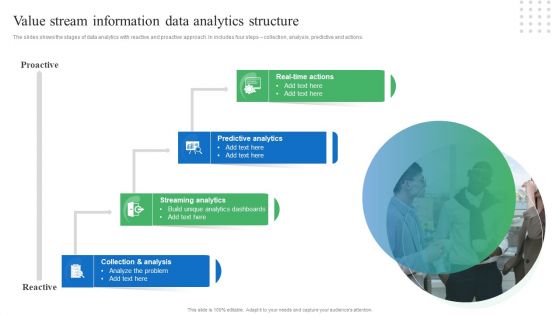
Toolkit For Data Science And Analytics Transition Value Stream Information Data Analytics Structure Sample PDF
The slides shows the stages of data analytics with reactive and proactive approach. In includes four steps collection, analysis, predictive and actions. Retrieve professionally designed Toolkit For Data Science And Analytics Transition Value Stream Information Data Analytics Structure Sample PDF to effectively convey your message and captivate your listeners. Save time by selecting pre made slideshows that are appropriate for various topics, from business to educational purposes. These themes come in many different styles, from creative to corporate, and all of them are easily adjustable and can be edited quickly. Access them as PowerPoint templates or as Google Slides themes. You do not have to go on a hunt for the perfect presentation because Slidegeeks got you covered from everywhere.
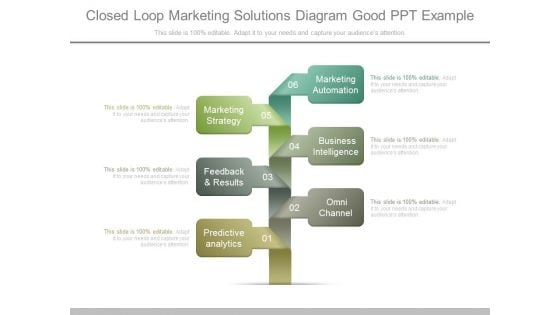
Closed Loop Marketing Solutions Diagram Good Ppt Example
This is a closed loop marketing solutions diagram good ppt example. This is a six stage process. The stages in this process are marketing automation, business intelligence, omnichannel, predictive analytics, feedback and results, marketing strategy.
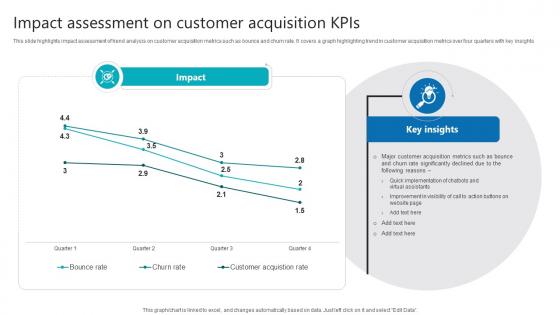
Impact Assessment On Customer Acquisition Kpis Product Analytics Implementation Data Analytics V
This slide highlights impact assessment of trend analysis on customer acquisition metrics such as bounce and churn rate. It covers a graph highlighting trend in customer acquisition metrics over four quarters with key insights The Impact Assessment On Customer Acquisition Kpis Product Analytics Implementation Data Analytics V is a compilation of the most recent design trends as a series of slides. It is suitable for any subject or industry presentation, containing attractive visuals and photo spots for businesses to clearly express their messages. This template contains a variety of slides for the user to input data, such as structures to contrast two elements, bullet points, and slides for written information. Slidegeeks is prepared to create an impression. This slide highlights impact assessment of trend analysis on customer acquisition metrics such as bounce and churn rate. It covers a graph highlighting trend in customer acquisition metrics over four quarters with key insights
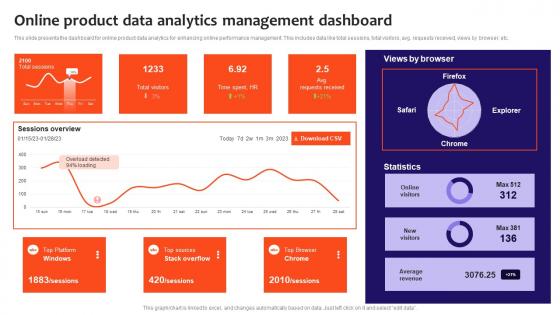
Online Product Data Analytics Management Dashboard Information Pdf
This slide presents the dashboard for online product data analytics for enhancing online performance management. This includes data like total sessions, total visitors, avg. requests received, views by browser, etc. Showcasing this set of slides titled Online Product Data Analytics Management Dashboard Information Pdf. The topics addressed in these templates are Online Product Data Analytics, Management Dashboard. All the content presented in this PPT design is completely editable. Download it and make adjustments in color, background, font etc. as per your unique business setting. This slide presents the dashboard for online product data analytics for enhancing online performance management. This includes data like total sessions, total visitors, avg. requests received, views by browser, etc.
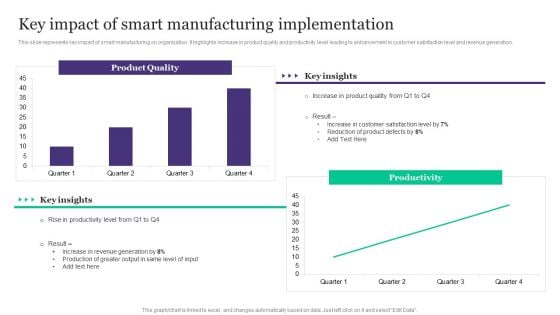
Deployment Of Automated Production Technology Key Impact Of Smart Manufacturing Implementation Portrait PDF
This slide represents key impact of smart manufacturing on organization. It highlights increase in product quality and productivity level leading to enhancement in customer satisfaction level and revenue generation.Crafting an eye-catching presentation has never been more straightforward. Let your presentation shine with this tasteful yet straightforward Deployment Of Automated Production Technology Key Impact Of Smart Manufacturing Implementation Portrait PDF template. It offers a minimalistic and classy look that is great for making a statement. The colors have been employed intelligently to add a bit of playfulness while still remaining professional. Construct the ideal Deployment Of Automated Production Technology Key Impact Of Smart Manufacturing Implementation Portrait PDF that effortlessly grabs the attention of your audience Begin now and be certain to wow your customers.
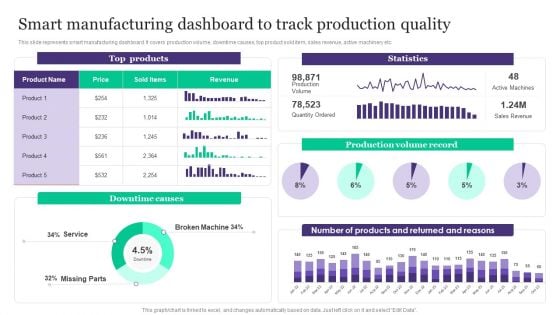
Deployment Of Automated Production Technology Smart Manufacturing Dashboard To Track Production Quality Template PDF
This slide represents smart manufacturing dashboard. It covers production volume, downtime causes, top product sold item, sales revenue, active machinery etc.Explore a selection of the finest Deployment Of Automated Production Technology Smart Manufacturing Dashboard To Track Production Quality Template PDF here. With a plethora of professionally designed and pre-made slide templates, you can quickly and easily find the right one for your upcoming presentation. You can use our Deployment Of Automated Production Technology Smart Manufacturing Dashboard To Track Production Quality Template PDF to effectively convey your message to a wider audience. Slidegeeks has done a lot of research before preparing these presentation templates. The content can be personalized and the slides are highly editable. Grab templates today from Slidegeeks.
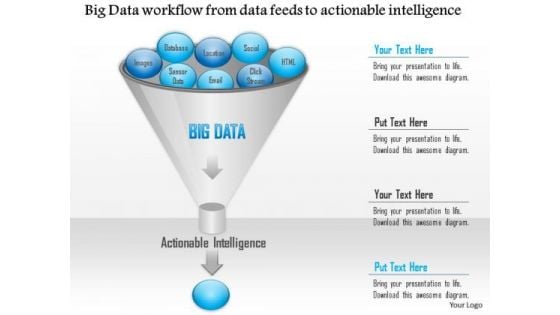
Business Diagram Big Data Workflow From Data Feeds To Actionable Intelligence Ppt Slide
This diagram slide has been designed with graphic of workflow funnel diagram. This diagram depicts the data feeds to actionable intelligence. This funnel diagram can be used to depict concepts like big data, social, email and intelligence.
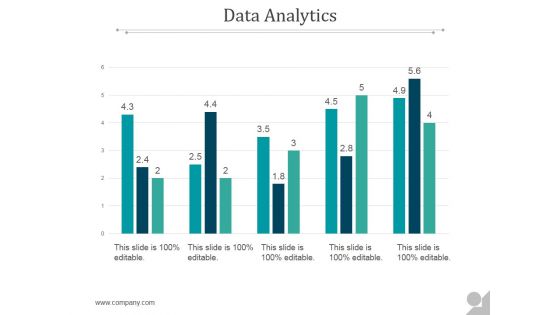
Data Analytics Ppt PowerPoint Presentation Themes
This is a data analytics ppt powerpoint presentation themes. This is a five stage process. The stages in this process are business, marketing, presentation, data analyst, management.
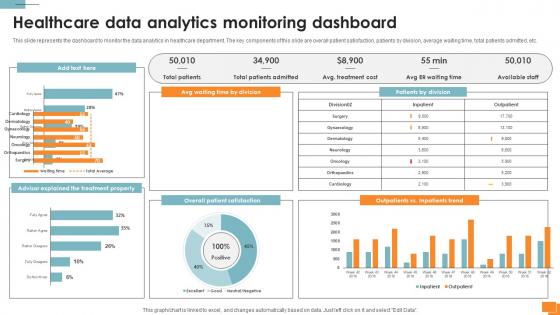
Statistical Tools For Evidence Healthcare Data Analytics Monitoring Dashboard
This slide represents the dashboard to monitor the data analytics in healthcare department. The key components of this slide are overall patient satisfaction, patients by division, average waiting time, total patients admitted, etc. Welcome to our selection of the Statistical Tools For Evidence Healthcare Data Analytics Monitoring Dashboard. These are designed to help you showcase your creativity and bring your sphere to life. Planning and Innovation are essential for any business that is just starting out. This collection contains the designs that you need for your everyday presentations. All of our PowerPoints are 100Percent editable, so you can customize them to suit your needs. This multi-purpose template can be used in various situations. Grab these presentation templates today. This slide represents the dashboard to monitor the data analytics in healthcare department. The key components of this slide are overall patient satisfaction, patients by division, average waiting time, total patients admitted, etc.
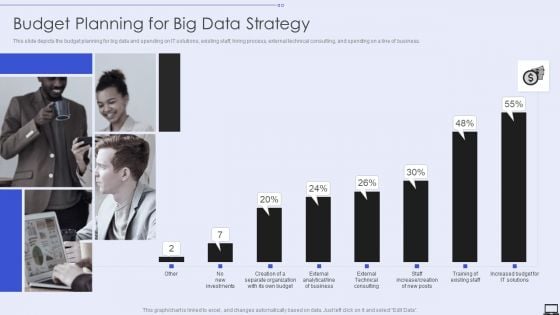
Budget Planning For Big Data Strategy Ppt PowerPoint Presentation File Example PDF
This slide depicts the budget planning for big data and spending on IT solutions, existing staff, hiring process, external technical consulting, and spending on a line of business. Deliver an awe inspiring pitch with this creative Budget Planning For Big Data Strategy Ppt PowerPoint Presentation File Example PDF bundle. Topics like External Analytical, External Technical Consulting, Investments can be discussed with this completely editable template. It is available for immediate download depending on the needs and requirements of the user.
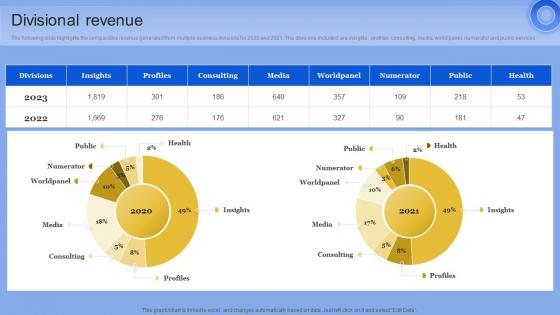
Divisional Revenue Data Analytics Company Outline Pictures PDF
The following slide highlights the comparative revenue generated from multiple business divisions for 2020 and 2021. The divisions included are insights, profiles, consulting, media, world panel, numerator and public services From laying roadmaps to briefing everything in detail, our templates are perfect for you. You can set the stage with your presentation slides. All you have to do is download these easy-to-edit and customizable templates. Divisional Revenue Data Analytics Company Outline Pictures PDF will help you deliver an outstanding performance that everyone would remember and praise you for. Do download this presentation today. The following slide highlights the comparative revenue generated from multiple business divisions for 2020 and 2021. The divisions included are insights, profiles, consulting, media, world panel, numerator and public services
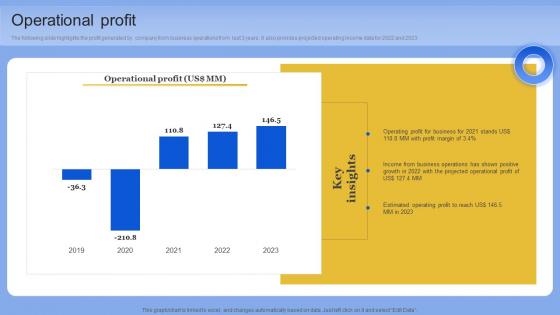
Operational Profit Data Analytics Company Outline Pictures PDF
The following slide highlights the profit generated by company from business operations from last 3 years. It also provides projected operating income data for 2022 and 2023. Slidegeeks has constructed Operational Profit Data Analytics Company Outline Pictures PDF after conducting extensive research and examination. These presentation templates are constantly being generated and modified based on user preferences and critiques from editors. Here, you will find the most attractive templates for a range of purposes while taking into account ratings and remarks from users regarding the content. This is an excellent jumping-off point to explore our content and will give new users an insight into our top-notch PowerPoint Templates. The following slide highlights the profit generated by company from business operations from last 3 years. It also provides projected operating income data for 2022 and 2023
Allocation Of Funds Analytics Company Investor Funding Elevator
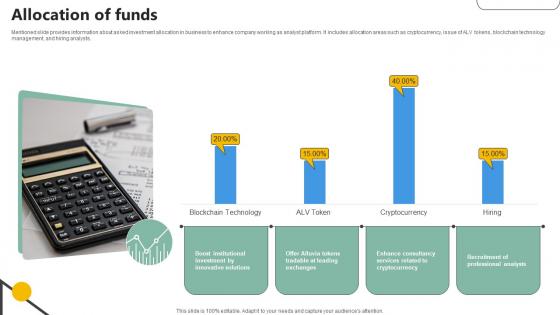
Mentioned slide provides information about asked investment allocation in business to enhance company working as analyst platform. It includes allocation areas such as cryptocurrency, issue of ALV tokens, blockchain technology management, and hiring analysts.Find a pre-designed and impeccable Allocation Of Funds Analytics Company Investor Funding Elevator. The templates can ace your presentation without additional effort. You can download these easy-to-edit presentation templates to make your presentation stand out from others. So, what are you waiting for Download the template from Slidegeeks today and give a unique touch to your presentation. Mentioned slide provides information about asked investment allocation in business to enhance company working as analyst platform. It includes allocation areas such as cryptocurrency, issue of ALV tokens, blockchain technology management, and hiring analysts.

Table Of Prescriptive Model Deployment Timeline Data Analytics SS V
This slide provides a deployment table of prescriptive model aimed at highlighting movement of models through various phases. The basis of deployment are stage, start and end date, manager name with resources utilized.The Table Of Prescriptive Model Deployment Timeline Data Analytics SS V is a compilation of the most recent design trends as a series of slides. It is suitable for any subject or industry presentation, containing attractive visuals and photo spots for businesses to clearly express their messages. This template contains a variety of slides for the user to input data, such as structures to contrast two elements, bullet points, and slides for written information. Slidegeeks is prepared to create an impression. This slide provides a deployment table of prescriptive model aimed at highlighting movement of models through various phases. The basis of deployment are stage, start and end date, manager name with resources utilized.
Customer Generated Content Marketing Automation Ppt Design
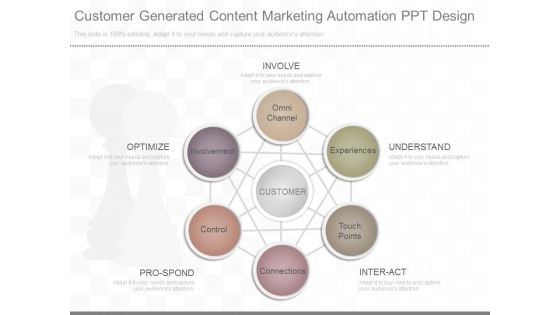
This is a customer generated content marketing automation ppt design. This is a six stage process. The stages in this process are omni channel, involvement, control, connections, touch points, experiences, customer.
Deployment Of Automated Production Technology Smart Manufacturing Dashboard For Inventory Management Brochure PDF
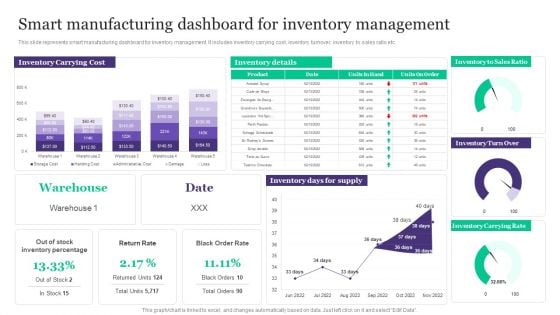
This slide represents smart manufacturing dashboard for inventory management. It includes inventory carrying cost, inventory turnover, inventory to sales ratio etc.Welcome to our selection of the Deployment Of Automated Production Technology Smart Manufacturing Dashboard For Inventory Management Brochure PDF. These are designed to help you showcase your creativity and bring your sphere to life. Planning and Innovation are essential for any business that is just starting out. This collection contains the designs that you need for your everyday presentations. All of our PowerPoints are 100 precent editable, so you can customize them to suit your needs. This multi-purpose template can be used in various situations. Grab these presentation templates today.


 Continue with Email

 Home
Home


