Analytics Framework
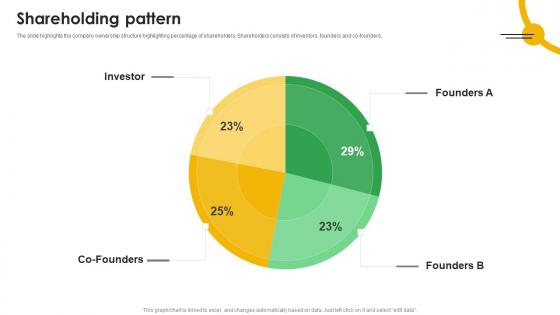
Shareholding Pattern Mobile App Analytics Company Fund Raising Pitch Deck Microsoft Pdf
The slide highlights the company ownership structure highlighting percentage of shareholders. Shareholders consists of investors, founders and co founders. If your project calls for a presentation, then Slidegeeks is your go to partner because we have professionally designed, easy to edit templates that are perfect for any presentation. After downloading, you can easily edit Shareholding Pattern Mobile App Analytics Company Fund Raising Pitch Deck Microsoft Pdf and make the changes accordingly. You can rearrange slides or fill them with different images. Check out all the handy templates The slide highlights the company ownership structure highlighting percentage of shareholders. Shareholders consists of investors, founders and co founders.
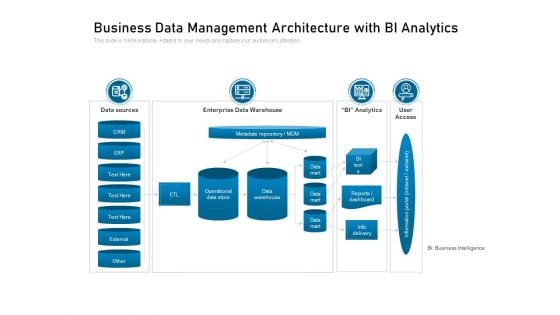
Business Data Management Architecture With BI Analytics Ppt PowerPoint Presentation File Ideas PDF
Showcasing this set of slides titled business data management architecture with bi analytics ppt powerpoint presentation file ideas pdf. The topics addressed in these templates are data sources, analytics, business. All the content presented in this PPT design is completely editable. Download it and make adjustments in color, background, font etc. as per your unique business setting.
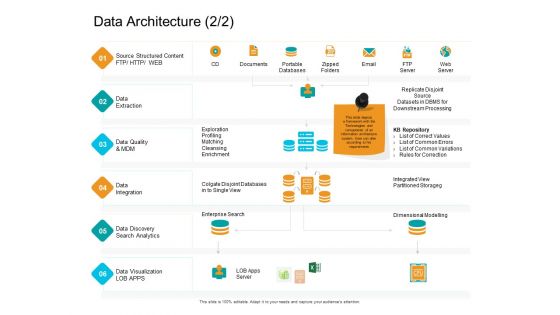
Facts Assessment Data Architecture Analytics Ppt PowerPoint Presentation Professional Templates PDF
Presenting this set of slides with name facts assessment data architecture analytics ppt powerpoint presentation professional templates pdf. This is a one stage process. The stages in this process are data extraction, data quality and mdm, data integration, enterprise search, data discovery search analytics. This is a completely editable PowerPoint presentation and is available for immediate download. Download now and impress your audience.
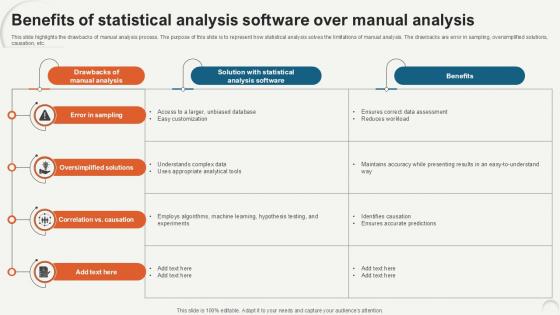
Benefits Of Statistical Analysis Data Analytics For Informed Decision Ppt Slide
This slide highlights the drawbacks of manual analysis process. The purpose of this slide is to represent how statistical analysis solves the limitations of manual analysis. The drawbacks are error in sampling, oversimplified solutions, causation, etc. Slidegeeks is one of the best resources for PowerPoint templates. You can download easily and regulate Benefits Of Statistical Analysis Data Analytics For Informed Decision Ppt Slide for your personal presentations from our wonderful collection. A few clicks is all it takes to discover and get the most relevant and appropriate templates. Use our Templates to add a unique zing and appeal to your presentation and meetings. All the slides are easy to edit and you can use them even for advertisement purposes. This slide highlights the drawbacks of manual analysis process. The purpose of this slide is to represent how statistical analysis solves the limitations of manual analysis. The drawbacks are error in sampling, oversimplified solutions, causation, etc.
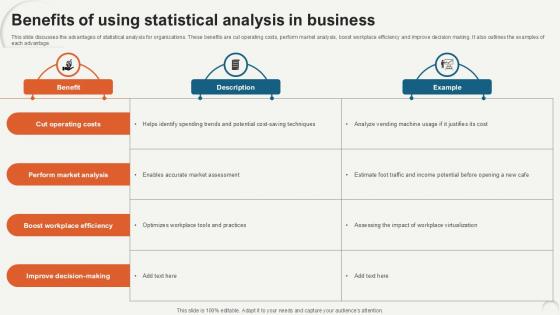
Benefits Of Using Statistical Data Analytics For Informed Decision Ppt PowerPoint
This slide discusses the advantages of statistical analysis for organizations. These benefits are cut operating costs, perform market analysis, boost workplace efficiency and improve decision making. It also outlines the examples of each advantage. Want to ace your presentation in front of a live audience Our Benefits Of Using Statistical Data Analytics For Informed Decision Ppt PowerPoint can help you do that by engaging all the users towards you. Slidegeeks experts have put their efforts and expertise into creating these impeccable powerpoint presentations so that you can communicate your ideas clearly. Moreover, all the templates are customizable, and easy-to-edit and downloadable. Use these for both personal and commercial use. This slide discusses the advantages of statistical analysis for organizations. These benefits are cut operating costs, perform market analysis, boost workplace efficiency and improve decision making. It also outlines the examples of each advantage.

Firm Productivity Administration Advanced Analytics Methods Ppt PowerPoint Presentation Model Tips PDF
Presenting this set of slides with name firm productivity administration advanced analytics methods ppt powerpoint presentation model tips pdf. The topics discussed in these slides are methods, application, reliability rating, arithmetic counters, regression analysis, text analytics. This is a completely editable PowerPoint presentation and is available for immediate download. Download now and impress your audience.
Interactive Dashboard For Website Analytics Vector Icon Ppt PowerPoint Presentation Icon Background Images PDF
Showcasing this set of slides titled interactive dashboard for website analytics vector icon ppt powerpoint presentation icon background images pdf. The topics addressed in these templates are interactive dashboard for website analytics vector icon. All the content presented in this PPT design is completely editable. Download it and make adjustments in color, background, font etc. as per your unique business setting.
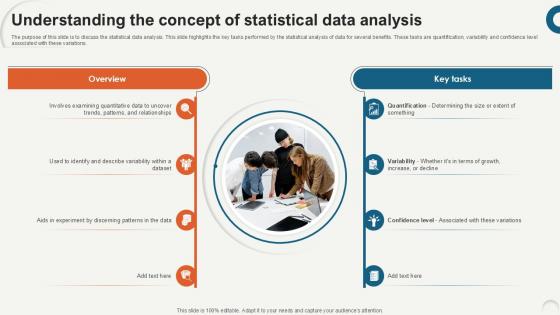
Understanding The Concept Of Data Analytics For Informed Decision Ppt Template
The purpose of this slide is to discuss the statistical data analysis. This slide highlights the key tasks performed by the statistical analysis of data for several benefits. These tasks are quantification, variability and confidence level associated with these variations. Do you have an important presentation coming up Are you looking for something that will make your presentation stand out from the rest Look no further than Understanding The Concept Of Data Analytics For Informed Decision Ppt Template. With our professional designs, you can trust that your presentation will pop and make delivering it a smooth process. And with Slidegeeks, you can trust that your presentation will be unique and memorable. So why wait Grab Understanding The Concept Of Data Analytics For Informed Decision Ppt Template today and make your presentation stand out from the rest The purpose of this slide is to discuss the statistical data analysis. This slide highlights the key tasks performed by the statistical analysis of data for several benefits. These tasks are quantification, variability and confidence level associated with these variations.
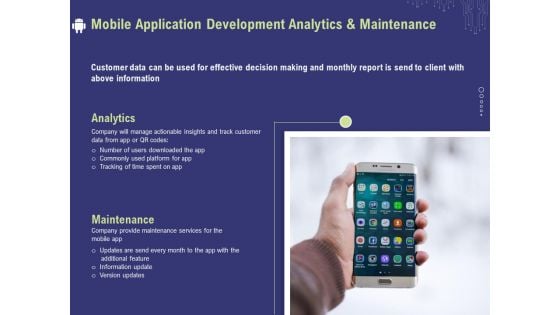
Develop Cellphone Apps Mobile Application Development Analytics And Maintenance Ppt PowerPoint Presentation Ideas PDF
Presenting this set of slides with name develop cellphone apps mobile application development analytics and maintenance ppt powerpoint presentation ideas pdf. This is a one stage process. The stages in this process are analytics, maintenance, qr codes, version updates, information update. This is a completely editable PowerPoint presentation and is available for immediate download. Download now and impress your audience.
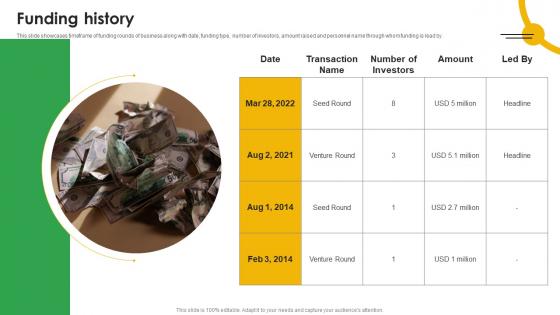
Funding History Mobile App Analytics Company Fund Raising Pitch Deck Download Pdf
This slide showcases timeframe of funding rounds of business along with date, funding type, number of investors, amount raised and personnel name through whom funding is lead by. Slidegeeks is one of the best resources for PowerPoint templates. You can download easily and regulate Funding History Mobile App Analytics Company Fund Raising Pitch Deck Download Pdf for your personal presentations from our wonderful collection. A few clicks is all it takes to discover and get the most relevant and appropriate templates. Use our Templates to add a unique zing and appeal to your presentation and meetings. All the slides are easy to edit and you can use them even for advertisement purposes. This slide showcases timeframe of funding rounds of business along with date, funding type, number of investors, amount raised and personnel name through whom funding is lead by.
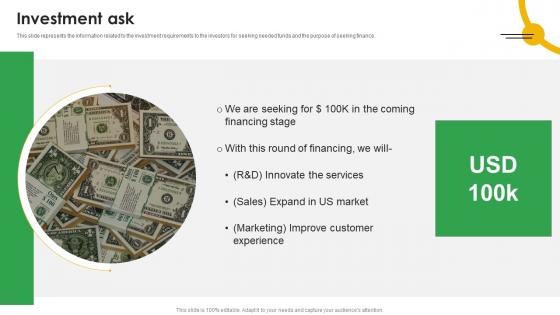
Investment Ask Mobile App Analytics Company Fund Raising Pitch Deck Formats Pdf
This slide represents the information related to the investment requirements to the investors for seeking needed funds and the purpose of seeking finance. Want to ace your presentation in front of a live audience Our Investment Ask Mobile App Analytics Company Fund Raising Pitch Deck Formats Pdf can help you do that by engaging all the users towards you. Slidegeeks experts have put their efforts and expertise into creating these impeccable powerpoint presentations so that you can communicate your ideas clearly. Moreover, all the templates are customizable, and easy to edit and downloadable. Use these for both personal and commercial use. This slide represents the information related to the investment requirements to the investors for seeking needed funds and the purpose of seeking finance.
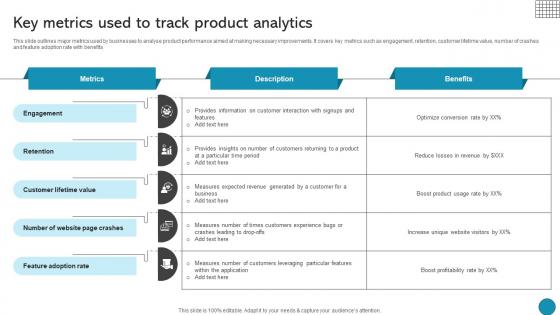
Key Metrics Used To Track Product Analytics Driving Business Success Integrating Product
This slide outlines major metrics used by businesses to analyse product performance aimed at making necessary improvements. It covers key metrics such as engagement, retention, customer lifetime value, number of crashes and feature adoption rate with benefits Find a pre-designed and impeccable Key Metrics Used To Track Product Analytics Driving Business Success Integrating Product. The templates can ace your presentation without additional effort. You can download these easy-to-edit presentation templates to make your presentation stand out from others. So, what are you waiting for Download the template from Slidegeeks today and give a unique touch to your presentation. This slide outlines major metrics used by businesses to analyse product performance aimed at making necessary improvements. It covers key metrics such as engagement, retention, customer lifetime value, number of crashes and feature adoption rate with benefits
Predictive Analytics Marketing Planning Ppt PowerPoint Presentation Gallery Background Designs Cpb
Presenting this set of slides with name predictive analytics marketing planning ppt powerpoint presentation gallery background designs cpb. This is a five stage process. The stages in this process are predictive analytics marketing planning. This is a completely editable PowerPoint presentation and is available for immediate download. Download now and impress your audience.

Two Segments Layout For Analytics Software Comparison Ppt PowerPoint Presentation Portfolio Graphics Pictures PDF
Presenting two segments layout for analytics software comparison ppt powerpoint presentation portfolio graphics pictures pdf to dispense important information. This template comprises two stages. It also presents valuable insights into the topics including two segments layout for analytics software comparison. This is a completely customizable PowerPoint theme that can be put to use immediately. So, download it and address the topic impactfully.
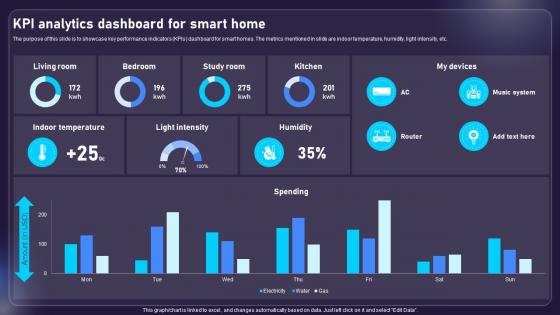
Kpi Analytics Dashboard For Smart Home AIOT Applications For Various Industries IoT SS V
The purpose of this slide is to showcase key performance indicators KPIs dashboard for smart homes. The metrics mentioned in slide are indoor temperature, humidity, light intensity, etc. Slidegeeks has constructed Kpi Analytics Dashboard For Smart Home AIOT Applications For Various Industries IoT SS V after conducting extensive research and examination. These presentation templates are constantly being generated and modified based on user preferences and critiques from editors. Here, you will find the most attractive templates for a range of purposes while taking into account ratings and remarks from users regarding the content. This is an excellent jumping-off point to explore our content and will give new users an insight into our top-notch PowerPoint Templates. The purpose of this slide is to showcase key performance indicators KPIs dashboard for smart homes. The metrics mentioned in slide are indoor temperature, humidity, light intensity, etc.
Benefits Offered By Analytics System To Business Ppt PowerPoint Presentation Professional Icon PDF
Presenting benefits offered by analytics system to business ppt powerpoint presentation professional icon pdf to dispense important information. This template comprises four stages. It also presents valuable insights into the topics including predictive modeling, better decision making, more accessible analytics. This is a completely customizable PowerPoint theme that can be put to use immediately. So, download it and address the topic impactfully.

Timeline To Conduct Statistical Data Analytics For Informed Decision Ppt Presentation
This slide shows the timeline for performing statistical data analysis. The key steps include writing hypothesis and plan research design, collect data from a sample, summarize data with descriptive statistics, test hypotheses, result interpretation, etc. Slidegeeks is here to make your presentations a breeze with Timeline To Conduct Statistical Data Analytics For Informed Decision Ppt Presentation With our easy-to-use and customizable templates, you can focus on delivering your ideas rather than worrying about formatting. With a variety of designs to choose from, you are sure to find one that suits your needs. And with animations and unique photos, illustrations, and fonts, you can make your presentation pop. So whether you are giving a sales pitch or presenting to the board, make sure to check out Slidegeeks first This slide shows the timeline for performing statistical data analysis. The key steps include writing hypothesis and plan research design, collect data from a sample, summarize data with descriptive statistics, test hypotheses, result interpretation, etc.
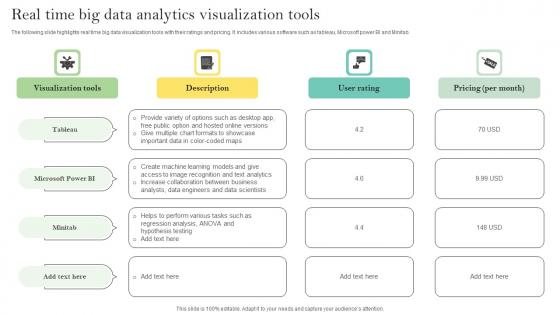
Real Time Big Data Analytics Visualization Tools Ppt Portfolio Example Pdf
The following slide highlights real time big data visualization tools with their ratings and pricing. It includes various software such as tableau, Microsoft power BI and Minitab. Pitch your topic with ease and precision using this Real Time Big Data Analytics Visualization Tools Ppt Portfolio Example Pdf. This layout presents information on Visualization Tools, User Rating, Pricing Per Month. It is also available for immediate download and adjustment. So, changes can be made in the color, design, graphics or any other component to create a unique layout. The following slide highlights real time big data visualization tools with their ratings and pricing. It includes various software such as tableau, Microsoft power BI and Minitab.
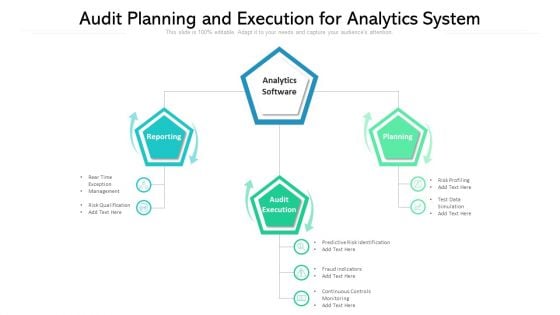
Audit Planning And Execution For Analytics System Ppt PowerPoint Presentation File Guide PDF
Presenting audit planning and execution for analytics system ppt powerpoint presentation file guide pdf to dispense important information. This template comprises three stages. It also presents valuable insights into the topics including analytics software, planning, continuous controls monitoring. This is a completely customizable PowerPoint theme that can be put to use immediately. So, download it and address the topic impactfully.
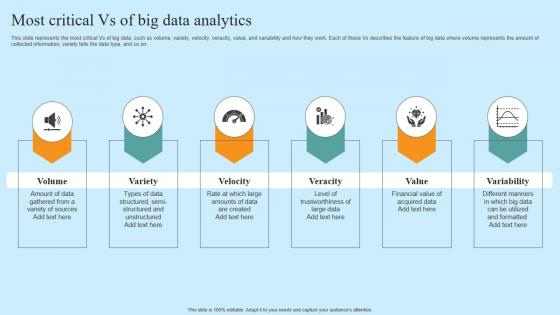
Most Critical Vs Of Big Data Analytics Hyper Automation Solutions Ideas Pdf
This slide depicts the overview of hyper-automation testing that consists of three components, including Selenium Integration, data protection authority DPA and robotic process automation RPA and artificial intelligence and machine learning. If you are looking for a format to display your unique thoughts, then the professionally designed Most Critical Vs Of Big Data Analytics Hyper Automation Solutions Ideas Pdf is the one for you. You can use it as a Google Slides template or a PowerPoint template. Incorporate impressive visuals, symbols, images, and other charts. Modify or reorganize the text boxes as you desire. Experiment with shade schemes and font pairings. Alter, share or cooperate with other people on your work. Download Most Critical Vs Of Big Data Analytics Hyper Automation Solutions Ideas Pdf and find out how to give a successful presentation. Present a perfect display to your team and make your presentation unforgettable. This slide depicts the overview of hyper-automation testing that consists of three components, including Selenium Integration, data protection authority DPA and robotic process automation RPA and artificial intelligence and machine learning.
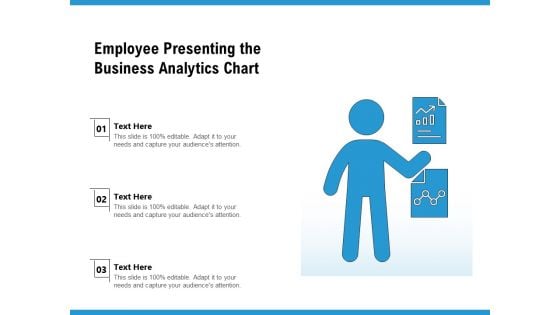
Employee Presenting The Business Analytics Chart Ppt PowerPoint Presentation Model Layouts PDF
Pitch your topic with ease and precision using this employee presenting the business analytics chart ppt powerpoint presentation model layouts pdf. This layout presents information on employee presenting the business analytics chart. It is also available for immediate download and adjustment. So, changes can be made in the color, design, graphics or any other component to create a unique layout.
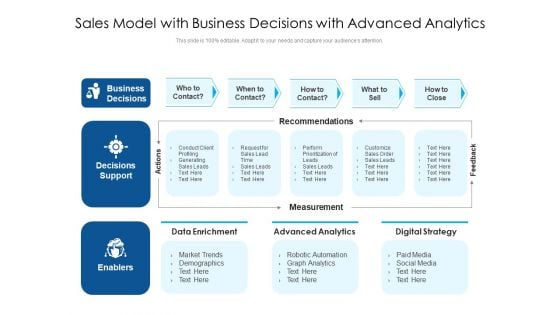
Sales Model With Business Decisions With Advanced Analytics Ppt PowerPoint Presentation Professional Slide PDF
Pitch your topic with ease and precision using this sales model with business decisions with advanced analytics ppt powerpoint presentation professional slide pdf. This layout presents information on data enrichment, advanced analytics, digital strategy. It is also available for immediate download and adjustment. So, changes can be made in the color, design, graphics or any other component to create a unique layout.
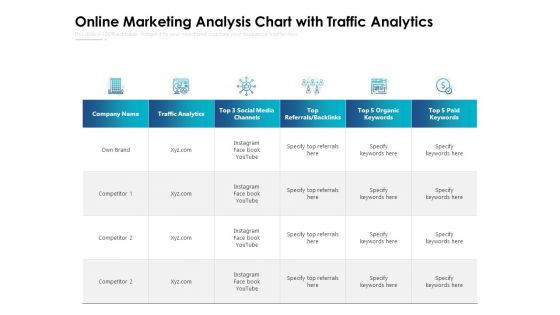
Online Marketing Analysis Chart With Traffic Analytics Ppt PowerPoint Presentation File Elements PDF
Presenting this set of slides with name online marketing analysis chart with traffic analytics ppt powerpoint presentation file elements pdf. The topics discussed in these slides are traffic, analytics, social media. This is a completely editable PowerPoint presentation and is available for immediate download. Download now and impress your audience.
Operations Weak Point Analytics Icon With Gear And Question Mark Diagrams PDF
Presenting Operations Weak Point Analytics Icon With Gear And Question Mark Diagrams PDF to dispense important information. This template comprises three stages. It also presents valuable insights into the topics including Operations Weak, Point, Analytics. This is a completely customizable PowerPoint theme that can be put to use immediately. So, download it and address the topic impactfully.
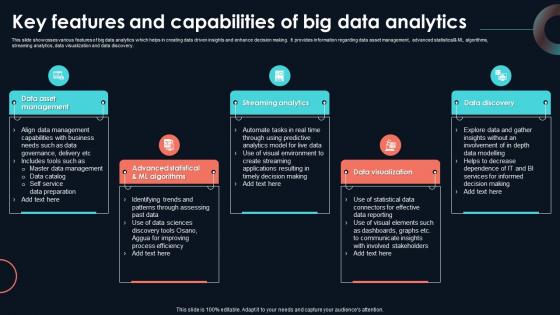
Key Features And Capabilities Of Big Data Developing Strategic Insights Using Big Data Analytics SS V
This slide showcases various features of big data analytics which helps in creating data driven insights and enhance decision making. It provides information regarding data asset management, advanced statisticalAnd ML algorithms, streaming analytics, data visualization and data discovery. From laying roadmaps to briefing everything in detail, our templates are perfect for you. You can set the stage with your presentation slides. All you have to do is download these easy-to-edit and customizable templates. Key Features And Capabilities Of Big Data Developing Strategic Insights Using Big Data Analytics SS V will help you deliver an outstanding performance that everyone would remember and praise you for. Do download this presentation today. This slide showcases various features of big data analytics which helps in creating data driven insights and enhance decision making. It provides information regarding data asset management, advanced statisticaland ML algorithms, streaming analytics, data visualization and data discovery.
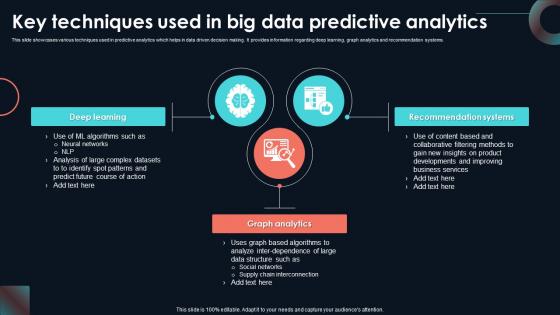
Key Techniques Used In Big Data Predictive Developing Strategic Insights Using Big Data Analytics SS V
This slide showcases various techniques used in predictive analytics which helps in data driven decision making. It provides information regarding deep learning, graph analytics and recommendation systems. Are you in need of a template that can accommodate all of your creative concepts This one is crafted professionally and can be altered to fit any style. Use it with Google Slides or PowerPoint. Include striking photographs, symbols, depictions, and other visuals. Fill, move around, or remove text boxes as desired. Test out color palettes and font mixtures. Edit and save your work, or work with colleagues. Download Key Techniques Used In Big Data Predictive Developing Strategic Insights Using Big Data Analytics SS V and observe how to make your presentation outstanding. Give an impeccable presentation to your group and make your presentation unforgettable. This slide showcases various techniques used in predictive analytics which helps in data driven decision making. It provides information regarding deep learning, graph analytics and recommendation systems.
Facts Assessment Advanced Analytics Methods Ppt PowerPoint Presentation Show Graphic Images PDF
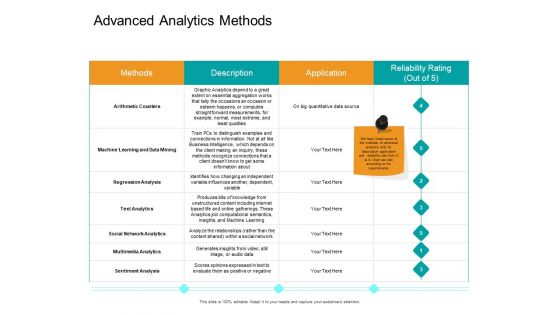
Presenting this set of slides with name facts assessment advanced analytics methods ppt powerpoint presentation show graphic images pdf. The topics discussed in these slides are methods, application, reliability rating, arithmetic counters, regression analysis, text analytics. This is a completely editable PowerPoint presentation and is available for immediate download. Download now and impress your audience.
Enterprise Problem Solving And Intellect Advanced Analytics Methods Ppt PowerPoint Presentation Slides Infographics PDF
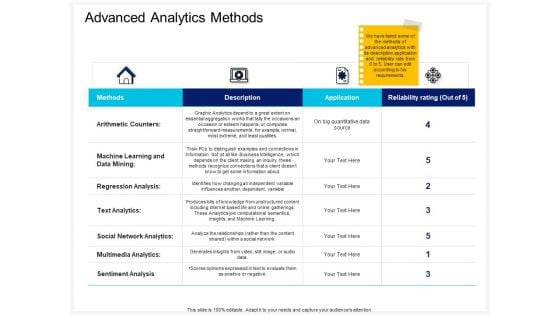
Presenting this set of slides with name enterprise problem solving and intellect advanced analytics methods ppt powerpoint presentation slides infographics pdf. The topics discussed in these slides are methods, application, reliability rating, arithmetic counters, regression analysis, text analytics. This is a completely editable PowerPoint presentation and is available for immediate download. Download now and impress your audience.
PPDAC Cycle Of Statistical Data Analytics For Informed Decision Ppt Template
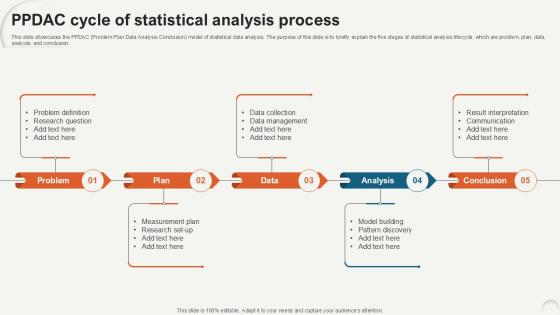
This slide showcases the PPDAC Problem Plan Data Analysis Conclusion model of statistical data analysis. The purpose of this slide is to briefly explain the five stages of statistical analysis lifecycle, which are problem, plan, data, analysis, and conclusion. Are you searching for a PPDAC Cycle Of Statistical Data Analytics For Informed Decision Ppt Template that is uncluttered, straightforward, and original Its easy to edit, and you can change the colors to suit your personal or business branding. For a presentation that expresses how much effort you have put in, this template is ideal With all of its features, including tables, diagrams, statistics, and lists, its perfect for a business plan presentation. Make your ideas more appealing with these professional slides. Download PPDAC Cycle Of Statistical Data Analytics For Informed Decision Ppt Template from Slidegeeks today. This slide showcases the PPDAC Problem Plan Data Analysis Conclusion model of statistical data analysis. The purpose of this slide is to briefly explain the five stages of statistical analysis lifecycle, which are problem, plan, data, analysis, and conclusion.
Audit Risk Assessment Icon Showing Annual Taxes And Web Analytics Ppt PowerPoint Presentation Slides Model PDF
Presenting this set of slides with name audit risk assessment icon showing annual taxes and web analytics ppt powerpoint presentation slides model pdf. This is a three stage process. The stages in this process are audit risk assessment icon showing annual taxes and web analytics. This is a completely editable PowerPoint presentation and is available for immediate download. Download now and impress your audience.
Dashboard Showing Business Analytics Vector Icon Ppt PowerPoint Presentation Model Templates PDF
Presenting dashboard showing business analytics vector icon ppt powerpoint presentation model templates pdf to dispense important information. This template comprises three stages. It also presents valuable insights into the topics including dashboard showing business analytics vector icon. This is a completely customizable PowerPoint theme that can be put to use immediately. So, download it and address the topic impactfully.
Predictive Analytics Intent Marketing Ppt PowerPoint Presentation Summary Graphics Design Cpb
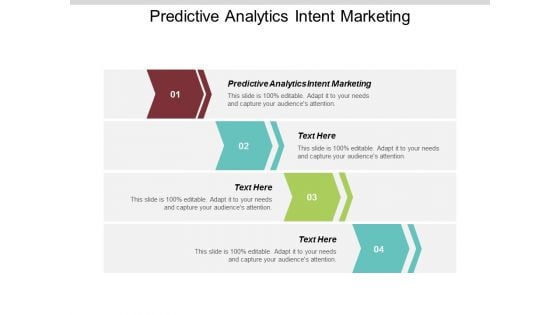
Presenting this set of slides with name predictive analytics intent marketing ppt powerpoint presentation summary graphics design cpb. This is a four stage process. The stages in this process are predictive analytics intent marketing. This is a completely editable PowerPoint presentation and is available for immediate download. Download now and impress your audience.
Online Business Analytics Vector Icon Ppt PowerPoint Presentation Professional Design Templates PDF
Presenting this set of slides with name online business analytics vector icon ppt powerpoint presentation professional design templates pdf. The topics discussed in these slide is online business analytics vector icon. This is a completely editable PowerPoint presentation and is available for immediate download. Download now and impress your audience.
Charts And Graphs For Business Analytics Ppt PowerPoint Presentation File Background Designs PDF
Presenting this set of slides with name charts and graphs for business analytics ppt powerpoint presentation file background designs pdf. The topics discussed in these slide is charts and graphs for business analytics. This is a completely editable PowerPoint presentation and is available for immediate download. Download now and impress your audience.
Business Analytics Chart On Screen Vector Icon Ppt PowerPoint Presentation Design Ideas PDF
Presenting this set of slides with name business analytics chart on screen vector icon ppt powerpoint presentation design ideas pdf. This is a one stage process. The stage in this process is business analytics chart on screen vector icon. This is a completely editable PowerPoint presentation and is available for immediate download. Download now and impress your audience.
Advantages Of Self Service Analytics With Icons Ppt PowerPoint Presentation File Background Designs PDF
Presenting advantages of self service analytics with icons ppt powerpoint presentation file background designs pdf to dispense important information. This template comprises four stages. It also presents valuable insights into the topics including advantages of self service analytics with icons. This is a completely customizable PowerPoint theme that can be put to use immediately. So, download it and address the topic impactfully.
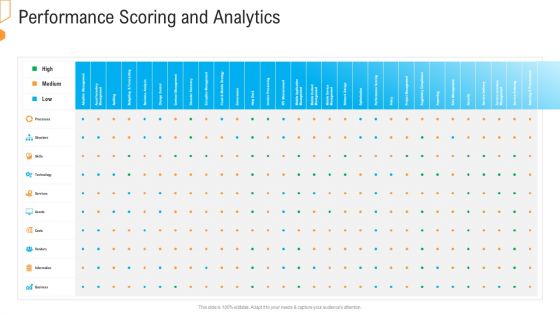
Civil Infrastructure Designing Services Management Performance Scoring And Analytics Clipart PDF
Deliver an awe inspiring pitch with this creative civil infrastructure designing services management performance scoring and analytics clipart pdf bundle. Topics like performance scoring and analytics can be discussed with this completely editable template. It is available for immediate download depending on the needs and requirements of the user.
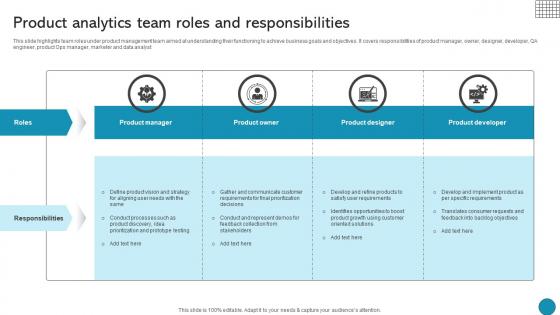
Product Analytics Team Roles And Responsibilities Driving Business Success Integrating Product
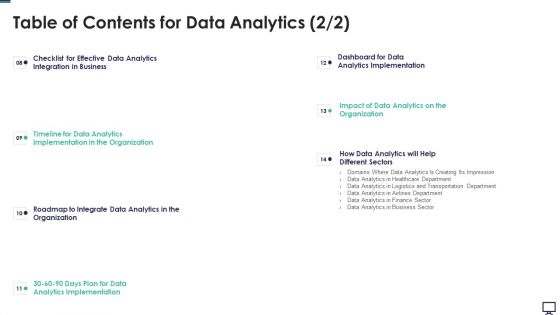
Table Of Contents For Data Analytics Business Ppt Show Demonstration PDF
Deliver an awe inspiring pitch with this creative table of contents for data analytics business ppt show demonstration pdf bundle. Topics like business, data analytics, organization, implementation, dashboard can be discussed with this completely editable template. It is available for immediate download depending on the needs and requirements of the user.
B2b Sales Plan Image For Predictive Analytics Promotions Ppt PowerPoint Presentation Infographic Template Images PDF
Presenting b2b sales plan image for predictive analytics promotions ppt powerpoint presentation infographic template images pdf to dispense important information. This template comprises one stage. It also presents valuable insights into the topics including b2b sales plan image for predictive analytics promotions. This is a completely customizable PowerPoint theme that can be put to use immediately. So, download it and address the topic impactfully.
Sales Analytics For Forecasting And Planning Icon Ppt Powerpoint Presentation Show Pdf
Presenting sales analytics for forecasting and planning icon ppt powerpoint presentation show pdf to dispense important information. This template comprises three stages. It also presents valuable insights into the topics including sales analytics for forecasting and planning icon. This is a completely customizable PowerPoint theme that can be put to use immediately. So, download it and address the topic impactfully.
Enterprise Resource Planning Icon With Analytics And Monitoring Ppt PowerPoint Presentation File Images PDF
Presenting enterprise resource planning icon with analytics and monitoring ppt powerpoint presentation file images pdf to dispense important information. This template comprises three stages. It also presents valuable insights into the topics including enterprise resource planning icon with analytics and monitoring. This is a completely customizable PowerPoint theme that can be put to use immediately. So, download it and address the topic impactfully.
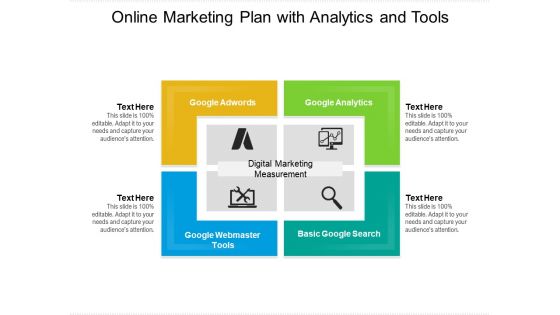
Online Marketing Plan With Analytics And Tools Ppt PowerPoint Presentation File Graphics Example PDF
Presenting this set of slides with name online marketing plan with analytics and tools ppt powerpoint presentation file graphics example pdf. This is a four stage process. The stages in this process are google adwords, google analytics, google webmaster. This is a completely editable PowerPoint presentation and is available for immediate download. Download now and impress your audience.
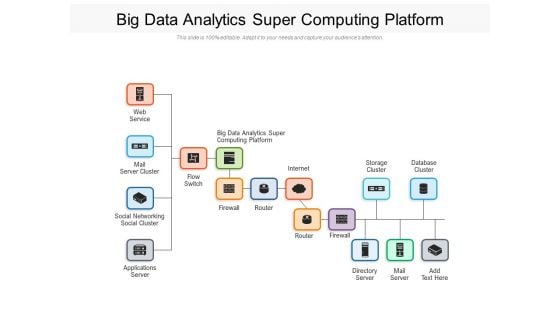
Big Data Analytics Super Computing Platform Ppt PowerPoint Presentation Gallery Slides PDF
Presenting this set of slides with name big data analytics super computing platform ppt powerpoint presentation gallery slides pdf. The topics discussed in these slides are networking, analytics, service. This is a completely editable PowerPoint presentation and is available for immediate download. Download now and impress your audience.

Dashboard Analytics Measuring Supply Chain Efficiency Optimizing Retail Operations With Digital DT SS V
This slide represents a supply chain management dashboard measuring the efficiency of supply chain operations after effective digital transformation of retail operations. It includes inventory to sales, inventory turnover, carrying cost of inventory, inventory accuracy, and percentage out of stock items.If you are looking for a format to display your unique thoughts, then the professionally designed Dashboard Analytics Measuring Supply Chain Efficiency Optimizing Retail Operations With Digital DT SS V is the one for you. You can use it as a Google Slides template or a PowerPoint template. Incorporate impressive visuals, symbols, images, and other charts. Modify or reorganize the text boxes as you desire. Experiment with shade schemes and font pairings. Alter, share or cooperate with other people on your work. Download Dashboard Analytics Measuring Supply Chain Efficiency Optimizing Retail Operations With Digital DT SS V and find out how to give a successful presentation. Present a perfect display to your team and make your presentation unforgettable. This slide represents a supply chain management dashboard measuring the efficiency of supply chain operations after effective digital transformation of retail operations. It includes inventory to sales, inventory turnover, carrying cost of inventory, inventory accuracy, and percentage out of stock items.
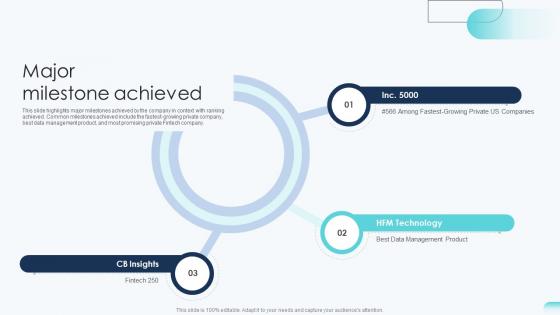
Major Milestone Achieved Big Data Analytics Investor Funding Elevator Pitch Deck
This slide highlights major milestones achieved by the company in context with ranking achieved. Common milestones achieved include the fastest-growing private company, best data management product, and most promising private Fintech company. If you are looking for a format to display your unique thoughts, then the professionally designed Major Milestone Achieved Big Data Analytics Investor Funding Elevator Pitch Deck is the one for you. You can use it as a Google Slides template or a PowerPoint template. Incorporate impressive visuals, symbols, images, and other charts. Modify or reorganize the text boxes as you desire. Experiment with shade schemes and font pairings. Alter, share or cooperate with other people on your work. Download Major Milestone Achieved Big Data Analytics Investor Funding Elevator Pitch Deck and find out how to give a successful presentation. Present a perfect display to your team and make your presentation unforgettable. This slide highlights major milestones achieved by the company in context with ranking achieved. Common milestones achieved include the fastest-growing private company, best data management product, and most promising private Fintech company.
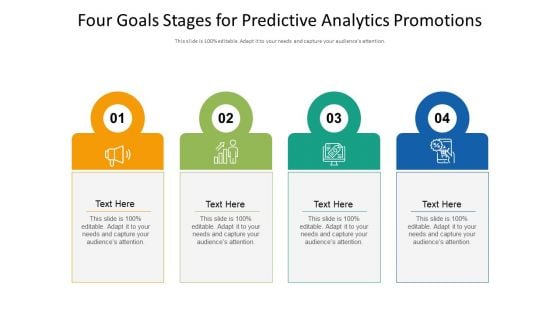
Four Goals Stages For Predictive Analytics Promotions Ppt PowerPoint Presentation Infographics Inspiration PDF
Presenting four goals stages for predictive analytics promotions ppt powerpoint presentation infographics inspiration pdf to dispense important information. This template comprises four stages. It also presents valuable insights into the topics including four goals stages for predictive analytics promotions. This is a completely customizable PowerPoint theme that can be put to use immediately. So, download it and address the topic impactfully.
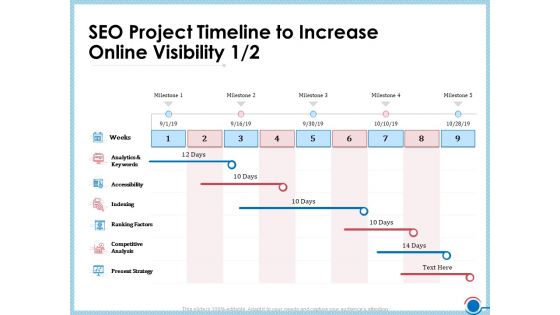
Enhancing Digital Presence Proposal Template SEO Project Timeline To Increase Online Visibility Analytics Professional PDF
Deliver and pitch your topic in the best possible manner with this enhancing digital presence proposal template seo project timeline to increase online visibility analytics professional pdf. Use them to share invaluable insights on analytics and keywords, accessibility, indexing, ranking factors, competitive analysis and impress your audience. This template can be altered and modified as per your expectations. So, grab it now.
Search Engine Optimization Utilities Proposal SEO Services Project Timeline Analytics Icons PDF
Deliver and pitch your topic in the best possible manner with this search engine optimization utilities proposal seo services project timeline analytics icons pdf. Use them to share invaluable insights on analytics and keywords, accessibility, indexing, ranking factors, competitive analysis and impress your audience. This template can be altered and modified as per your expectations. So, grab it now.
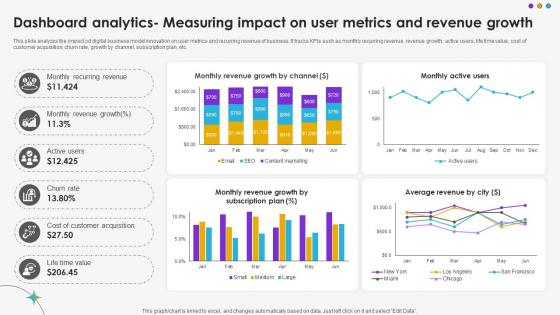
Dashboard Analytics Measuring Impact On User Metrics And Revenue Growth DT SS V
This slide analyzes the impact od digital business model innovation on user metrics and recurring revenue of business. It tracks KPIs such as monthly recurring revenue, revenue growth, active users, life time value, cost of customer acquisition, churn rate, growth by channel, subscription plan, etc.Are you searching for a Dashboard Analytics Measuring Impact On User Metrics And Revenue Growth DT SS V that is uncluttered, straightforward, and original Its easy to edit, and you can change the colors to suit your personal or business branding. For a presentation that expresses how much effort you have put in, this template is ideal With all of its features, including tables, diagrams, statistics, and lists, its perfect for a business plan presentation. Make your ideas more appealing with these professional slides. Download Dashboard Analytics Measuring Impact On User Metrics And Revenue Growth DT SS V from Slidegeeks today. This slide analyzes the impact od digital business model innovation on user metrics and recurring revenue of business. It tracks KPIs such as monthly recurring revenue, revenue growth, active users, life time value, cost of customer acquisition, churn rate, growth by channel, subscription plan, etc.
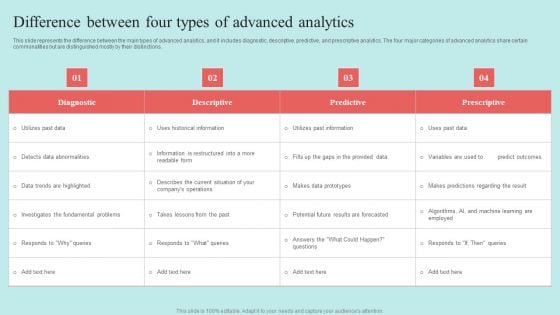
Predictive Data Model Difference Between Four Types Of Advanced Analytics Guidelines PDF
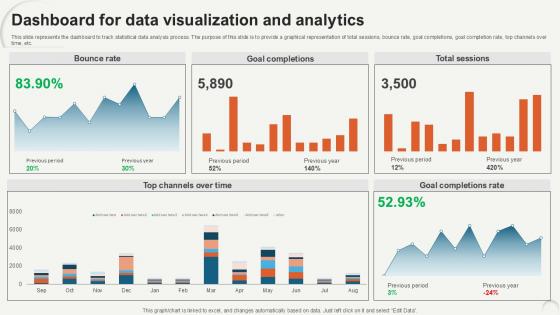
Dashboard For Data Visualization Data Analytics For Informed Decision Ppt Sample
This slide represents the dashboard to track statistical data analysis process. The purpose of this slide is to provide a graphical representation of total sessions, bounce rate, goal completions, goal completion rate, top channels over time, etc. Do you have an important presentation coming up Are you looking for something that will make your presentation stand out from the rest Look no further than Dashboard For Data Visualization Data Analytics For Informed Decision Ppt Sample. With our professional designs, you can trust that your presentation will pop and make delivering it a smooth process. And with Slidegeeks, you can trust that your presentation will be unique and memorable. So why wait Grab Dashboard For Data Visualization Data Analytics For Informed Decision Ppt Sample today and make your presentation stand out from the rest This slide represents the dashboard to track statistical data analysis process. The purpose of this slide is to provide a graphical representation of total sessions, bounce rate, goal completions, goal completion rate, top channels over time, etc.
Website Analytics Trends Facts And Information Vector Icon Ppt PowerPoint Presentation Gallery Clipart PDF
Showcasing this set of slides titled website analytics trends facts and information vector icon ppt powerpoint presentation gallery clipart pdf. The topics addressed in these templates are website analytics trends facts and information vector icon. All the content presented in this PPT design is completely editable. Download it and make adjustments in color, background, font etc. as per your unique business setting.

Analytics For Website Conversion Rate Optimization Ppt PowerPoint Presentation Inspiration Graphics Pictures PDF
Pitch your topic with ease and precision using this analytics for website conversion rate optimization ppt powerpoint presentation inspiration graphics pictures pdf. This layout presents information on analytics for website conversion rate optimization. It is also available for immediate download and adjustment. So, changes can be made in the color, design, graphics or any other component to create a unique layout.
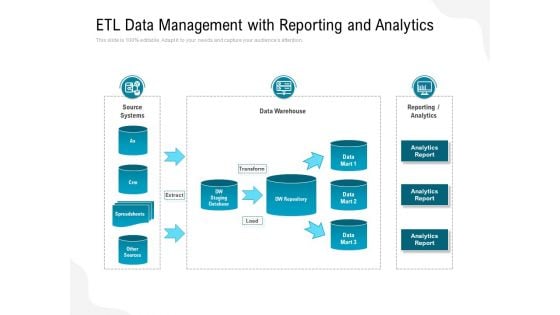
ETL Data Management With Reporting And Analytics Ppt PowerPoint Presentation Gallery Slide Download PDF
Pitch your topic with ease and precision using this etl data management with reporting and analytics ppt powerpoint presentation gallery slide download pdf. This layout presents information on source systems, data warehouse, analytics. It is also available for immediate download and adjustment. So, changes can be made in the color, design, graphics or any other component to create a unique layout.
Hiring Analytics Report Overview With Total Candidates Ppt PowerPoint Presentation Icon Example PDF
Showcasing this set of slides titled hiring analytics report overview with total candidates ppt powerpoint presentation icon example pdf. The topics addressed in these templates are hiring analytics report overview with total candidates. All the content presented in this PPT design is completely editable. Download it and make adjustments in color, background, font etc. as per your unique business setting.
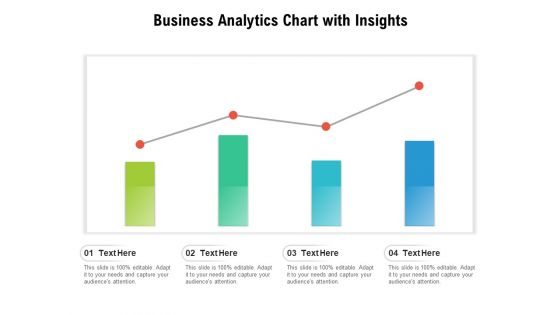
Business Analytics Chart With Insights Ppt PowerPoint Presentation Slides Guidelines PDF
Pitch your topic with ease and precision using this business analytics chart with insights ppt powerpoint presentation slides guidelines pdf. This layout presents information on business analytics chart with insights. It is also available for immediate download and adjustment. So, changes can be made in the color, design, graphics or any other component to create a unique layout.
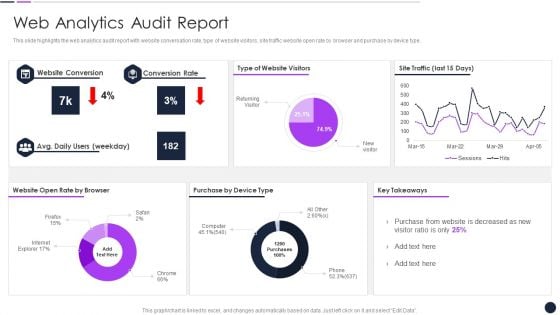
Effective Digital Marketing Audit Process Web Analytics Audit Report Rules PDF
Presenting Effective Digital Marketing Audit Process Web Analytics Audit Report Rules PDF to provide visual cues and insights. Share and navigate important information on one stage that need your due attention. This template can be used to pitch topics like Web Analytics Audit. In addtion, this PPT design contains high resolution images, graphics, etc, that are easily editable and available for immediate download.
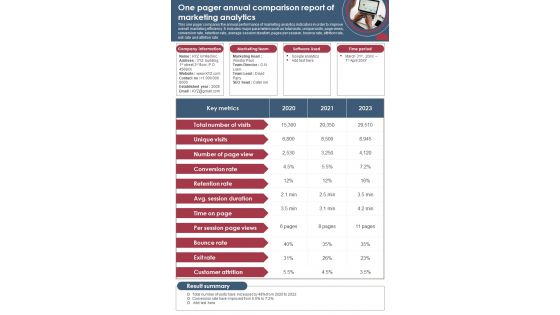
One Page Yearly Report For Comparative Marketing Analytics PDF Document PPT Template
Here an illustrative One Page Yearly Report For Comparative Marketing Analytics PDF Document PPT Template. This one-pager template is designed to match your needs. It is 100 percent editable, which allows you to make changes as you seem fit to suit your purpose. Grab this One Page Yearly Report For Comparative Marketing Analytics PDF Document PPT Template Download now.
KPI Dashboard Tracking Seo Major Promotional Analytics Future Trends Guidelines Pdf
This slide covers the KPI dashboard for analyzing SEO metrics such as authority score, organic traffic, organic keywords, paid keywords, ref. Domains, site audit, link building tool, organic traffic, on page SEO checker, backlink audit, etc. Are you searching for a KPI Dashboard Tracking Seo Major Promotional Analytics Future Trends Guidelines Pdf that is uncluttered, straightforward, and original Its easy to edit, and you can change the colors to suit your personal or business branding. For a presentation that expresses how much effort you have put in, this template is ideal With all of its features, including tables, diagrams, statistics, and lists, its perfect for a business plan presentation. Make your ideas more appealing with these professional slides. Download KPI Dashboard Tracking Seo Major Promotional Analytics Future Trends Guidelines Pdf from Slidegeeks today. This slide covers the KPI dashboard for analyzing SEO metrics such as authority score, organic traffic, organic keywords, paid keywords, ref. Domains, site audit, link building tool, organic traffic, on page SEO checker, backlink audit, etc.


 Continue with Email

 Home
Home


