Analytics Framework
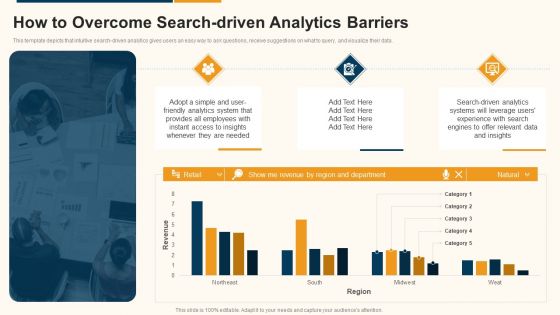
Data Interpretation And Analysis Playbook How To Overcome Search Driven Analytics Barriers Summary PDF
This template depicts that intuitive search-driven analytics gives users an easy way to ask questions, receive suggestions on what to query, and visualize their data. Deliver and pitch your topic in the best possible manner with this data interpretation and analysis playbook how to overcome search driven analytics barriers summary pdf. Use them to share invaluable insights on how to overcome search driven analytics barriers and impress your audience. This template can be altered and modified as per your expectations. So, grab it now.

Introduction To Predictive Analytics Technology Forward Looking Analysis IT Structure PDF
This slide represents the predictive analytics introduction that is used for forecasts action, behaviors, and trends using recent and past information. It performs the operations such as data mining, text analytics, statistics, and modeling on structured and unstructured data.Get a simple yet stunning designed Introduction To Predictive Analytics Technology Forward Looking Analysis IT Structure PDF. It is the best one to establish the tone in your meetings. It is an excellent way to make your presentations highly effective. So, download this PPT today from Slidegeeks and see the positive impacts. Our easy-to-edit Introduction To Predictive Analytics Technology Forward Looking Analysis IT Structure PDF can be your go-to option for all upcoming conferences and meetings. So, what are you waiting for Grab this template today.
Key Findings Of Consumer Intelligence Analytics Ppt PowerPoint Presentation Icon Model PDF
Following slide highlights consumer intelligence analytics findings that can be used by organization to understand individual customer needs and wants. Customer analytics findings include metrics such as customer name, tenure days, transaction usage, NPS, churn probability, churn prediction and required actions to be taken. Pitch your topic with ease and precision using this Key Findings Of Consumer Intelligence Analytics Ppt PowerPoint Presentation Icon Model PDF. This layout presents information on Customer, Tenure days, Transition Usage. It is also available for immediate download and adjustment. So, changes can be made in the color, design, graphics or any other component to create a unique layout.
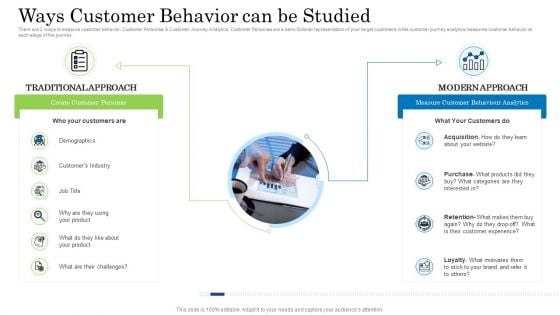
Customer Behavioral Data And Analytics Ways Customer Behavior Can Be Studied Elements PDF
There are 2 ways to measure customer behavior Customer Personas and Customer Journey Analytics. Customer Personas are a semi fictional representation of your target customers while customer journey analytics measures customer behavior at each stage of the journey.This is a customer behavioral data and analytics ways customer behavior can be studied elements pdf template with various stages. Focus and dispense information on two stages using this creative set, that comes with editable features. It contains large content boxes to add your information on topics like customers, demographics, customers industry, acquisition, purchase. You can also showcase facts, figures, and other relevant content using this PPT layout. Grab it now.
Information Transformation Process Toolkit Essential Business Requirements For Data Analytics In Venn Diagram Icons PDF
In this slide, we are showing the basic key components including people, process and technology that are required for data analytics strategy management process. This is a Information Transformation Process Toolkit Essential Business Requirements For Data Analytics In Venn Diagram Icons PDF template with various stages. Focus and dispense information on three stages using this creative set, that comes with editable features. It contains large content boxes to add your information on topics like Analytics, Processes, Technologies. You can also showcase facts, figures, and other relevant content using this PPT layout. Grab it now.
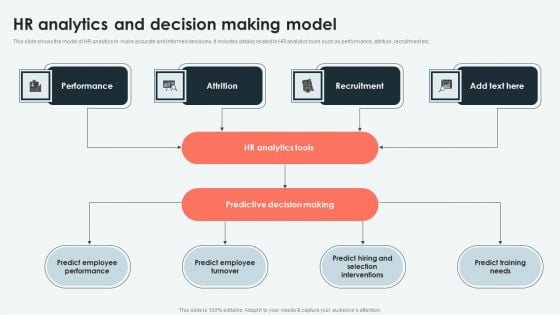
Analyzing And Deploying HR Analytics And Decision Making Model Infographics PDF
This slide shows the model of HR analytics to make accurate and informed decisions. It includes details related to HR analytics tools such as performance, attrition, recruitment etc. Slidegeeks is one of the best resources for PowerPoint templates. You can download easily and regulate Analyzing And Deploying HR Analytics And Decision Making Model Infographics PDF for your personal presentations from our wonderful collection. A few clicks is all it takes to discover and get the most relevant and appropriate templates. Use our Templates to add a unique zing and appeal to your presentation and meetings. All the slides are easy to edit and you can use them even for advertisement purposes.

SAC Planning And Implementation Sap Analytics Cloud Training Plan For Organization Information PDF
The purpose of this slide is to showcase the training plan for SAP Analytics Cloud coaching. It contains information regarding the basic perquisite, trainer name and number of attendees. It also contains details of training modules along with hours allocated, expected completion date. Deliver an awe inspiring pitch with this creative SAC Planning And Implementation Sap Analytics Cloud Training Plan For Organization Information PDF bundle. Topics like Training Modules Breakup, Augmented Analytics, Planning can be discussed with this completely editable template. It is available for immediate download depending on the needs and requirements of the user.
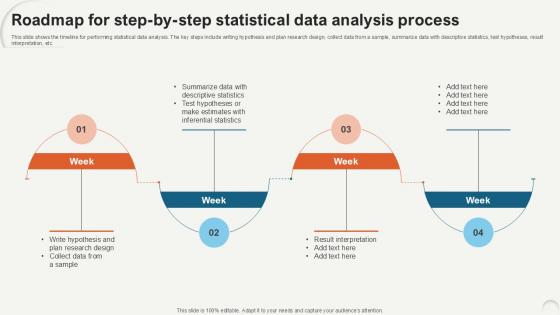
Roadmap For Step By Step Statistical Data Analytics For Informed Decision Ppt PowerPoint
This slide shows the timeline for performing statistical data analysis. The key steps include writing hypothesis and plan research design, collect data from a sample, summarize data with descriptive statistics, test hypotheses, result interpretation, etc. Retrieve professionally designed Roadmap For Step By Step Statistical Data Analytics For Informed Decision Ppt PowerPoint to effectively convey your message and captivate your listeners. Save time by selecting pre-made slideshows that are appropriate for various topics, from business to educational purposes. These themes come in many different styles, from creative to corporate, and all of them are easily adjustable and can be edited quickly. Access them as PowerPoint templates or as Google Slides themes. You do not have to go on a hunt for the perfect presentation because Slidegeeks got you covered from everywhere. This slide shows the timeline for performing statistical data analysis. The key steps include writing hypothesis and plan research design, collect data from a sample, summarize data with descriptive statistics, test hypotheses, result interpretation, etc.
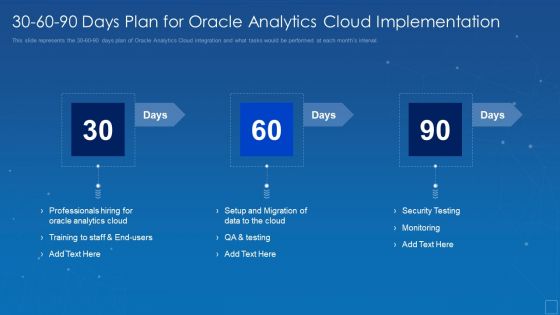
30 60 90 Days Plan For Oracle Analytics Cloud Implementation Mockup PDF
This slide represents the 30 60 90 days plan of Oracle Analytics Cloud integration and what tasks would be performed at each months interval. Presenting 30 60 90 days plan for oracle analytics cloud implementation mockup pdf to provide visual cues and insights. Share and navigate important information on three stages that need your due attention. This template can be used to pitch topics like training, professionals, analytics, staff, migration. In addtion, this PPT design contains high resolution images, graphics, etc, that are easily editable and available for immediate download.

Regression Model For Predictive Analytics Forward Looking Analysis IT Topics PDF
This slide represents the regression model of predictive analytics that is most commonly used in statistical analysis. This model is used to identify patterns in large amounts of data and works by calculating a formula. Presenting this PowerPoint presentation, titled Regression Model For Predictive Analytics Forward Looking Analysis IT Topics PDF, with topics curated by our researchers after extensive research. This editable presentation is available for immediate download and provides attractive features when used. Download now and captivate your audience. Presenting this Regression Model For Predictive Analytics Forward Looking Analysis IT Topics PDF. Our researchers have carefully researched and created these slides with all aspects taken into consideration. This is a completely customizable Regression Model For Predictive Analytics Forward Looking Analysis IT Topics PDF that is available for immediate downloading. Download now and make an impact on your audience. Highlight the attractive features available with our PPTs.
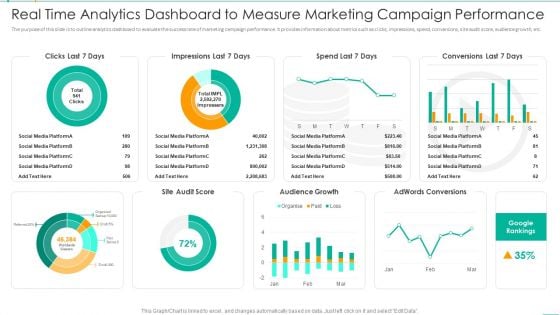
Real Time Analytics Dashboard To Measure Marketing Campaign Performance Information PDF
The purpose of this slide is to outline analytics dashboard to evaluate the success rate of marketing campaign performance. It provides information about metrics such as clicks, impressions, spend, conversions, site audit score, audience growth, etc. Pitch your topic with ease and precision using this Real Time Analytics Dashboard To Measure Marketing Campaign Performance Information PDF. This layout presents information on Real Time Analytics Dashboard To Measure Marketing Campaign Performance. It is also available for immediate download and adjustment. So, changes can be made in the color, design, graphics or any other component to create a unique layout.
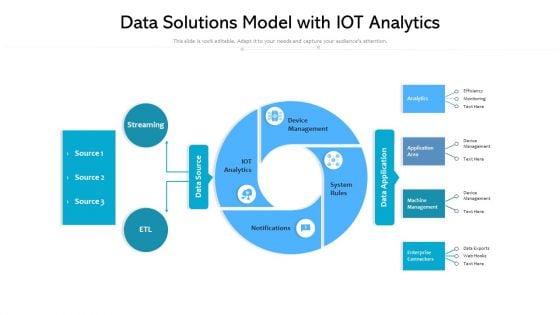
Data Solutions Model With Iot Analytics Ppt PowerPoint Presentation Gallery Grid PDF
Persuade your audience using this data solutions model with iot analytics ppt powerpoint presentation gallery grid pdf. This PPT design covers four stages, thus making it a great tool to use. It also caters to a variety of topics including analytics, management, system. Download this PPT design now to present a convincing pitch that not only emphasizes the topic but also showcases your presentation skills.
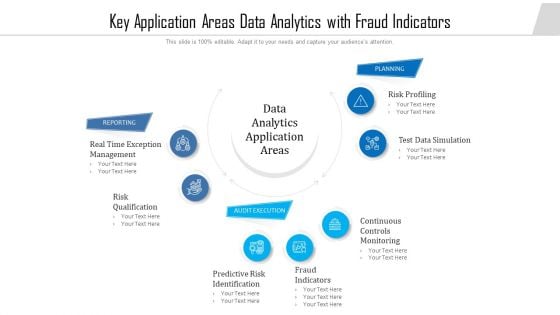
Key Application Areas Data Analytics With Fraud Indicators Ppt PowerPoint Presentation File Background Designs PDF
Persuade your audience using this key application areas data analytics with fraud indicators ppt powerpoint presentation file background designs pdf. This PPT design covers seven stages, thus making it a great tool to use. It also caters to a variety of topics including risk, planning, analytics. Download this PPT design now to present a convincing pitch that not only emphasizes the topic but also showcases your presentation skills.

predictive analytics scenarios ppt powerpoint presentation infographic template file formats cpb pdf
Presenting this set of slides with name predictive analytics scenarios ppt powerpoint presentation infographic template file formats cpb pdf. This is an editable Powerpoint four stages graphic that deals with topics like predictive analytics scenarios to help convey your message better graphically. This product is a premium product available for immediate download and is 100 percent editable in Powerpoint. Download this now and use it in your presentations to impress your audience.
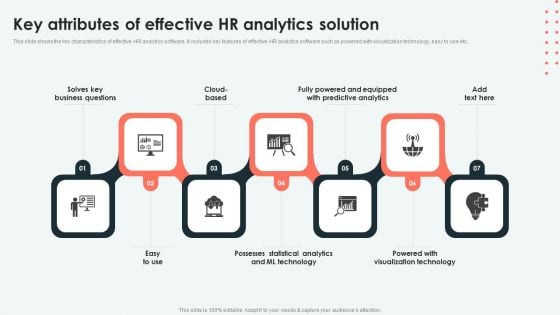
Analyzing And Deploying Key Attributes Of Effective HR Analytics Solution Elements PDF
This slide shows the key characteristics of effective HR analytics software. It includes key features of effective HR analytics software such as powered with visualization technology, easy to use etc. From laying roadmaps to briefing everything in detail, our templates are perfect for you. You can set the stage with your presentation slides. All you have to do is download these easy-to-edit and customizable templates. Analyzing And Deploying Key Attributes Of Effective HR Analytics Solution Elements PDF will help you deliver an outstanding performance that everyone would remember and praise you for. Do download this presentation today.

Executing Advance Data Analytics At Workspace Determine Dimensions For Digitally Summary PDF
This slide provides information regarding the areas in which firm can digitally advanced such as infrastructure, base technology and data analytics engine and application. Firm can choose any or all the dimensions as per requirement at a time. Presenting executing advance data analytics at workspace determine dimensions for digitally summary pdf to provide visual cues and insights. Share and navigate important information on four stages that need your due attention. This template can be used to pitch topics like infrastructure, technology, analytics. In addtion, this PPT design contains high resolution images, graphics, etc, that are easily editable and available for immediate download.
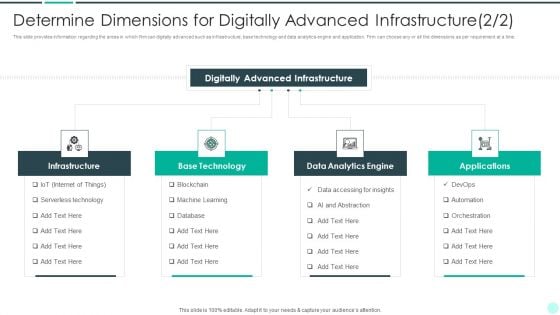
Executing Advance Data Analytics At Workspace Determine Dimensions For Digitally Ideas PDF
This slide provides information regarding the areas in which firm can digitally advanced such as infrastructure, base technology and data analytics engine and application. Firm can choose any or all the dimensions as per requirement at a time. Presenting executing advance data analytics at workspace determine dimensions for digitally ideas pdf to provide visual cues and insights. Share and navigate important information on four stages that need your due attention. This template can be used to pitch topics like infrastructure, base technology, analytics engine . In addtion, this PPT design contains high resolution images, graphics, etc, that are easily editable and available for immediate download.
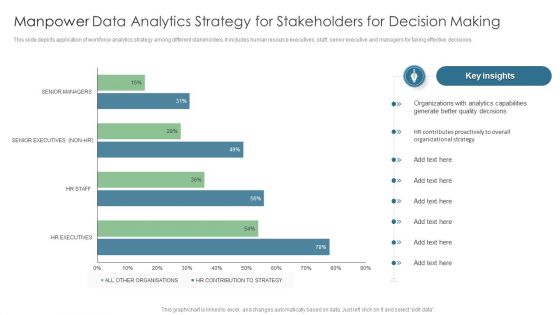
Manpower Data Analytics Strategy For Stakeholders For Decision Making Summary PDF
This slide depicts application of workforce analytics strategy among different stakeholders. It includes human resource executives, staff, senior executive and managers for taking effective decisions. Pitch your topic with ease and precision using this Manpower Data Analytics Strategy For Stakeholders For Decision Making Summary PDF. This layout presents information on Organizations, Analytics Capabilities, Generate Better Quality. It is also available for immediate download and adjustment. So, changes can be made in the color, design, graphics or any other component to create a unique layout.
Playbook For Content Advertising Google Analytics For All Web Tracking Demonstration PDF
This template covers tools to measure marketing analytics such as google analytics for all web tracking, google data studio to build real time reporting dashboards and google data studio reports. Deliver and pitch your topic in the best possible manner with this Playbook For Content Advertising Google Analytics For All Web Tracking Demonstration PDF. Use them to share invaluable insights on Demographics, Devices, Social Networks and impress your audience. This template can be altered and modified as per your expectations. So, grab it now.
Social Media Brand Promotion Instructions Playbook Google Analytics For All Web Tracking Graphics PDF
This template covers tools to measure marketing analytics such as google analytics for all web tracking, google data studio to build real-time reporting dashboards and google data studio reports.Deliver and pitch your topic in the best possible manner with this Social Media Brand Promotion Instructions Playbook Google Analytics For All Web Tracking Graphics PDF Use them to share invaluable insights on Demographics, Social Networks, Returning and impress your audience. This template can be altered and modified as per your expectations. So, grab it now.
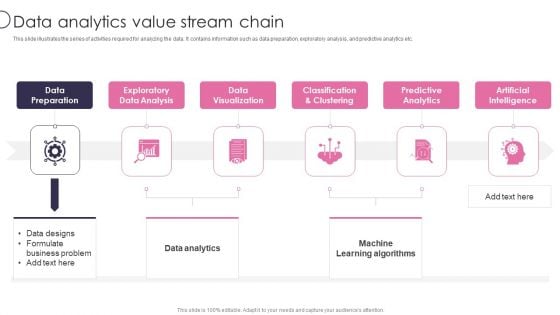
Information Transformation Process Toolkit Data Analytics Value Stream Chain Microsoft PDF
This slide illustrates the series of activities required for analyzing the data. It contains information such as data preparation, exploratory analysis, and predictive analytics etc. Presenting Information Transformation Process Toolkit Data Analytics Value Stream Chain Microsoft PDF to provide visual cues and insights. Share and navigate important information on six stages that need your due attention. This template can be used to pitch topics like Exploratory Data Analysis, Data Visualization, Predictive Analytics. In addtion, this PPT design contains high resolution images, graphics, etc, that are easily editable and available for immediate download.

Marketers Guide To Data Analysis Optimization Top Marketing Analytics Software Comparison Pictures PDF
This slide covers a comparative analysis of the market analytics system based on features such as real-time analytics and insights, brand measurement capabilities, contextualized customer and market insights, annual media plan recommendations, etc. Create an editable Marketers Guide To Data Analysis Optimization Top Marketing Analytics Software Comparison Pictures PDF that communicates your idea and engages your audience. Whether youre presenting a business or an educational presentation, pre designed presentation templates help save time. Marketers Guide To Data Analysis Optimization Top Marketing Analytics Software Comparison Pictures PDF is highly customizable and very easy to edit, covering many different styles from creative to business presentations. Slidegeeks has creative team members who have crafted amazing templates. So, go and get them without any delay.
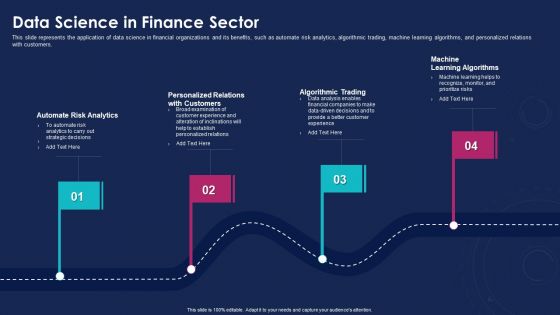
Data Analytics IT Data Science In Finance Sector Ppt Gallery Inspiration PDF
This slide represents the application of data science in financial organizations and its benefits, such as automate risk analytics, algorithmic trading, machine learning algorithms, and personalized relations with customers. This is a data analytics it data science in finance sector ppt gallery inspiration pdf template with various stages. Focus and dispense information on four stages using this creative set, that comes with editable features. It contains large content boxes to add your information on topics like automate risk analytics, personalized relations with customers, algorithmic trading, machine learning algorithms. You can also showcase facts, figures, and other relevant content using this PPT layout. Grab it now.
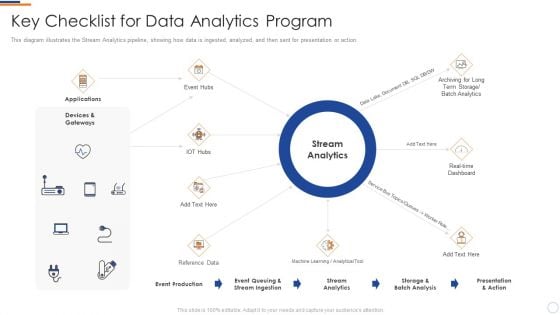
Key Checklist For Data Analytics Program Business Intelligence And Big Graphics PDF
This diagram illustrates the stream Analytics pipeline, showing how data is ingested, analyzed, and then sent for presentation or action. This is a key checklist for data analytics program business intelligence and big graphics pdf template with various stages. Focus and dispense information on eight stages using this creative set, that comes with editable features. It contains large content boxes to add your information on topics like applications, devices and gateways, stream analytics, presentation and action. You can also showcase facts, figures, and other relevant content using this PPT layout. Grab it now.
Online Business Sales Growth Analytics Vector Ppt Powerpoint Presentation Outline Aids
This is a online business sales growth analytics vector ppt powerpoint presentation outline aids. This is a four stage process. The stages in this process are ecommerce, mercantilism, commercialism.
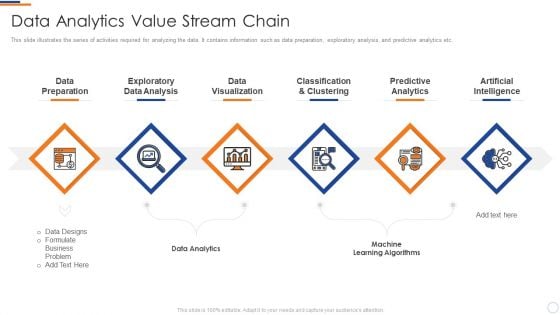
Business Intelligence And Big Transformation Toolkit Data Analytics Value Stream Chain Guidelines PDF
This slide illustrates the series of activities required for analyzing the data. It contains information such as data preparation, exploratory analysis, and predictive analytics etc. This is a business intelligence and big transformation toolkit data analytics value stream chain guidelines pdf template with various stages. Focus and dispense information on six stages using this creative set, that comes with editable features. It contains large content boxes to add your information on topics like data preparation, exploratory data analysis, data visualization, classification and clustering, predictive analytics. You can also showcase facts, figures, and other relevant content using this PPT layout. Grab it now.
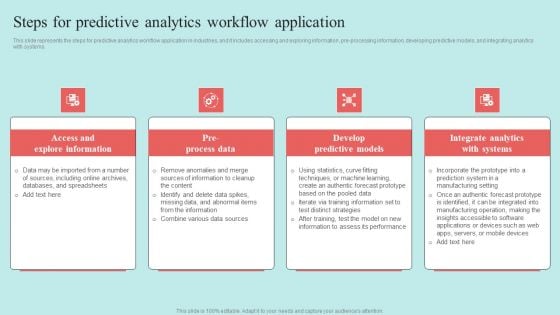
Predictive Data Model Steps For Predictive Analytics Workflow Application Sample PDF
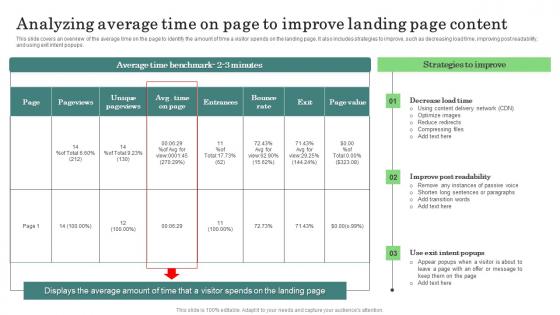
Analyzing Average Time Page Major Promotional Analytics Future Trends Microsoft Pdf
This slide covers an overview of the average time on the page to identify the amount of time a visitor spends on the landing page. It also includes strategies to improve, such as decreasing load time, improving post readability, and using exit intent popups. Take your projects to the next level with our ultimate collection of Analyzing Average Time Page Major Promotional Analytics Future Trends Microsoft Pdf. Slidegeeks has designed a range of layouts that are perfect for representing task or activity duration, keeping track of all your deadlines at a glance. Tailor these designs to your exact needs and give them a truly corporate look with your own brand colors they will make your projects stand out from the rest This slide covers an overview of the average time on the page to identify the amount of time a visitor spends on the landing page. It also includes strategies to improve, such as decreasing load time, improving post readability, and using exit intent popups.
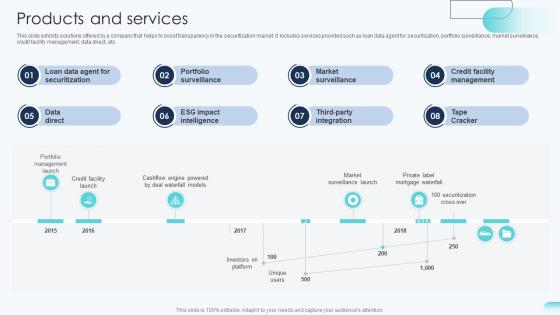
Products And Services Big Data Analytics Investor Funding Elevator Pitch Deck
This slide exhibits solutions offered by a company that helps to boost transparency in the securitization market. It includes services provided such as loan data agent for securitization, portfolio surveillance, market surveillance, credit facility management, data direct, etc. Coming up with a presentation necessitates that the majority of the effort goes into the content and the message you intend to convey. The visuals of a PowerPoint presentation can only be effective if it supplements and supports the story that is being told. Keeping this in mind our experts created Products And Services Big Data Analytics Investor Funding Elevator Pitch Deck to reduce the time that goes into designing the presentation. This way, you can concentrate on the message while our designers take care of providing you with the right template for the situation. This slide exhibits solutions offered by a company that helps to boost transparency in the securitization market. It includes services provided such as loan data agent for securitization, portfolio surveillance, market surveillance, credit facility management, data direct, etc.
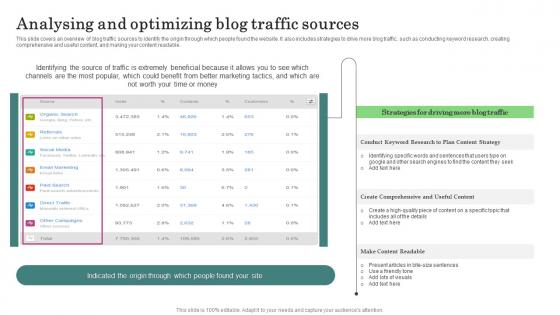
Analysing And Optimizing Blog Major Promotional Analytics Future Trends Inspiration Pdf
This slide covers an overview of blog traffic sources to identify the origin through which people found the website. It also includes strategies to drive more blog traffic, such as conducting keyword research, creating comprehensive and useful content, and making your content readable. This Analysing And Optimizing Blog Major Promotional Analytics Future Trends Inspiration Pdf from Slidegeeks makes it easy to present information on your topic with precision. It provides customization options, so you can make changes to the colors, design, graphics, or any other component to create a unique layout. It is also available for immediate download, so you can begin using it right away. Slidegeeks has done good research to ensure that you have everything you need to make your presentation stand out. Make a name out there for a brilliant performance. This slide covers an overview of blog traffic sources to identify the origin through which people found the website. It also includes strategies to drive more blog traffic, such as conducting keyword research, creating comprehensive and useful content, and making your content readable.
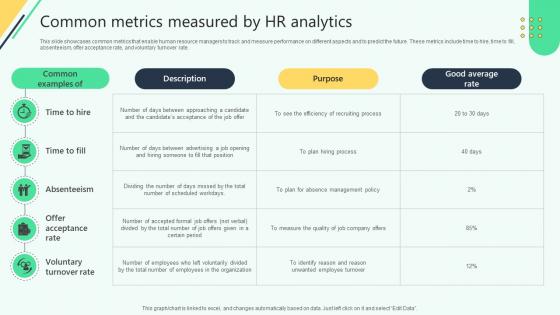
Common Metrics Measured By Hr Analytics Analysing Hr Data For Effective Decision Making
This slide showcases common metrics that enable human resource managers to track and measure performance on different aspects and to predict the future. These metrics include time to hire, time to fill,absenteeism, offer acceptance rate, and voluntary turnover rate. Slidegeeks is here to make your presentations a breeze with Common Metrics Measured By Hr Analytics Analysing Hr Data For Effective Decision Making With our easy-to-use and customizable templates, you can focus on delivering your ideas rather than worrying about formatting. With a variety of designs to choose from, you are sure to find one that suits your needs. And with animations and unique photos, illustrations, and fonts, you can make your presentation pop. So whether you are giving a sales pitch or presenting to the board, make sure to check out Slidegeeks first This slide showcases common metrics that enable human resource managers to track and measure performance on different aspects and to predict the future. These metrics include time to hire, time to fill,absenteeism, offer acceptance rate, and voluntary turnover rate.
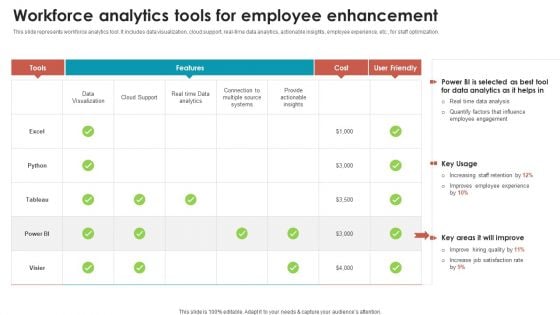
Talent Management Optimization With Workforce Staffing Workforce Analytics Tools For Employee Infographics PDF
This slide represents workforce analytics tool. It includes data visualization, cloud support, real-time data analytics, actionable insights, employee experience, etc., for staff optimization. The Talent Management Optimization With Workforce Staffing Workforce Analytics Tools For Employee Infographics PDF is a compilation of the most recent design trends as a series of slides. It is suitable for any subject or industry presentation, containing attractive visuals and photo spots for businesses to clearly express their messages. This template contains a variety of slides for the user to input data, such as structures to contrast two elements, bullet points, and slides for written information. Slidegeeks is prepared to create an impression.
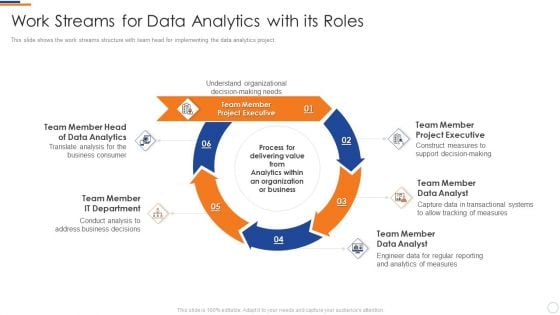
Business Intelligence And Big Work Streams For Data Analytics With Its Roles Microsoft PDF
This slide shows the work streams structure with team head for implementing the data analytics project. This is a business intelligence and big work streams for data analytics with its roles microsoft pdf template with various stages. Focus and dispense information on six stages using this creative set, that comes with editable features. It contains large content boxes to add your information on topics like team member head, data analytics, team member, it department, team member. You can also showcase facts, figures, and other relevant content using this PPT layout. Grab it now.
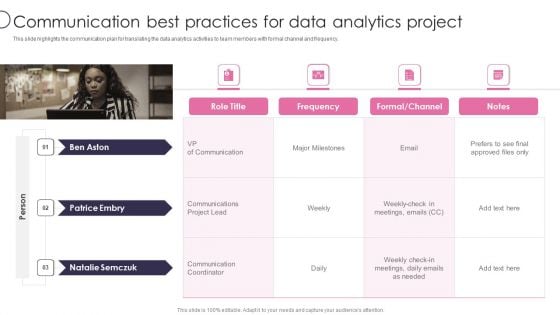
Information Transformation Process Toolkit Communication Best Practices For Data Analytics Project Professional PDF
This slide highlights the communication plan for translating the data analytics activities to team members with formal channel and frequency. Presenting Information Transformation Process Toolkit Communication Best Practices For Data Analytics Project Professional PDF to provide visual cues and insights. Share and navigate important information on four stages that need your due attention. This template can be used to pitch topics like Communication Best Practices, Data Analytics Project. In addtion, this PPT design contains high resolution images, graphics, etc, that are easily editable and available for immediate download.
Computer Screen Monitor Analytics Vector Icon Ppt Powerpoint Presentation Inspiration Grid
This is a computer screen monitor analytics vector icon ppt powerpoint presentation inspiration grid. This is a one stage process. The stages in this process are data management icon, big data icon.

Key Performance Indicator Analytics Dashboard Ppt PowerPoint Presentation Model Example Topics
This is a key performance indicator analytics dashboard ppt powerpoint presentation model example topics. This is a five stage process. The stages in this process are kpi proposal, kpi plan, kpi scheme.
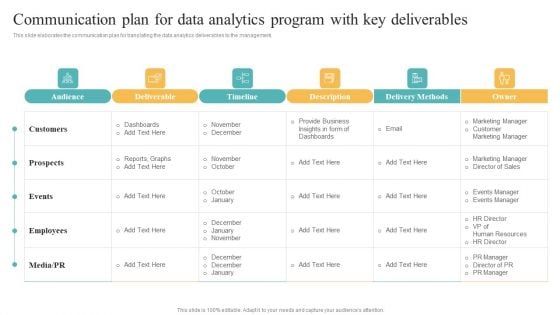
Transformation Toolkit Competitive Intelligence Information Analysis Communication Plan For Data Analytics Program Structure PDF
This slide elaborates the communication plan for translating the data analytics deliverables to the management. There are so many reasons you need a Transformation Toolkit Competitive Intelligence Information Analysis Communication Plan For Data Analytics Program Structure PDF. The first reason is you can not spend time making everything from scratch, Thus, Slidegeeks has made presentation templates for you too. You can easily download these templates from our website easily.
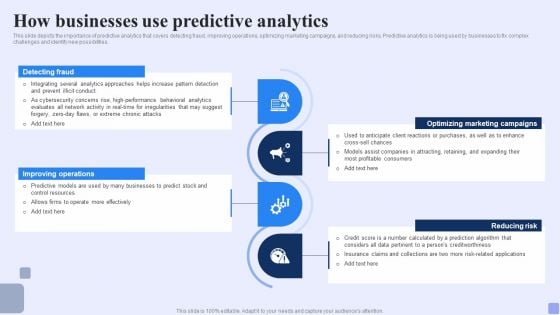
How Businesses Use Predictive Analytics Forward Looking Analysis IT Portrait PDF
This slide depicts the importance of predictive analytics that covers detecting fraud, improving operations, optimizing marketing campaigns, and reducing risks. Predictive analytics is being used by businesses to fix complex challenges and identify new possibilities.Do you have to make sure that everyone on your team knows about any specific topic I yes, then you should give How Businesses Use Predictive Analytics Forward Looking Analysis IT Portrait PDF a try. Our experts have put a lot of knowledge and effort into creating this impeccable How Businesses Use Predictive Analytics Forward Looking Analysis IT Portrait PDF. You can use this template for your upcoming presentations, as the slides are perfect to represent even the tiniest detail. You can download these templates from the Slidegeeks website and these are easy to edit. So grab these today.
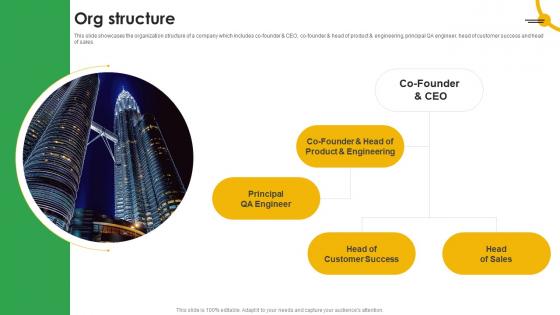
Org Structure Mobile App Analytics Company Fund Raising Pitch Deck Professional Pdf
This slide showcases the organization structure of a company which includes co founder and CEO, co founder and head of product and engineering, principal QA engineer, head of customer success and head of sales. From laying roadmaps to briefing everything in detail, our templates are perfect for you. You can set the stage with your presentation slides. All you have to do is download these easy to edit and customizable templates. Org Structure Mobile App Analytics Company Fund Raising Pitch Deck Professional Pdf will help you deliver an outstanding performance that everyone would remember and praise you for. Do download this presentation today. This slide showcases the organization structure of a company which includes co founder and CEO, co founder and head of product and engineering, principal QA engineer, head of customer success and head of sales.
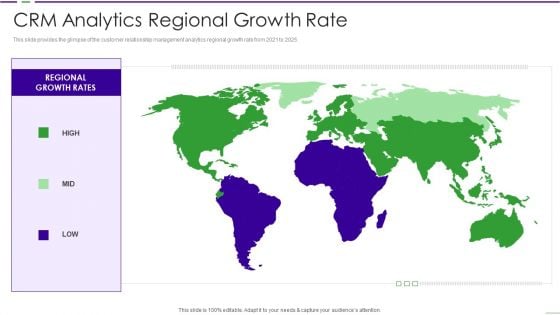
CRM Investor Fundraising Pitch Deck CRM Analytics Regional Growth Rate Ppt PowerPoint Presentation File Format PDF
This slide provides the glimpse of the customer relationship management analytics regional growth rate from 2021 to 2025. Presenting crm investor fundraising pitch deck crm analytics regional growth rate ppt powerpoint presentation file format pdf to provide visual cues and insights. Share and navigate important information on three stages that need your due attention. This template can be used to pitch topics like crm analytics regional growth rate. In addtion, this PPT design contains high resolution images, graphics, etc, that are easily editable and available for immediate download.
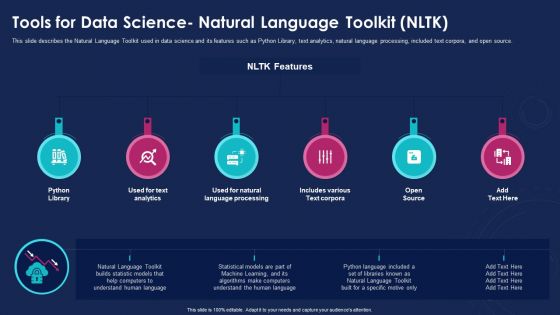
Data Analytics IT Tools For Data Science Natural Language Toolkit NLTK Ppt Professional Guidelines PDF
This slide describes the Natural Language Toolkit used in data science and its features such as Python Library, text analytics, natural language processing, included text corpora, and open source. Presenting data analytics it tools for data science natural language toolkit nltk ppt professional guidelines pdf to provide visual cues and insights. Share and navigate important information on six stages that need your due attention. This template can be used to pitch topics like python library, analytics, processing, open source. In addtion, this PPT design contains high resolution images, graphics, etc, that are easily editable and available for immediate download.
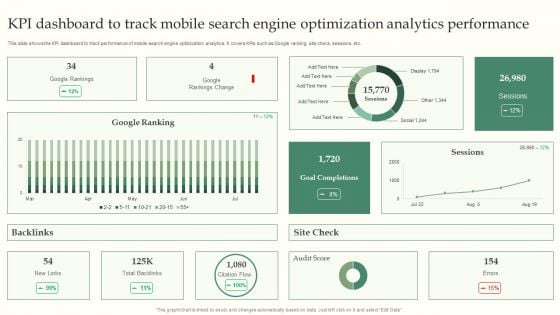
KPI Dashboard To Track Mobile Search Engine Optimization Analytics Performance Introduction PDF
This slide shows the KPI dashboard to track performance of mobile search engine optimization analytics. It covers KPIs such as Google ranking, site check, sessions, etc. Showcasing this set of slides titled KPI Dashboard To Track Mobile Search Engine Optimization Analytics Performance Introduction PDF. The topics addressed in these templates are KPI Dashboard, Search Engine Optimization, Analytics Performance. All the content presented in this PPT design is completely editable. Download it and make adjustments in color, background, font etc. as per your unique business setting.

Information Transformation Process Toolkit Key Considerations For Data Analytics Implementation Strategy Microsoft PDF
This slide depicts a holistic data analytics implementation strategy that includes a roadmap with a mix of business and technology imperatives. Presenting Information Transformation Process Toolkit Key Considerations For Data Analytics Implementation Strategy Microsoft PDF to provide visual cues and insights. Share and navigate important information on five stages that need your due attention. This template can be used to pitch topics like Consider Data Analytics Approach, Business Dimensions, Implement. In addtion, this PPT design contains high resolution images, graphics, etc, that are easily editable and available for immediate download.
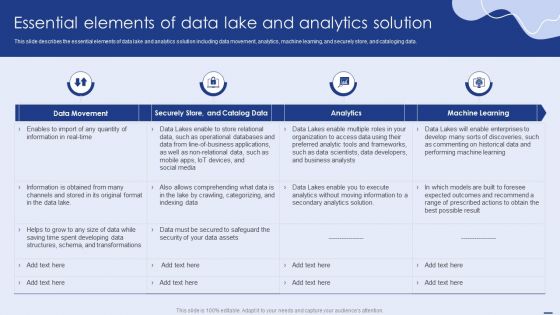
Essential Elements Of Data Lake And Analytics Solution Ppt PowerPoint Presentation File Diagrams PDF
This slide describes the essential elements of data lake and analytics solution including data movement, analytics, machine learning, and securely store, and cataloging data. This Essential Elements Of Data Lake And Analytics Solution Ppt PowerPoint Presentation File Diagrams PDF is perfect for any presentation, be it in front of clients or colleagues. It is a versatile and stylish solution for organizing your meetings. The product features a modern design for your presentation meetings. The adjustable and customizable slides provide unlimited possibilities for acing up your presentation. Slidegeeks has done all the homework before launching the product for you. So, do not wait, grab the presentation templates today.
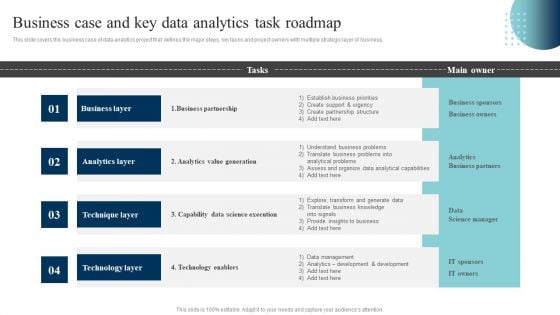
Data Evaluation And Processing Toolkit Business Case And Key Data Analytics Pictures PDF
This slide covers the business case of data analytics project that defines the major steps, key tasks and project owners with multiple strategic layer of business. Create an editable Data Evaluation And Processing Toolkit Business Case And Key Data Analytics Pictures PDF that communicates your idea and engages your audience. Whether youre presenting a business or an educational presentation, pre-designed presentation templates help save time. Data Evaluation And Processing Toolkit Business Case And Key Data Analytics Pictures PDF is highly customizable and very easy to edit, covering many different styles from creative to business presentations. Slidegeeks has creative team members who have crafted amazing templates. So, go and get them without any delay.
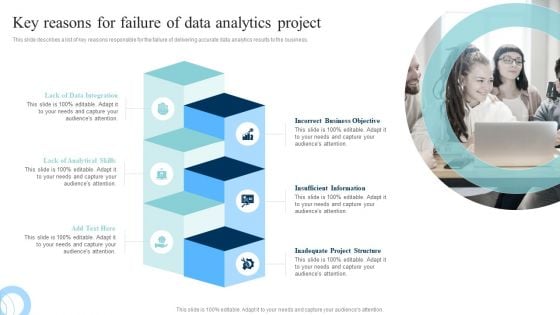
Data Evaluation And Processing Toolkit Key Reasons For Failure Of Data Analytics Project Brochure PDF
This slide describes a list of key reasons responsible for the failure of delivering accurate data analytics results to the business. Create an editable Data Evaluation And Processing Toolkit Key Reasons For Failure Of Data Analytics Project Brochure PDF that communicates your idea and engages your audience. Whether youre presenting a business or an educational presentation, pre-designed presentation templates help save time. Data Evaluation And Processing Toolkit Key Reasons For Failure Of Data Analytics Project Brochure PDF is highly customizable and very easy to edit, covering many different styles from creative to business presentations. Slidegeeks has creative team members who have crafted amazing templates. So, go and get them without any delay.
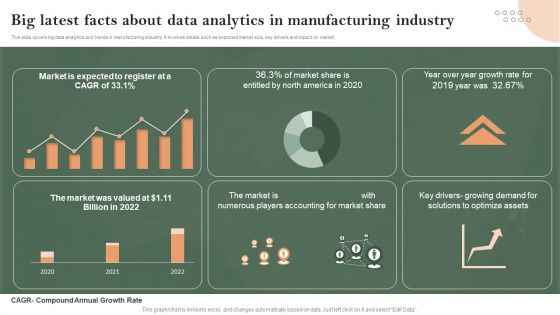
Big Latest Facts About Data Analytics In Manufacturing Industry Infographics PDF
This slide covers big data analytics and trends in manufacturing industry. It involves details such as expected market size, key drivers and impact on market. Pitch your topic with ease and precision using this Big Latest Facts About Data Analytics In Manufacturing Industry Infographics PDF. This layout presents information on Big Latest Facts, About Data Analytics, Manufacturing Industry. It is also available for immediate download and adjustment. So, changes can be made in the color, design, graphics or any other component to create a unique layout.
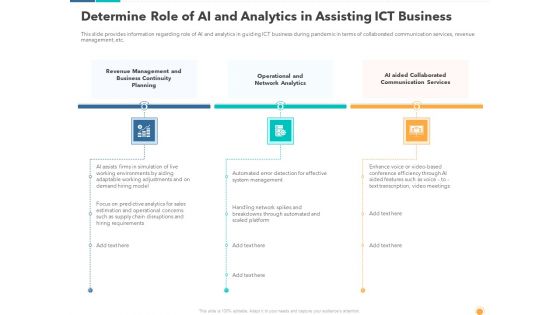
Determine Role Of AI And Analytics In Assisting ICT Business Rules PDF
This is a determine role of ai and analytics in assisting ict business rules pdf template with various stages. Focus and dispense information on three stages using this creative set, that comes with editable features. It contains large content boxes to add your information on topics like ai aided collaborated communication services, revenue management and, business continuity planning, operational and network analytics. You can also showcase facts, figures, and other relevant content using this PPT layout. Grab it now.
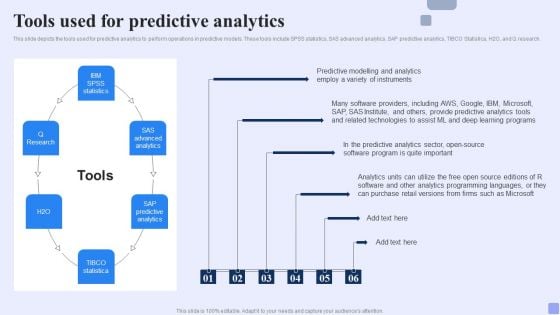
Tools Used For Predictive Analytics Forward Looking Analysis IT Background PDF
This slide depicts the tools used for predictive analytics to perform operations in predictive models. These tools include SPSS statistics, SAS advanced analytics, SAP predictive analytics, TIBCO Statistica, H2O, and Q research.Slidegeeks is one of the best resources for PowerPoint templates. You can download easily and regulate Tools Used For Predictive Analytics Forward Looking Analysis IT Background PDF for your personal presentations from our wonderful collection. A few clicks is all it takes to discover and get the most relevant and appropriate templates. Use our Templates to add a unique zing and appeal to your presentation and meetings. All the slides are easy to edit and you can use them even for advertisement purposes.
7 Elements Diagram Of Search Driven Analytics Ppt PowerPoint Presentation Icon Outline PDF
Persuade your audience using this 7 elements diagram of search driven analytics ppt powerpoint presentation icon outline pdf. This PPT design covers seven stages, thus making it a great tool to use. It also caters to a variety of topics including 7 elements diagram of search driven analytics. Download this PPT design now to present a convincing pitch that not only emphasizes the topic but also showcases your presentation skills.
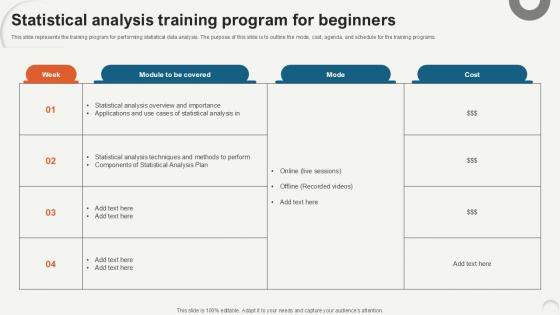
Statistical Analysis Training Program Data Analytics For Informed Decision Ppt Template
This slide represents the training program for performing statistical data analysis. The purpose of this slide is to outline the mode, cost, agenda, and schedule for the training programs. Take your projects to the next level with our ultimate collection of Statistical Analysis Training Program Data Analytics For Informed Decision Ppt Template. Slidegeeks has designed a range of layouts that are perfect for representing task or activity duration, keeping track of all your deadlines at a glance. Tailor these designs to your exact needs and give them a truly corporate look with your own brand colors they will make your projects stand out from the rest This slide represents the training program for performing statistical data analysis. The purpose of this slide is to outline the mode, cost, agenda, and schedule for the training programs.
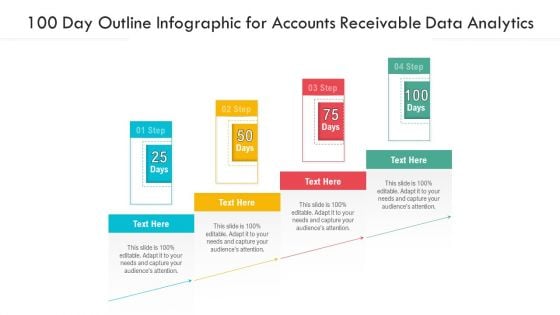
100 Day Outline Infographic For Accounts Receivable Data Analytics Ppt PowerPoint Presentation Gallery Picture PDF
Presenting 100 day outline infographic for accounts receivable data analytics ppt powerpoint presentation gallery picture pdf to dispense important information. This template comprises four stages. It also presents valuable insights into the topics including 100 day outline infographic for accounts receivable data analytics. This is a completely customizable PowerPoint theme that can be put to use immediately. So, download it and address the topic impactfully.
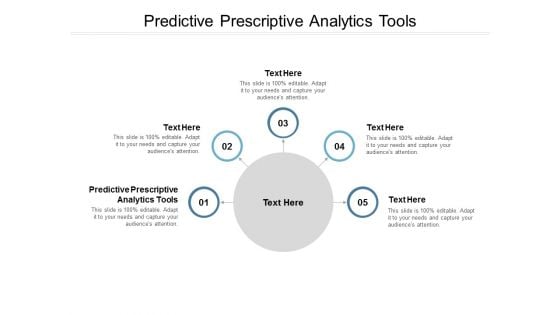
Predictive Prescriptive Analytics Tools Ppt PowerPoint Presentation Outline Format Ideas Cpb
Presenting this set of slides with name predictive prescriptive analytics tools ppt powerpoint presentation outline format ideas cpb. This is an editable Powerpoint five stages graphic that deals with topics like predictive prescriptive analytics tools to help convey your message better graphically. This product is a premium product available for immediate download and is 100 percent editable in Powerpoint. Download this now and use it in your presentations to impress your audience.
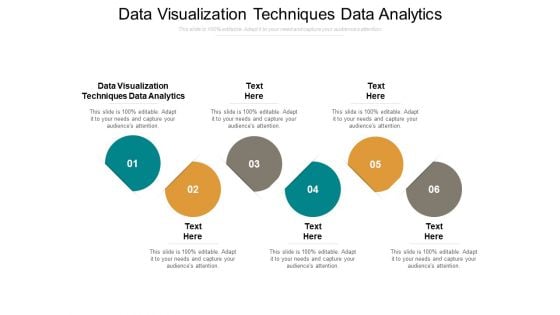
Data Visualization Techniques Data Analytics Ppt PowerPoint Presentation Outline Clipart Images Cpb
Presenting this set of slides with name data visualization techniques data analytics ppt powerpoint presentation outline clipart images cpb. This is an editable Powerpoint six stages graphic that deals with topics like data visualization techniques data analytics to help convey your message better graphically. This product is a premium product available for immediate download and is 100 percent editable in Powerpoint. Download this now and use it in your presentations to impress your audience.
Social Media Marketing Data Analytics Ppt PowerPoint Presentation Outline Slide Cpb
Presenting this set of slides with name social media marketing data analytics ppt powerpoint presentation outline slide cpb. This is an editable Powerpoint three stages graphic that deals with topics like social media marketing data analytics to help convey your message better graphically. This product is a premium product available for immediate download and is 100 percent editable in Powerpoint. Download this now and use it in your presentations to impress your audience.

Private Equity Portfolio Analytics Ppt PowerPoint Presentation Outline Background Cpb Pdf
Presenting this set of slides with name private equity portfolio analytics ppt powerpoint presentation outline background cpb pdf. This is an editable Powerpoint three stages graphic that deals with topics like private equity portfolio analytics to help convey your message better graphically. This product is a premium product available for immediate download and is 100 percent editable in Powerpoint. Download this now and use it in your presentations to impress your audience.

Data Analytics Work Streams With Its Roles And Responsibilities Business Analysis Modification Toolkit Inspiration PDF
This slide highlights the key responsibilities, data work streams and. And data head roles for constructing data analytics project.Deliver an awe inspiring pitch with this creative Data Analytics Work Streams With Its Roles And Responsibilities Business Analysis Modification Toolkit Inspiration PDF bundle. Topics like Machine Learning, Reporting Visualization can be discussed with this completely editable template. It is available for immediate download depending on the needs and requirements of the user.
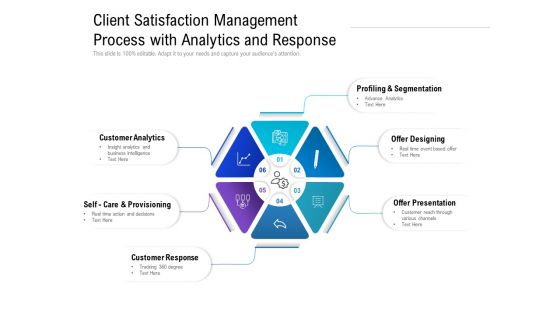
Client Satisfaction Management Process With Analytics And Response Ppt PowerPoint Presentation Summary Grid
Presenting this set of slides with name client satisfaction management process with analytics and response ppt powerpoint presentation summary grid. This is a six stage process. The stages in this process are customer analytics, self care and provisioning, customer response, profiling and segmentation, offer designing, offer presentation. This is a completely editable PowerPoint presentation and is available for immediate download. Download now and impress your audience.
Business Diagram Technology Predictive Data Analytics Networking Social Icons Ppt Slide
This technology diagram slide has been designed with graphic of data icons. These icons may be used to displays the data analytics and social media networking. Use this PPT slide for networking and technology related presentations.
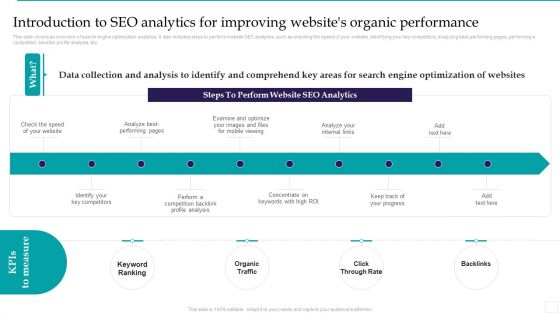
Introduction To SEO Analytics For Improving Websites Organic Performance Demonstration PDF
This slide covers an overview of search engine optimization analytics. It also includes steps to perform website SEO analytics, such as checking the speed of your website, identifying your key competitors, analyzing best performing pages, performing a competition backlink profile analysis, etc. Formulating a presentation can take up a lot of effort and time, so the content and message should always be the primary focus. The visuals of the PowerPoint can enhance the presenters message, so our Introduction To SEO Analytics For Improving Websites Organic Performance Demonstration PDF was created to help save time. Instead of worrying about the design, the presenter can concentrate on the message while our designers work on creating the ideal templates for whatever situation is needed. Slidegeeks has experts for everything from amazing designs to valuable content, we have put everything into Introduction To SEO Analytics For Improving Websites Organic Performance Demonstration PDF.


 Continue with Email

 Home
Home


