Architecture Icons
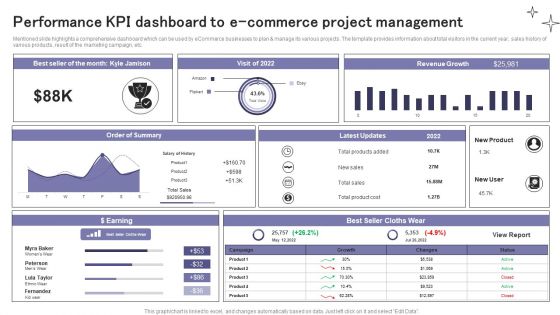
Performance KPI Dashboard To E Commerce Project Management Ppt Summary Inspiration PDF
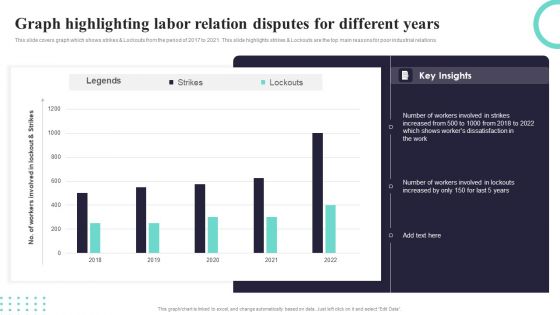
Graph Highlighting Labor Relation Disputes For Different Years Ppt PowerPoint Presentation Gallery Sample PDF
This slide covers graph which shows strikes and Lockouts from the period of 2017 to 2021. This slide highlights strikes and Lockouts are the top main reasons for poor industrial relations. Showcasing this set of slides titled Graph Highlighting Labor Relation Disputes For Different Years Ppt PowerPoint Presentation Gallery Sample PDF. The topics addressed in these templates are Legends, Strikes, Lockouts. All the content presented in this PPT design is completely editable. Download it and make adjustments in color, background, font etc. as per your unique business setting.
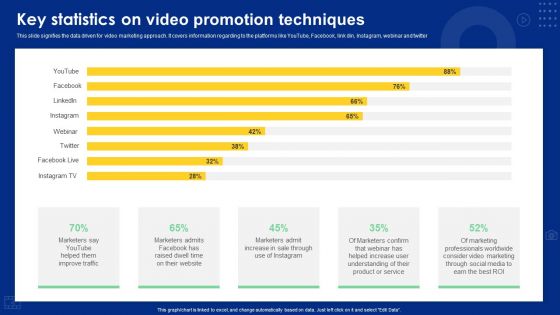
Key Statistics On Video Promotion Techniques Ppt Slides Example Introduction PDF
This slide signifies the data driven for video marketing approach. It covers information regarding to the platforms like YouTube, Facebook, link din, Instagram, webinar and twitter. Showcasing this set of slides titled Key Statistics On Video Promotion Techniques Ppt Slides Example Introduction PDF. The topics addressed in these templates are Marketers Say Youtube, Sale Through, Product Or Service. All the content presented in this PPT design is completely editable. Download it and make adjustments in color, background, font etc. as per your unique business setting.
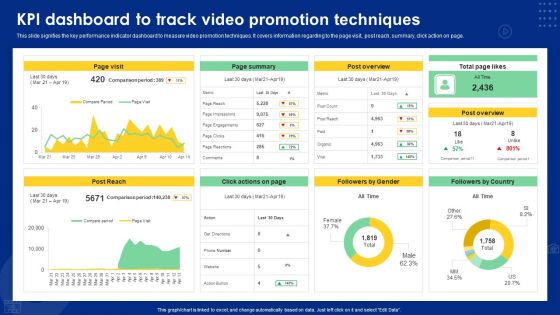
Kpi Dashboard To Track Video Promotion Techniques Ppt Summary Guide PDF
This slide signifies the key performance indicator dashboard to measure video promotion techniques. It covers information regarding to the page visit, post reach, summary, click action on page. Pitch your topic with ease and precision using this Kpi Dashboard To Track Video Promotion Techniques Ppt Summary Guide PDF. This layout presents information on Page Visit, Page Summary, Post Overview. It is also available for immediate download and adjustment. So, changes can be made in the color, design, graphics or any other component to create a unique layout.
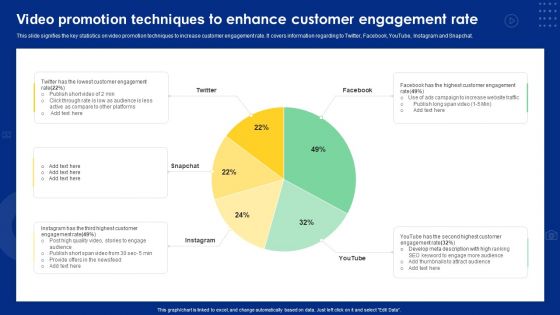
Video Promotion Techniques To Enhance Customer Engagement Rate Ppt Portfolio Images PDF
This slide signifies the key statistics on video promotion techniques to increase customer engagement rate. It covers information regarding to Twitter, Facebook, YouTube, Instagram and Snapchat. Pitch your topic with ease and precision using this Video Promotion Techniques To Enhance Customer Engagement Rate Ppt Portfolio Images PDF. This layout presents information on Facebook, Snapchat, Instagram, YouTube. It is also available for immediate download and adjustment. So, changes can be made in the color, design, graphics or any other component to create a unique layout.
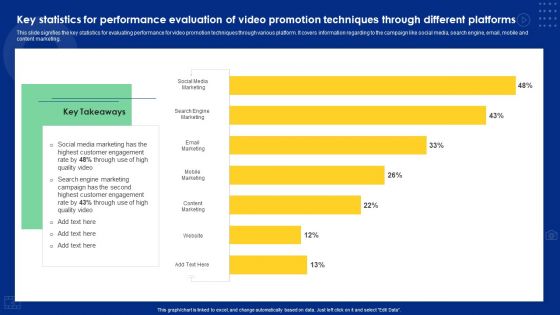
Key Statistics For Performance Evaluation Of Video Promotion Techniques Through Different Platforms Sample PDF
This slide signifies the key statistics for evaluating performance for video promotion techniques through various platform. It covers information regarding to the campaign like social media, search engine, email, mobile and content marketing. Showcasing this set of slides titled Key Statistics For Performance Evaluation Of Video Promotion Techniques Through Different Platforms Sample PDF. The topics addressed in these templates are Social Media Marketing, Search Engine Marketing, Email Marketing. All the content presented in this PPT design is completely editable. Download it and make adjustments in color, background, font etc. as per your unique business setting.
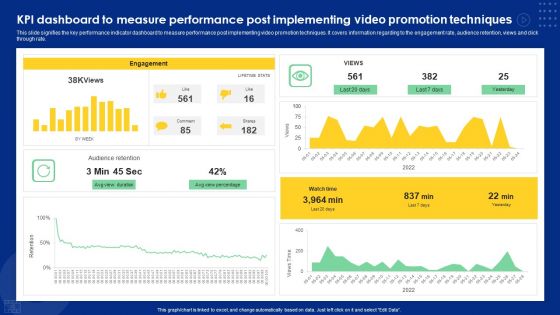
KPI Dashboard To Measure Performance Post Implementing Video Promotion Techniques Ideas PDF
This slide signifies the key performance indicator dashboard to measure performance post implementing video promotion techniques. It covers information regarding to the engagement rate, audience retention, views and click through rate. Pitch your topic with ease and precision using this KPI Dashboard To Measure Performance Post Implementing Video Promotion Techniques Ideas PDF. This layout presents information on Engagement, Audience Retention, Watch Time. It is also available for immediate download and adjustment. So, changes can be made in the color, design, graphics or any other component to create a unique layout.
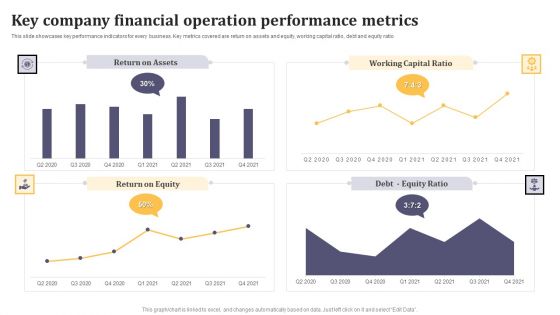
Key Company Financial Operation Performance Metrics Ppt Infographic Template Example Introduction PDF
This slide showcases key performance indicators for every business. Key metrics covered are return on assets and equity, working capital ratio, debt and equity ratio. Showcasing this set of slides titled Key Company Financial Operation Performance Metrics Ppt Infographic Template Example Introduction PDF. The topics addressed in these templates are Return on Assets, Working Capital Ratio, Return on Equity. All the content presented in this PPT design is completely editable. Download it and make adjustments in color, background, font etc. as per your unique business setting.
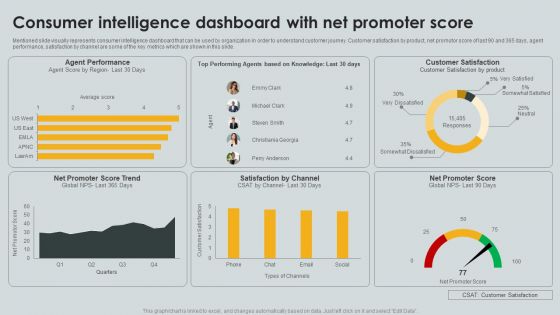
Consumer Intelligence Dashboard With Net Promoter Score Ppt PowerPoint Presentation File Templates PDF
Mentioned slide visually represents consumer intelligence dashboard that can be used by organization in order to understand customer journey. Customer satisfaction by product, net promotor score of last 90 and 365 days, agent performance, satisfaction by channel are some of the key metrics which are shown in this slide. Showcasing this set of slides titled Consumer Intelligence Dashboard With Net Promoter Score Ppt PowerPoint Presentation File Templates PDF. The topics addressed in these templates are Agent Performance, Satisfaction Channel, Net Promoter. All the content presented in this PPT design is completely editable. Download it and make adjustments in color, background, font etc. as per your unique business setting.
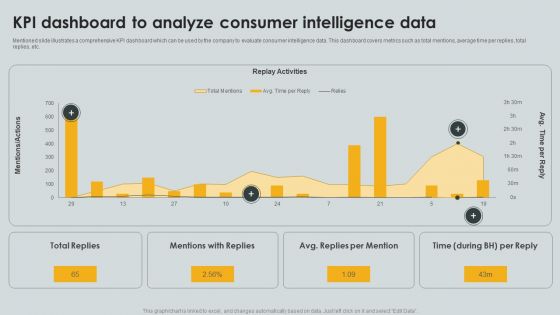
KPI Dashboard To Analyze Consumer Intelligence Data Ppt PowerPoint Presentation File Portfolio PDF
Mentioned slide illustrates a comprehensive KPI dashboard which can be used by the company to evaluate consumer intelligence data. This dashboard covers metrics such as total mentions, average time per replies, total replies, etc. Pitch your topic with ease and precision using this KPI Dashboard To Analyze Consumer Intelligence Data Ppt PowerPoint Presentation File Portfolio PDF. This layout presents information on Replay Activities, Total Replies, Mentions Replies. It is also available for immediate download and adjustment. So, changes can be made in the color, design, graphics or any other component to create a unique layout.
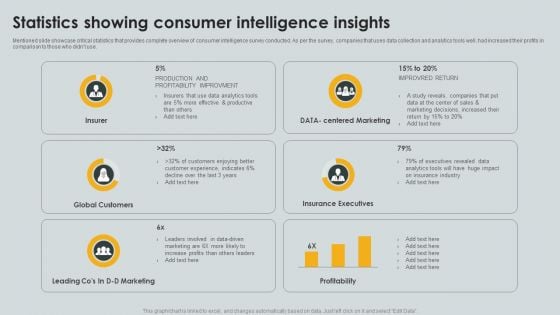
Statistics Showing Consumer Intelligence Insights Ppt PowerPoint Presentation Gallery Information PDF
Mentioned slide showcase critical statistics that provides complete overview of consumer intelligence survey conducted. As per the survey, companies that uses data collection and analytics tools well, had increased their profits in comparison to those who didnt use. Showcasing this set of slides titled Statistics Showing Consumer Intelligence Insights Ppt PowerPoint Presentation Gallery Information PDF. The topics addressed in these templates are Insurer, Global Customers, Insurance Executives. All the content presented in this PPT design is completely editable. Download it and make adjustments in color, background, font etc. as per your unique business setting.
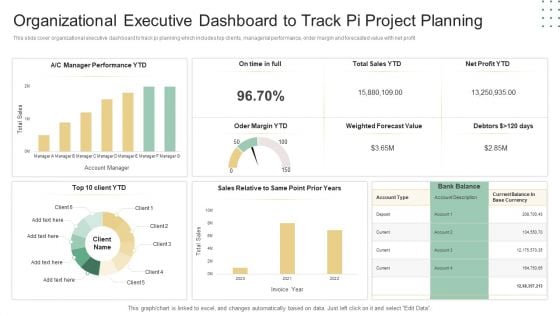
Organizational Executive Dashboard To Track Pi Project Planning Ppt Professional Background PDF
This slide cover organizational executive dashboard to track pi planning which includes top clients, managerial performance, order margin and forecasted value with net profit. Pitch your topic with ease and precision using this Organizational Executive Dashboard To Track Pi Project Planning Ppt Professional Background PDF. This layout presents information on Weighted Forecast Value, Top 10, Client YTD. It is also available for immediate download and adjustment. So, changes can be made in the color, design, graphics or any other component to create a unique layout.

Product Procurement Management Dashboard With Defect Rate Supplier Availability And Lead Time Pictures PDF
This slide shows a dashboard of procurement to provide real time information about various components. It includes defect rate, on time supplies , supplier availability and lead time. Showcasing this set of slides titled Product Procurement Management Dashboard With Defect Rate Supplier Availability And Lead Time Pictures PDF. The topics addressed in these templates are Supplier Defect Rate, Supplier Availability, Lead Time. All the content presented in this PPT design is completely editable. Download it and make adjustments in color, background, font etc. as per your unique business setting.
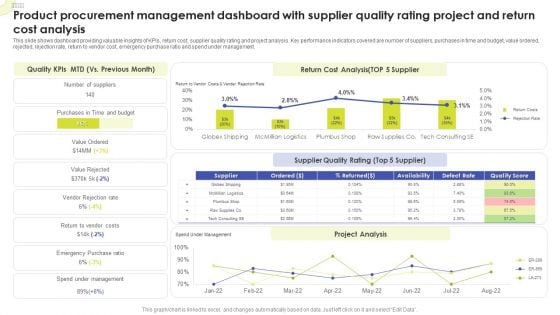
Product Procurement Management Dashboard With Supplier Quality Rating Project And Return Cost Analysis Sample PDF
This slide shows dashboard providing valuable insights of KPIs, return cost, supplier quality rating and project analysis. Key performance indicators covered are number of suppliers, purchases in time and budget, value ordered, rejected, rejection rate, return to vendor cost, emergency purchase ratio and spend under management. Pitch your topic with ease and precision using this Product Procurement Management Dashboard With Supplier Quality Rating Project And Return Cost Analysis Sample PDF. This layout presents information on Quality KPIs, Return Cost Analysis, Supplier Quality Rating. It is also available for immediate download and adjustment. So, changes can be made in the color, design, graphics or any other component to create a unique layout.
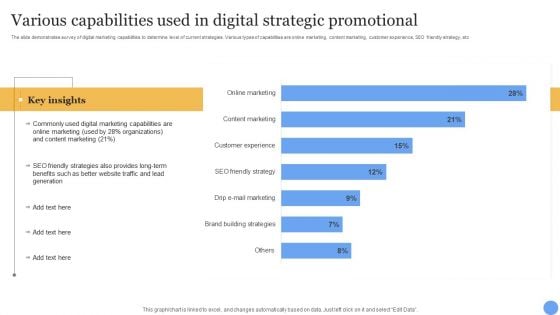
Various Capabilities Used In Digital Strategic Promotional Topics PDF
The slide demonstrates survey of digital marketing capabilities to determine level of current strategies. Various types of capabilities are online marketing, content marketing, customer experience, SEO friendly strategy, etc. Pitch your topic with ease and precision using this Various Capabilities Used In Digital Strategic Promotional Topics PDF. This layout presents information on Digital Marketing Capabilities, Content Marketing, Online Marketing. It is also available for immediate download and adjustment. So, changes can be made in the color, design, graphics or any other component to create a unique layout.
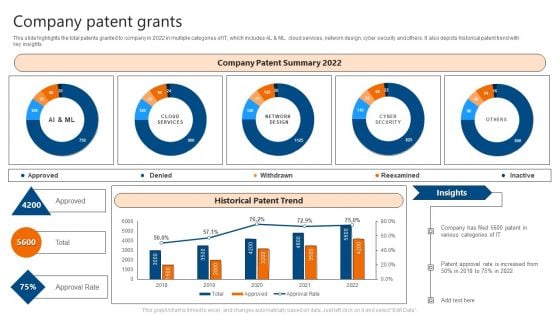
Company Patent Grants IT Software Development Company Profile Introduction PDF
This slide highlights the total patents granted to company in 2022 in multiple categories of IT, which includes AL and ML. cloud services, network design, cyber security and others. It also depicts historical patent trend with key insights. Deliver and pitch your topic in the best possible manner with this Company Patent Grants IT Software Development Company Profile Introduction PDF. Use them to share invaluable insights on Company Patent Summary, Historical Patent Trend and impress your audience. This template can be altered and modified as per your expectations. So, grab it now.
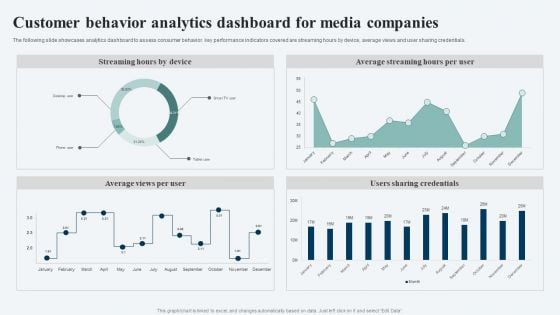
Customer Behavior Analytics Dashboard For Media Companies Ppt Ideas Visuals PDF
The following slide showcases analytics dashboard to assess consumer behavior. key performance indicators covered are streaming hours by device, average views and user sharing credentials. Showcasing this set of slides titled Customer Behavior Analytics Dashboard For Media Companies Ppt Ideas Visuals PDF. The topics addressed in these templates are Streaming Hours Device, Average Streaming Hours, Per User, Users Sharing Credentials. All the content presented in this PPT design is completely editable. Download it and make adjustments in color, background, font etc. as per your unique business setting.
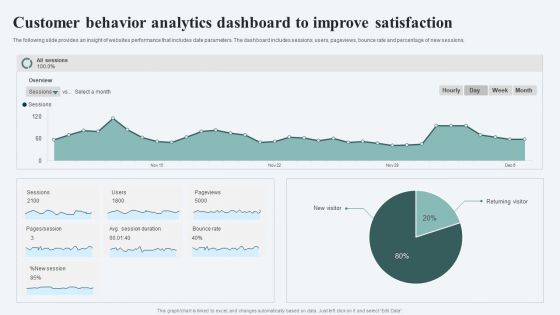
Customer Behavior Analytics Dashboard To Improve Satisfaction Ppt File Infographics PDF
The following slide provides an insight of websites performance that includes date parameters. The dashboard includes sessions, users, pageviews, bounce rate and percentage of new sessions. Pitch your topic with ease and precision using this Customer Behavior Analytics Dashboard To Improve Satisfaction Ppt File Infographics PDF. This layout presents information on Session, Avg Session Duration, Bounce Rate. It is also available for immediate download and adjustment. So, changes can be made in the color, design, graphics or any other component to create a unique layout.
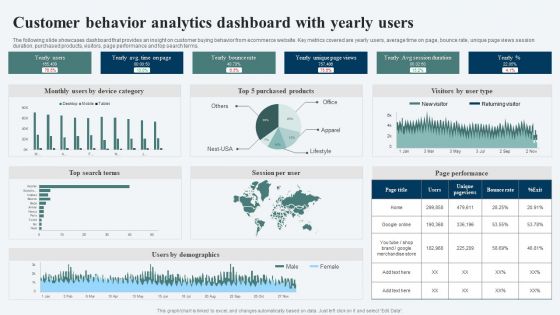
Customer Behavior Analytics Dashboard With Yearly Users Ppt Portfolio Ideas PDF
The following slide showcases dashboard that provides an insight on customer buying behavior from ecommerce website. Key metrics covered are yearly users, average time on page, bounce rate, unique page views session duration, purchased products, visitors, page performance and top search terms. Showcasing this set of slides titled Customer Behavior Analytics Dashboard With Yearly Users Ppt Portfolio Ideas PDF. The topics addressed in these templates are Yearly Users, Yearly Bounce Rate, Top Search Terms. All the content presented in this PPT design is completely editable. Download it and make adjustments in color, background, font etc. as per your unique business setting.
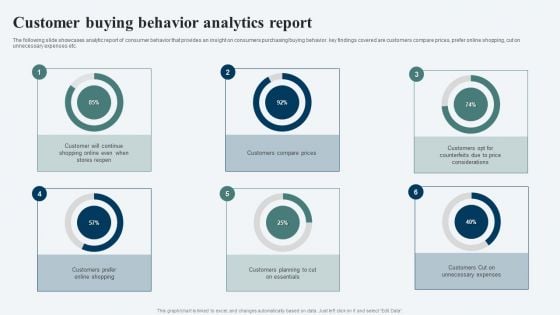
Customer Buying Behavior Analytics Report Ppt Inspiration Elements PDF
The following slide showcases analytic report of consumer behavior that provides an insight on consumers purchasing or buying behavior. key findings covered are customers compare prices, prefer online shopping, cut on unnecessary expenses etc. Pitch your topic with ease and precision using this Customer Buying Behavior Analytics Report Ppt Inspiration Elements PDF. This layout presents information on Customer Will, Continue Shopping, Stores Reopen, Customers Compare Prices. It is also available for immediate download and adjustment. So, changes can be made in the color, design, graphics or any other component to create a unique layout.
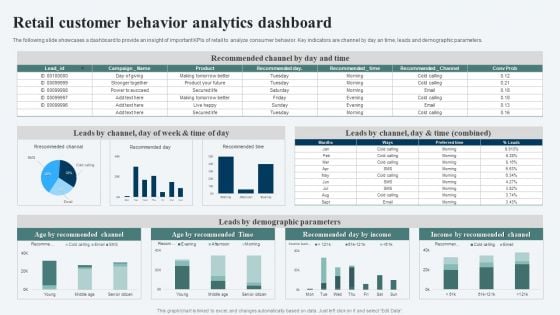
Retail Customer Behavior Analytics Dashboard Ppt Ideas Templates PDF
The following slide showcases a dashboard to provide an insight of important KPIs of retail to analyze consumer behavior. Key indicators are channel by day an time, leads and demographic parameters. Showcasing this set of slides titled Retail Customer Behavior Analytics Dashboard Ppt Ideas Templates PDF. The topics addressed in these templates are Recommended Channel, Leads Demographic Parameters, Income Recommended Channel. All the content presented in this PPT design is completely editable. Download it and make adjustments in color, background, font etc. as per your unique business setting.
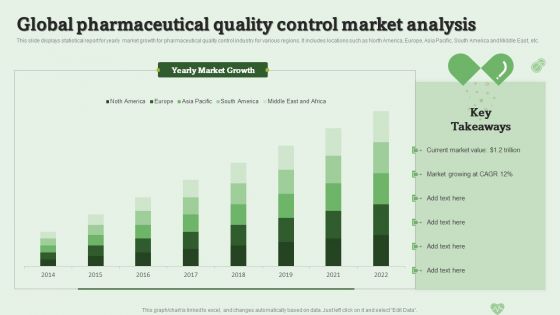
Global Pharmaceutical Quality Control Market Analysis Ppt PowerPoint Presentation Show Slides PDF
This slide displays statistical report for yearly market growth for pharmaceutical quality control industry for various regions. It includes locations such as North America, Europe, Asia Pacific, South America and Middle East, etc. Showcasing this set of slides titled Global Pharmaceutical Quality Control Market Analysis Ppt PowerPoint Presentation Show Slides PDF. The topics addressed in these templates are Market Value, Market Growing, Market Growth. All the content presented in this PPT design is completely editable. Download it and make adjustments in color, background, font etc. as per your unique business setting.
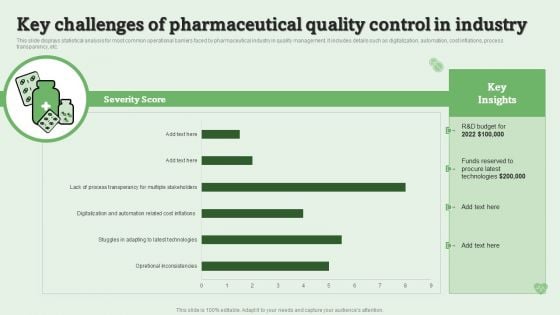
Key Challenges Of Pharmaceutical Quality Control In Industry Ppt PowerPoint Presentation Slides Examples PDF
This slide displays statistical analysis for most common operational barriers faced by pharmaceutical industry in quality management. It includes details such as digitalization, automation, cost inflations, process transparency, etc. Pitch your topic with ease and precision using this Key Challenges Of Pharmaceutical Quality Control In Industry Ppt PowerPoint Presentation Slides Examples PDF. This layout presents information on Opretional Inconsistencies, Latest Technologies, Automation Related. It is also available for immediate download and adjustment. So, changes can be made in the color, design, graphics or any other component to create a unique layout.
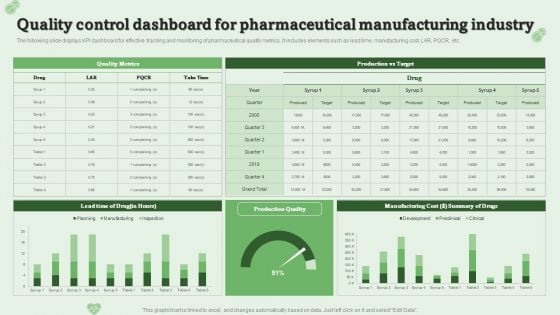
Quality Control Dashboard For Pharmaceutical Manufacturing Industry Ppt PowerPoint Presentation Model Layouts PDF
The following slide displays KPI dashboard for effective tracking and monitoring of pharmaceutical quality metrics. It includes elements such as lead time, manufacturing cost, LAR, PQCR, etc.Pitch your topic with ease and precision using this Quality Control Dashboard For Pharmaceutical Manufacturing Industry Ppt PowerPoint Presentation Model Layouts PDF. This layout presents information on Manufacturing Cost, Summary Drugs, Quality Metrics. It is also available for immediate download and adjustment. So, changes can be made in the color, design, graphics or any other component to create a unique layout.
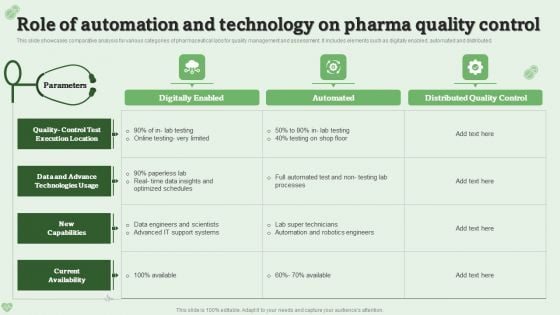
Role Of Automation And Technology On Pharma Quality Control Ppt PowerPoint Presentation Gallery Backgrounds PDF
This slide showcases comparative analysis for various categories of pharmaceutical labs for quality management and assessment. It includes elements such as digitally enabled, automated and distributed. Showcasing this set of slides titled Role Of Automation And Technology On Pharma Quality Control Ppt PowerPoint Presentation Gallery Backgrounds PDF. The topics addressed in these templates are Data Engineers, Current Availability, Quality Control. All the content presented in this PPT design is completely editable. Download it and make adjustments in color, background, font etc. as per your unique business setting.
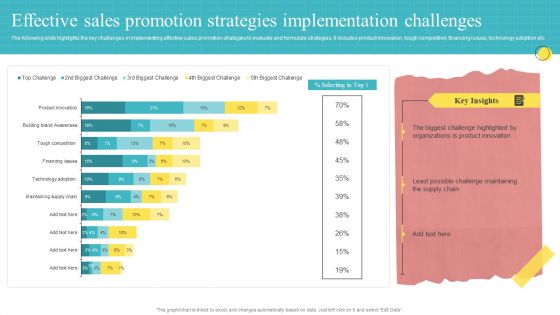
Effective Sales Promotion Strategies Implementation Challenges Ppt PowerPoint Presentation Ideas Graphics Tutorials PDF
The following slide highlights the key challenges in implementing effective sales promotion strategies to evaluate and formulate strategies. It includes product innovation, tough competition, financing issues, technology adoption etc. Pitch your topic with ease and precision using this Effective Sales Promotion Strategies Implementation Challenges Ppt PowerPoint Presentation Ideas Graphics Tutorials PDF. This layout presents information on Biggest Challenge, Product Innovation, Challenge Maintaining. It is also available for immediate download and adjustment. So, changes can be made in the color, design, graphics or any other component to create a unique layout.
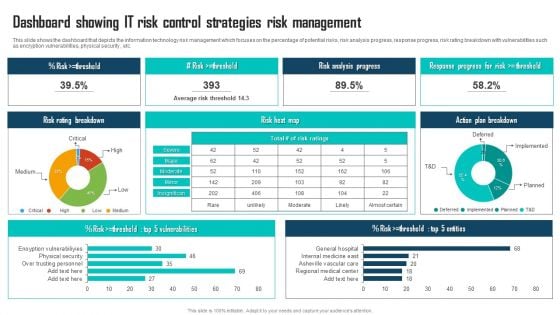
Dashboard Showing IT Risk Control Strategies Risk Management Portrait PDF
This slide shows the dashboard that depicts the information technology risk management which focuses on the percentage of potential risks, risk analysis progress, response progress, risk rating breakdown with vulnerabilities such as encryption vulnerabilities, physical security , etc. Showcasing this set of slides titled Dashboard Showing IT Risk Control Strategies Risk Management Portrait PDF. The topics addressed in these templates are Risk Analysis Progress, Risk Heat Map, Action Plan Breakdown. All the content presented in this PPT design is completely editable. Download it and make adjustments in color, background, font etc. as per your unique business setting.
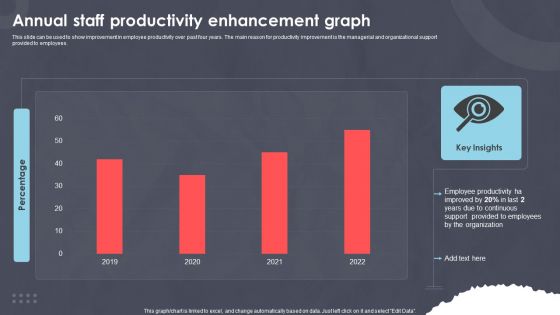
Annual Staff Productivity Enhancement Graph Ppt PowerPoint Presentation Styles Aids PDF
This slide can be used to show improvement in employee productivity over past four years. The main reason for productivity improvement is the managerial and organizational support provided to employees. Pitch your topic with ease and precision using this Annual Staff Productivity Enhancement Graph Ppt PowerPoint Presentation Styles Aids PDF. This layout presents information on Employee Productivity, Improved Last, Due Continuous. It is also available for immediate download and adjustment. So, changes can be made in the color, design, graphics or any other component to create a unique layout.
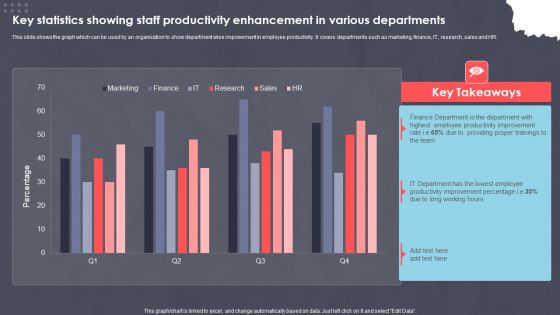
Key Statistics Showing Staff Productivity Enhancement In Various Departments Ppt PowerPoint Presentation Slides Portrait PDF
This slide shows the graph which can be used by an organization to show department wise improvement in employee productivity. It covers departments such as marketing, finance, IT, research, sales and HR. Pitch your topic with ease and precision using this Key Statistics Showing Staff Productivity Enhancement In Various Departments Ppt PowerPoint Presentation Slides Portrait PDF. This layout presents information on XXXXXXXXXXXXXXXXXXXXXXXXX. It is also available for immediate download and adjustment. So, changes can be made in the color, design, graphics or any other component to create a unique layout.
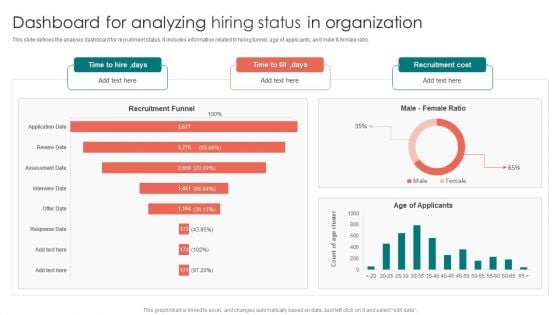
Dashboard For Analyzing Hiring Status In Organization Ppt PowerPoint Presentation Gallery Images PDF
This slide defines the analysis dashboard for recruitment status. It includes information related to hiring funnel, age of applicants, and male and female ratio. Pitch your topic with ease and precision using this Dashboard For Analyzing Hiring Status In Organization Ppt PowerPoint Presentation Gallery Images PDF. This layout presents information on Recruitment Funnel, Time To Hire, Age Applicants. It is also available for immediate download and adjustment. So, changes can be made in the color, design, graphics or any other component to create a unique layout.
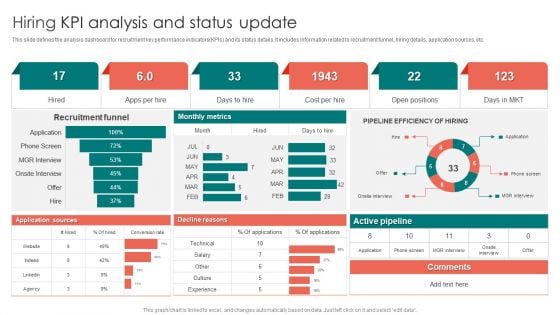
Hiring KPI Analysis And Status Update Ppt PowerPoint Presentation Gallery Show PDF
This slide defines the analysis dashboard for recruitment key performance indicators KPIs and its status details. It includes information related to recruitment funnel, hiring details, application sources, etc. Showcasing this set of slides titled Hiring KPI Analysis And Status Update Ppt PowerPoint Presentation Gallery Show PDF. The topics addressed in these templates are Recruitment Funnel, Monthly Metrics, Active Pipeline. All the content presented in this PPT design is completely editable. Download it and make adjustments in color, background, font etc. as per your unique business setting.
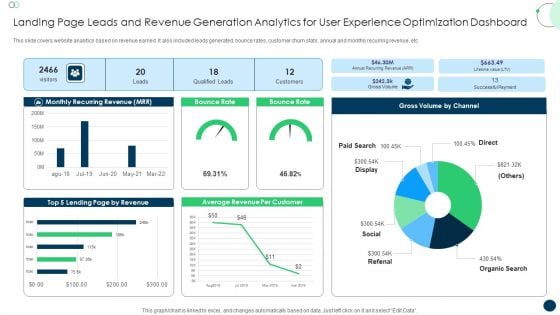
Landing Page Leads And Revenue Generation Analytics For User Experience Optimization Dashboard Formats PDF
This slide covers website analytics based on revenue earned. It also included leads generated, bounce rates, customer churn stats, annual and monthly recurring revenue, etc. Pitch your topic with ease and precision using this Landing Page Leads And Revenue Generation Analytics For User Experience Optimization Dashboard Formats PDF. This layout presents information on Monthly Recurring Revenue, Bounce Rate, Gross Volume. It is also available for immediate download and adjustment. So, changes can be made in the color, design, graphics or any other component to create a unique layout.
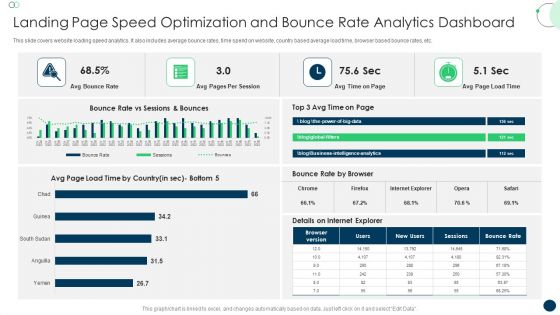
Landing Page Speed Optimization And Bounce Rate Analytics Dashboard Topics PDF
This slide covers website loading speed analytics. It also includes average bounce rates, time spend on website, country based average load time, browser based bounce rates, etc. Pitch your topic with ease and precision using this Landing Page Speed Optimization And Bounce Rate Analytics Dashboard Topics PDF. This layout presents information on Avg Bounce Rate, Avg Pages, Per Session. It is also available for immediate download and adjustment. So, changes can be made in the color, design, graphics or any other component to create a unique layout.
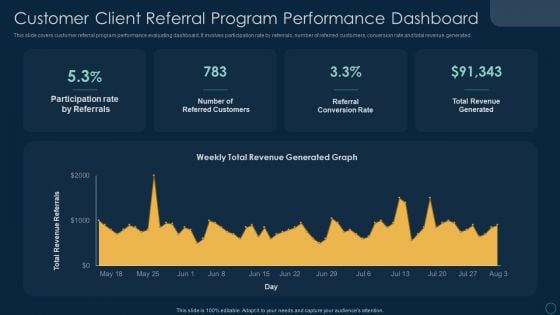
Customer Client Referral Program Performance Dashboard Ppt File Visual Aids PDF
This slide covers customer referral program performance evaluating dashboard. It involves participation rate by referrals, number of referred customers, conversion rate and total revenue generated. Pitch your topic with ease and precision using this Customer Client Referral Program Performance Dashboard Ppt File Visual Aids PDF. This layout presents information on Participation Rate Referrals, Number Referred Customers, Referral Conversion Rate. It is also available for immediate download and adjustment. So, changes can be made in the color, design, graphics or any other component to create a unique layout.
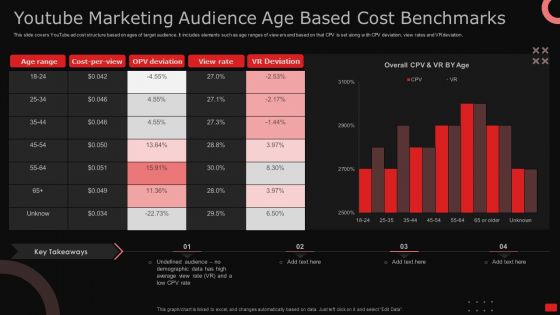
Youtube Marketing Audience Age Based Cost Benchmarks Ppt Model Show PDF
This slide covers YouTube ad cost structure based on ages of target audience. It includes elements such as age ranges of viewers and based on that CPV is set along with CPV deviation, view rates and VR deviation. Pitch your topic with ease and precision using this Youtube Marketing Audience Age Based Cost Benchmarks Ppt Model Show PDF. This layout presents information on Age Range, Cost Per View, OPV Deviation. It is also available for immediate download and adjustment. So, changes can be made in the color, design, graphics or any other component to create a unique layout.
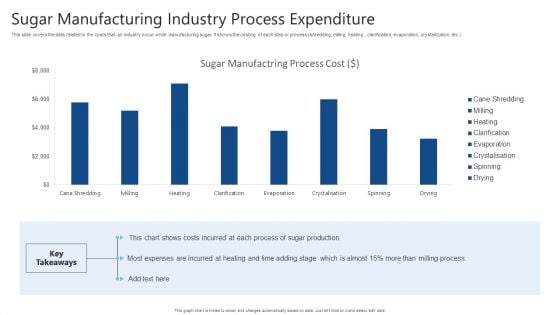
Sugar Manufacturing Industry Process Expenditure Ppt Infographic Template Information PDF
This slide covers the data related to the costs that an industry occur while manufacturing sugar. It shows the costing of each step or process shredding, milling, heating, clarification, evaporation, crystallization, etc. Pitch your topic with ease and precision using this Sugar Manufacturing Industry Process Expenditure Ppt Infographic Template Information PDF. This layout presents information on Sugar Manufactring Process, Cost, Sugar Production. It is also available for immediate download and adjustment. So, changes can be made in the color, design, graphics or any other component to create a unique layout.
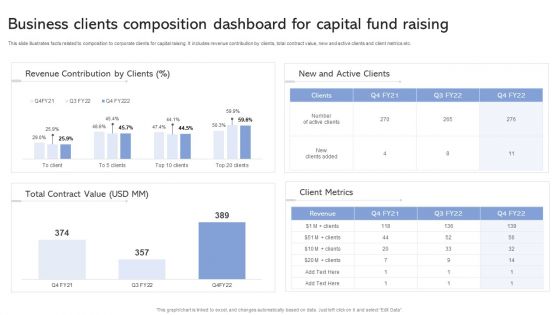
Business Clients Composition Dashboard For Capital Fund Raising Ppt Infographic Template Microsoft PDF
This slide illustrates facts related to composition to corporate clients for capital raising. It includes revenue contribution by clients, total contract value, new and active clients and client metrics etc. Showcasing this set of slides titled Business Clients Composition Dashboard For Capital Fund Raising Ppt Infographic Template Microsoft PDF. The topics addressed in these templates are Revenue Contribution Clients, Client Metrics, Total Contract Value. All the content presented in this PPT design is completely editable. Download it and make adjustments in color, background, font etc. as per your unique business setting.
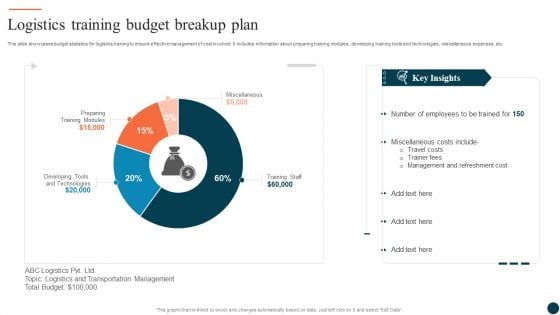
Logistics Training Budget Breakup Plan Ppt Infographics Infographic Template PDF
This slide showcases budget statistics for logistics training to ensure effective management of cost involved. It includes information about preparing training modules, developing training tools and technologies, miscellaneous expenses, etc. Showcasing this set of slides titled Logistics Training Budget Breakup Plan Ppt Infographics Infographic Template PDF. The topics addressed in these templates are Miscellaneous, Training Staff, Preparing Training Modules. All the content presented in this PPT design is completely editable. Download it and make adjustments in color, background, font etc. as per your unique business setting.
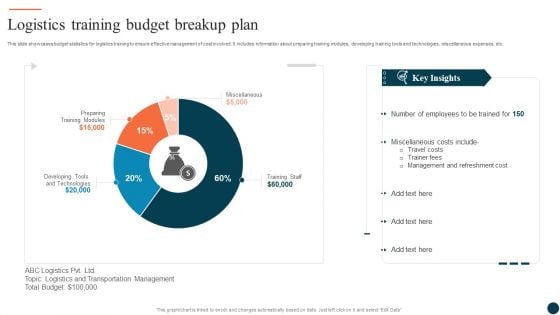
Logistics Training Budget Breakup Plan Ppt Inspiration Graphic Images PDF
This slide showcases budget statistics for logistics training to ensure effective management of cost involved. It includes information about preparing training modules, developing training tools and technologies, miscellaneous expenses, etc. Showcasing this set of slides titled Logistics Training Budget Breakup Plan Ppt Inspiration Graphic Images PDF. The topics addressed in these templates are Preparing Training Modules, Miscellaneous, Training Staff. All the content presented in this PPT design is completely editable. Download it and make adjustments in color, background, font etc. as per your unique business setting.
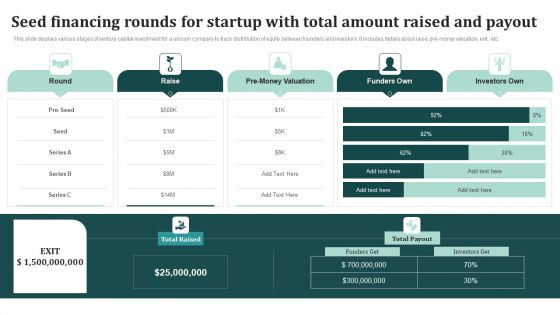
Seed Financing Rounds For Startup With Total Amount Raised And Payout Mockup PDF
This slide displays various stages of venture capital investment for a unicorn company to track distribution of equity between founders and investors. It includes details about raise, pre-money valuation, exit, etc. Showcasing this set of slides titled Seed Financing Rounds For Startup With Total Amount Raised And Payout Mockup PDF. The topics addressed in these templates are Funders Own, Investors Own, Total Raised. All the content presented in this PPT design is completely editable. Download it and make adjustments in color, background, font etc. as per your unique business setting.
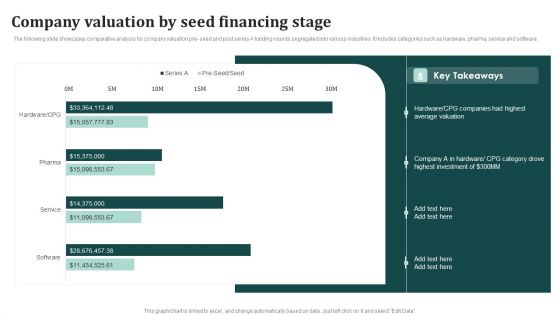
Company Valuation By Seed Financing Stage Ppt Infographic Template Graphics Tutorials PDF
The following slide showcases comparative analysis for company valuation pre- seed and post series A funding rounds segregated into various industries. It includes categories such as hardware, pharma, service and software. Showcasing this set of slides titled Company Valuation By Seed Financing Stage Ppt Infographic Template Graphics Tutorials PDF. The topics addressed in these templates are CPG Companies, Highest Average Valuation, Highest Investment. All the content presented in this PPT design is completely editable. Download it and make adjustments in color, background, font etc. as per your unique business setting.
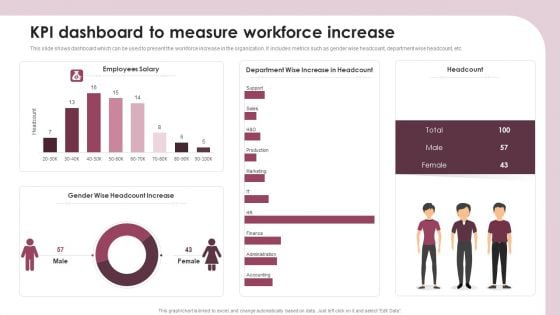
KPI Dashboard To Measure Workforce Increase Ppt Slides Elements PDF
This slide shows dashboard which can be used to present the workforce increase in the organization. It includes metrics such as gender wise headcount, department wise headcount, etc. Showcasing this set of slides titled KPI Dashboard To Measure Workforce Increase Ppt Slides Elements PDF. The topics addressed in these templates are Employees Salary, Headcount, Gender Wise, Headcount Increase. All the content presented in this PPT design is completely editable. Download it and make adjustments in color, background, font etc. as per your unique business setting.
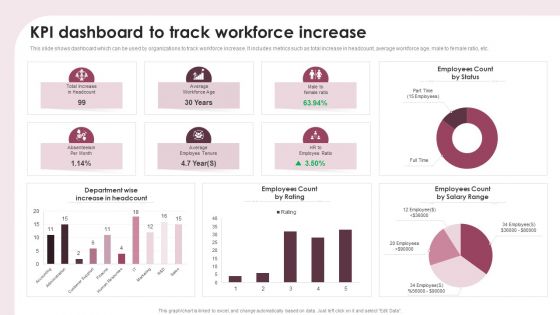
KPI Dashboard To Track Workforce Increase Ppt Show Portfolio PDF
This slide shows dashboard which can be used by organizations to track workforce increase. It includes metrics such as total increase in headcount, average workforce age, male to female ratio, etc. Pitch your topic with ease and precision using this KPI Dashboard To Track Workforce Increase Ppt Show Portfolio PDF. This layout presents information on Department Wise, Increase Headcount, Employees Count Rating. It is also available for immediate download and adjustment. So, changes can be made in the color, design, graphics or any other component to create a unique layout.
Altcoins Portfolio Tracking Metrics Dashboard Ppt Inspiration Background Images PDF
This slide covers dashboard for tracking different cryptocurrencies value and growth. It includes metrics such as incomes and expenses, market values, cryptocurrency transactions history, overall growth percentages, exchange rates, etc. Showcasing this set of slides titled Altcoins Portfolio Tracking Metrics Dashboard Ppt Inspiration Background Images PDF. The topics addressed in these templates are Balance, 3 Currencies, Transactions. All the content presented in this PPT design is completely editable. Download it and make adjustments in color, background, font etc. as per your unique business setting.
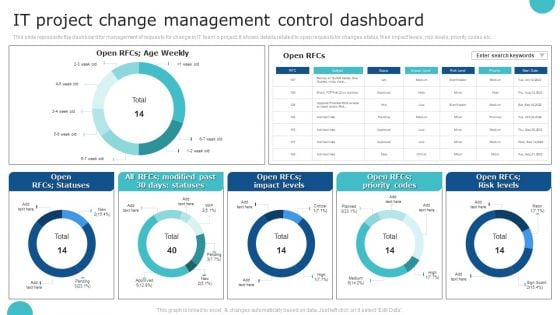
IT Project Change Management Control Dashboard Topics PDF
This slide represents the dashboard for management of requests for change in IT teams project. It shows details related to open requests for changes status, their impact levels, risk levels, priority codes etc. Showcasing this set of slides titled IT Project Change Management Control Dashboard Topics PDF. The topics addressed in these templates are IT Project Change Management, Control Dashboard. All the content presented in this PPT design is completely editable. Download it and make adjustments in color, background, font etc. as per your unique business setting.
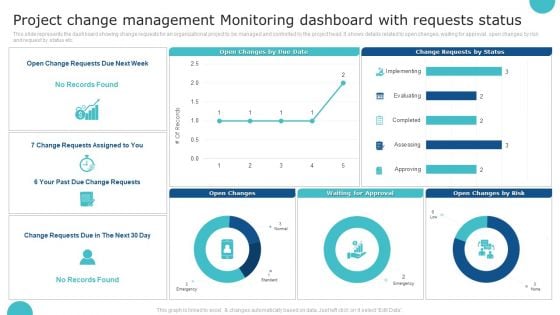
Project Change Management Monitoring Dashboard With Requests Status Structure PDF
This slide represents the dashboard showing change requests for an organizational project to be managed and controlled by the project head. It shows details related to open changes, waiting for approval, open changes by risk and request by status etc. Showcasing this set of slides titled Project Change Management Monitoring Dashboard With Requests Status Structure PDF. The topics addressed in these templates are Project Change Management, Monitoring Dashboard. All the content presented in this PPT design is completely editable. Download it and make adjustments in color, background, font etc. as per your unique business setting.
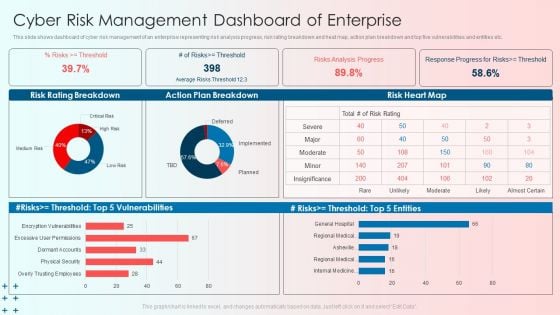
Cyber Risk Management Dashboard Of Enterprise Guidelines PDF
This slide shows dashboard of cyber risk management of an enterprise representing risk analysis progress, risk rating breakdown and heat map, action plan breakdown and top five vulnerabilities and entities etc. Showcasing this set of slides titled Cyber Risk Management Dashboard Of Enterprise Guidelines PDF. The topics addressed in these templates are Cyber Risk Management Dashboard, Enterprise. All the content presented in this PPT design is completely editable. Download it and make adjustments in color, background, font etc. as per your unique business setting.
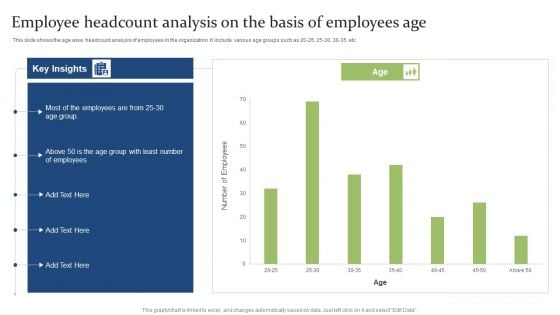
Employee Headcount Analysis On The Basis Of Employees Age Ppt PowerPoint Presentation Model Ideas PDF
This slide shows the age wise headcount analysis of employees in the organization. It include various age groups such as 20 25, 25 30, 30 35, etc.Pitch your topic with ease and precision using this Employee Headcount Analysis On The Basis Of Employees Age Ppt PowerPoint Presentation Model Ideas PDF. This layout presents information on Employee Headcount, Analysis Basis, Employees Age. It is also available for immediate download and adjustment. So, changes can be made in the color, design, graphics or any other component to create a unique layout.
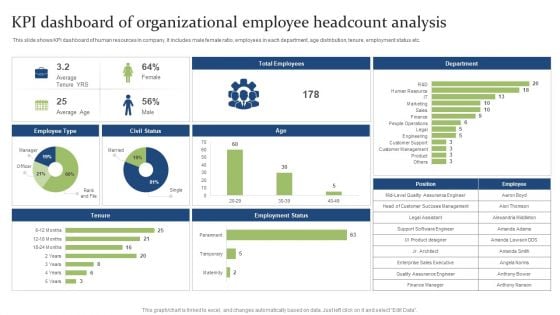
KPI Dashboard Of Organizational Employee Headcount Analysis Ppt PowerPoint Presentation Styles Show PDF
This slide shows KPI dashboard of human resources in company. It includes male female ratio, employees in each department, age distribution, tenure, employment status etc. Showcasing this set of slides titled KPI Dashboard Of Organizational Employee Headcount Analysis Ppt PowerPoint Presentation Styles Show PDF. The topics addressed in these templates are Support Software, Engineer Success, Sales Executive. All the content presented in this PPT design is completely editable. Download it and make adjustments in color, background, font etc. as per your unique business setting.
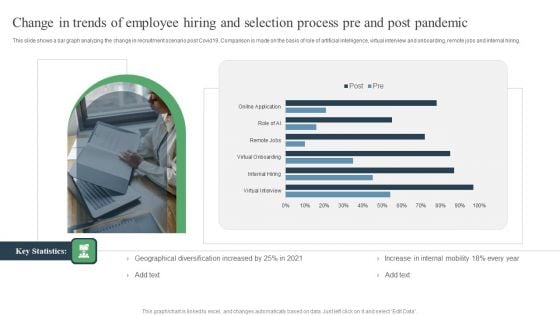
Change In Trends Of Employee Hiring And Selection Process Pre And Post Pandemic Ppt PowerPoint Presentation Images PDF
This slide shows a bar graph analyzing the change in recruitment scenario post Covid19. Comparison is made on the basis of role of artificial intelligence, virtual interview and onboarding, remote jobs and internal hiring. Showcasing this set of slides titled Change In Trends Of Employee Hiring And Selection Process Pre And Post Pandemic Ppt PowerPoint Presentation Images PDF. The topics addressed in these templates are Geographical Diversification, Internal Mobility, Virtual Onboarding. All the content presented in this PPT design is completely editable. Download it and make adjustments in color, background, font etc. as per your unique business setting.
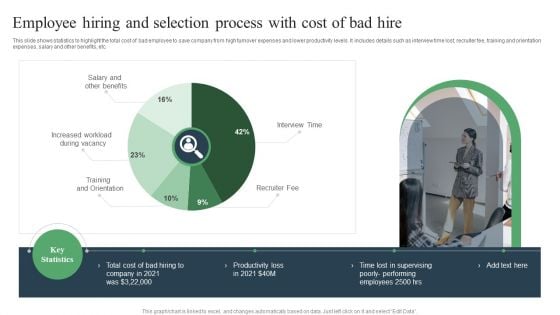
Employee Hiring And Selection Process With Cost Of Bad Hire Ppt PowerPoint Presentation Outline Skills PDF
This slide shows statistics to highlight the total cost of bad employee to save company from high turnover expenses and lower productivity levels. It includes details such as interview time lost, recruiter fee, training and orientation expenses, salary and other benefits, etc. Pitch your topic with ease and precision using this Employee Hiring And Selection Process With Cost Of Bad Hire Ppt PowerPoint Presentation Outline Skills PDF. This layout presents information on Employee Hiring, Selection Process, Candidate Screening. It is also available for immediate download and adjustment. So, changes can be made in the color, design, graphics or any other component to create a unique layout.
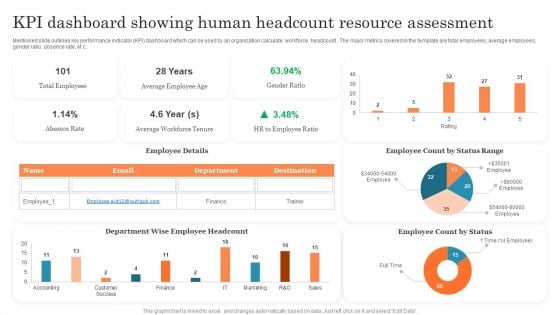
KPI Dashboard Showing Human Headcount Resource Assessment Ppt PowerPoint Presentation Outline PDF
Mentioned slide outlines key performance indicator KPI dashboard which can be used by an organization calculate workforce headcount . The major metrics covered in the template are total employees, average employees, gender ratio, absence rate, etc. Pitch your topic with ease and precision using this KPI Dashboard Showing Human Headcount Resource Assessment Ppt PowerPoint Presentation Outline PDF. This layout presents information on Total Employees, Average Employee, Employee Count. It is also available for immediate download and adjustment. So, changes can be made in the color, design, graphics or any other component to create a unique layout.
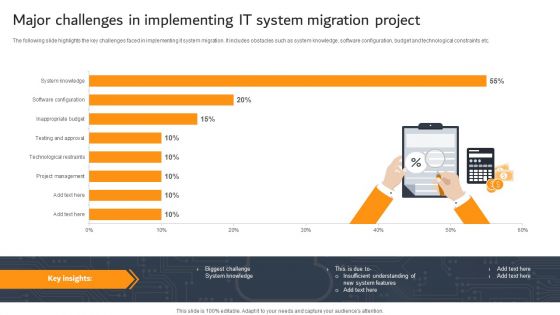
Major Challenges In Implementing IT System Migration Project Ppt PowerPoint Presentation Outline Graphics PDF
The following slide highlights the key challenges faced in implementing it system migration. It includes obstacles such as system knowledge, software configuration, budget and technological constraints etc.Pitch your topic with ease and precision using this Major Challenges In Implementing IT System Migration Project Ppt PowerPoint Presentation Outline Graphics PDF. This layout presents information on Insufficient Understanding, System Features, Project Management. It is also available for immediate download and adjustment. So, changes can be made in the color, design, graphics or any other component to create a unique layout.
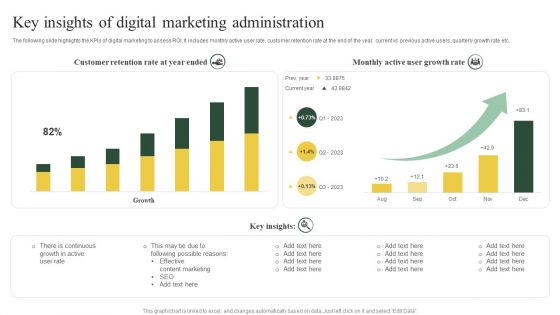
Key Insights Of Digital Marketing Administration Ppt PowerPoint Presentation Styles Graphics Template PDF
The following slide highlights the KPIs of digital marketing to assess ROI. It includes monthly active user rate, customer retention rate at the end of the year, current vs previous active users, quarterly growth rate etc.Pitch your topic with ease and precision using this Key Insights Of Digital Marketing Administration Ppt PowerPoint Presentation Styles Graphics Template PDF. This layout presents information on Possible Reasons, Content Marketing, Growth Rate. It is also available for immediate download and adjustment. So, changes can be made in the color, design, graphics or any other component to create a unique layout.
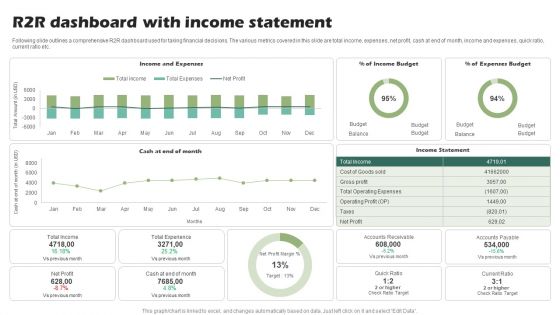
R2R Dashboard With Income Statement Ppt PowerPoint Presentation Show Slide Download PDF
Following slide outlines a comprehensive R2R dashboard used for taking financial decisions. The various metrics covered in this slide are total income, expenses, net profit, cash at end of month, income and expenses, quick ratio, current ratio etc.Showcasing this set of slides titled R2R Dashboard With Income Statement Ppt PowerPoint Presentation Show Slide Download PDF. The topics addressed in these templates are Operating Expenses, Total Experience, Accounts Receivable. All the content presented in this PPT design is completely editable. Download it and make adjustments in color, background, font etc. as per your unique business setting.
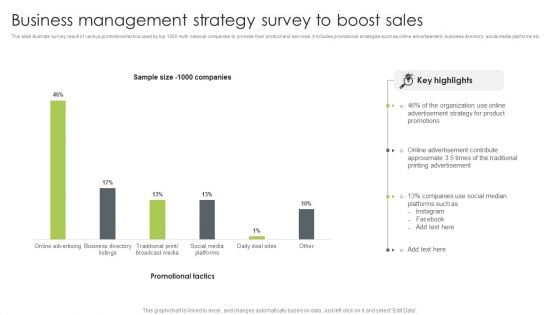
Business Management Strategy Survey To Boost Sales Summary PDF
This slide illustrate survey result of various promotional tactics used by top 1000 multi national companies to promote their product and services. it includes promotional strategies such as online advertisement, business directory, social media platforms etc. Pitch your topic with ease and precision using this Business Management Strategy Survey To Boost Sales Summary PDF. This layout presents information on Advertisement Strategy, Organization, Social Median. It is also available for immediate download and adjustment. So, changes can be made in the color, design, graphics or any other component to create a unique layout.
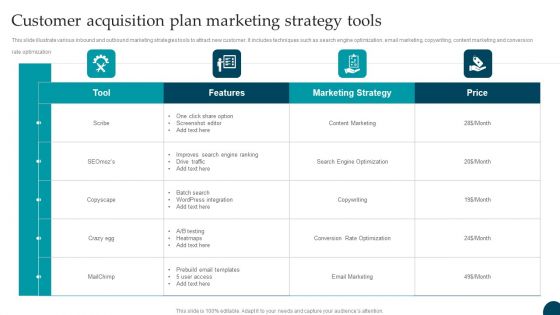
Customer Acquisition Plan Marketing Strategy Tools Information PDF
This slide illustrate success rate of various platform used for attracting and acquiring customer. It includes marketing tools such as website, email marketing, word of mouth communication, print advertisement, social media platforms etc. Showcasing this set of slides titled Customer Acquisition Plan Marketing Strategy Tools Information PDF. The topics addressed in these templates are Strategies, Customers, Marketing. All the content presented in this PPT design is completely editable. Download it and make adjustments in color, background, font etc. as per your unique business setting.
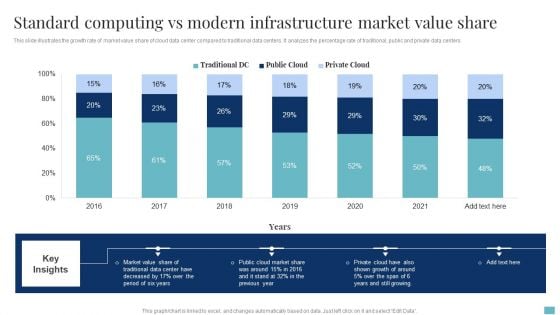
Standard Computing Vs Modern Infrastructure Market Value Share Brochure PDF
This slide illustrates the growth rate of market value share of cloud data center compared to traditional data centers. It analyzes the percentage rate of traditional, public and private data centers. Pitch your topic with ease and precision using this Standard Computing Vs Modern Infrastructure Market Value Share Brochure PDF. This layout presents information on Cloud Market Share, Market Value Share, Growth. It is also available for immediate download and adjustment. So, changes can be made in the color, design, graphics or any other component to create a unique layout.
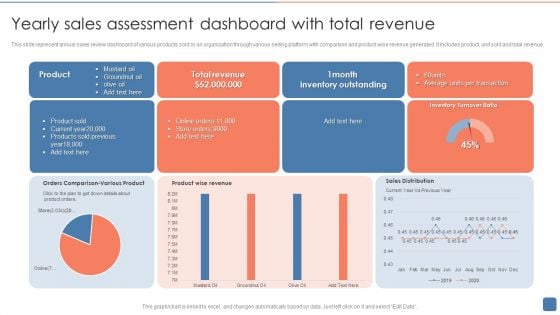
Yearly Sales Assessment Dashboard With Total Revenue Introduction PDF
This slide represent annual sales review dashboard of various products sold by an organization through various selling platform with comparison and product wise revenue generated .It includes product, unit sold and total revenue. Showcasing this set of slides titled Yearly Sales Assessment Dashboard With Total Revenue Introduction PDF. The topics addressed in these templates are Product Sold, Inventory Outstanding, Average. All the content presented in this PPT design is completely editable. Download it and make adjustments in color, background, font etc. as per your unique business setting.
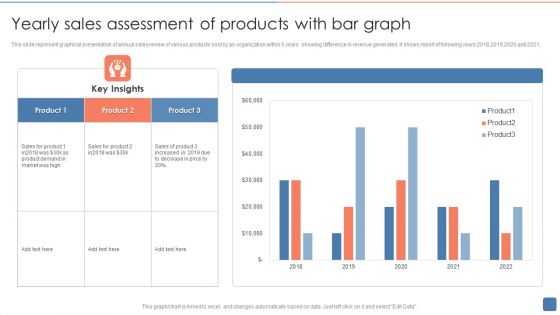
Yearly Sales Assessment Of Products With Bar Graph Structure PDF
This slide represent graphical presentation of annual sales review of various products sold by an organization within 5 years showing difference in revenue generated .It shows report of following years 2018,2019,2020,and 2021. Showcasing this set of slides titled Yearly Sales Assessment Of Products With Bar Graph Structure PDF. The topics addressed in these templates are Product, Sales Of Product, Product Demand. All the content presented in this PPT design is completely editable. Download it and make adjustments in color, background, font etc. as per your unique business setting.


 Continue with Email

 Home
Home


