Architecture Icons
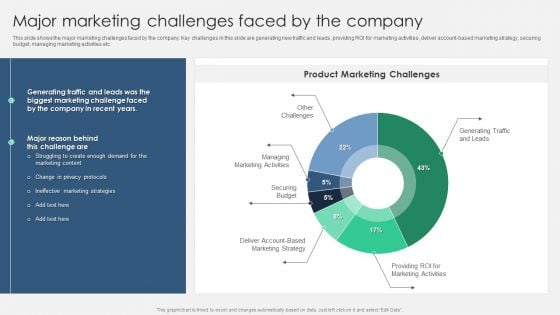
Product Marketing Management To Enforce Business Performance Major Marketing Challenges Brochure PDF
This slide shows the major marketing challenges faced by the company. Key challenges in this slide are generating new traffic and leads, providing ROI for marketing activities, deliver account based marketing strategy, securing budget, managing marketing activities etc. Find a pre designed and impeccable Product Marketing Management To Enforce Business Performance Major Marketing Challenges Brochure PDF. The templates can ace your presentation without additional effort. You can download these easy to edit presentation templates to make your presentation stand out from others. So, what are you waiting for Download the template from Slidegeeks today and give a unique touch to your presentation.
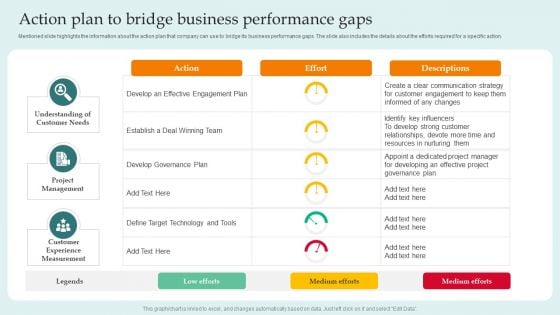
Action Plan To Bridge Business Performance Gaps Guide For Successful Merger And Acquisition Summary PDF
Mentioned slide highlights the information about the action plan that company can use to bridge its business performance gaps. The slide also includes the details about the efforts required for a specific action. Find a pre-designed and impeccable Action Plan To Bridge Business Performance Gaps Guide For Successful Merger And Acquisition Summary PDF. The templates can ace your presentation without additional effort. You can download these easy-to-edit presentation templates to make your presentation stand out from others. So, what are you waiting for Download the template from Slidegeeks today and give a unique touch to your presentation.
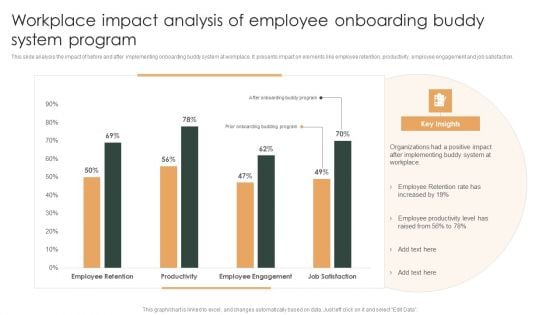
Workplace Impact Analysis Of Employee Onboarding Buddy System Program Ppt Styles Information PDF
This slide analysis the impact of before and after implementing onboarding buddy system at workplace. It presents impact on elements like employee retention, productivity, employee engagement and job satisfaction. Showcasing this set of slides titled Workplace Impact Analysis Of Employee Onboarding Buddy System Program Ppt Styles Information PDF. The topics addressed in these templates are Organizations, Positive Impact, Employee Productivity. All the content presented in this PPT design is completely editable. Download it and make adjustments in color, background, font etc. as per your unique business setting.
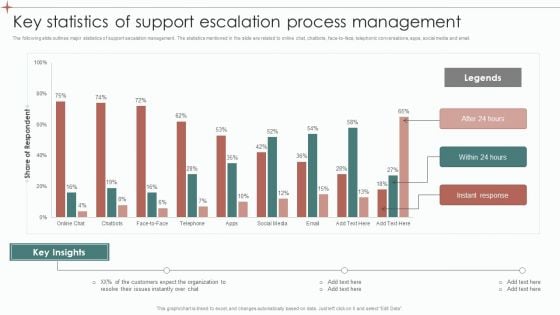
Key Statistics Of Support Escalation Process Management Ppt Model Graphics Pictures PDF
The following slide outlines major statistics of support escalation management. The statistics mentioned in the slide are related to online chat, chatbots, face-to-face, telephonic conversations, apps, social media and email. Showcasing this set of slides titled Key Statistics Of Support Escalation Process Management Ppt Model Graphics Pictures PDF. The topics addressed in these templates are Legends, Key Insights, Customers Expect. All the content presented in this PPT design is completely editable. Download it and make adjustments in color, background, font etc. as per your unique business setting.
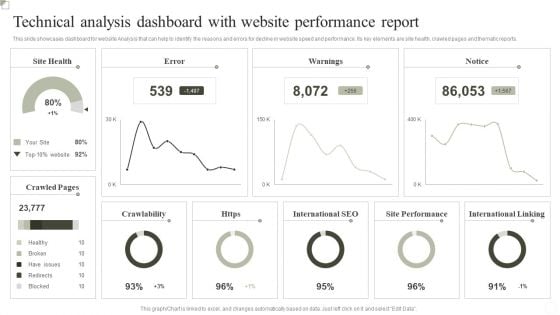
Technical Analysis Dashboard With Website Performance Report Ppt Inspiration Outline PDF
This slide showcases dashboard for website Analysis that can help to identify the reasons and errors for decline in website speed and performance. Its key elements are site health, crawled pages and thematic reports. Showcasing this set of slides titled Technical Analysis Dashboard With Website Performance Report Ppt Inspiration Outline PDF. The topics addressed in these templates are Crawlability, International SEO, Site Performance, International Linking. All the content presented in this PPT design is completely editable. Download it and make adjustments in color, background, font etc. as per your unique business setting.
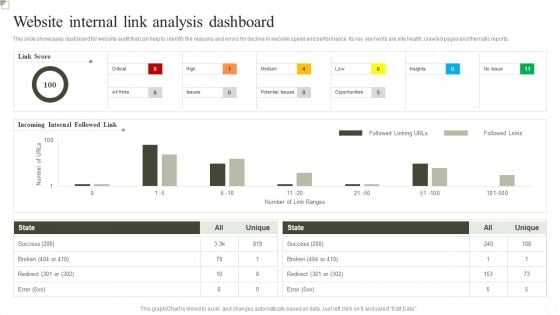
Website Internal Link Analysis Dashboard Ppt Inspiration Outline PDF
This slide showcases dashboard for website Analysis that can help to identify the reasons and errors for decline in website speed and performance. Its key elements are site health, crawled pages and thematic reports. Pitch your topic with ease and precision using this Website Internal Link Analysis Dashboard Ppt Inspiration Outline PDF. This layout presents information on Success, Incoming Internal Followed Link, Link Score. It is also available for immediate download and adjustment. So, changes can be made in the color, design, graphics or any other component to create a unique layout.
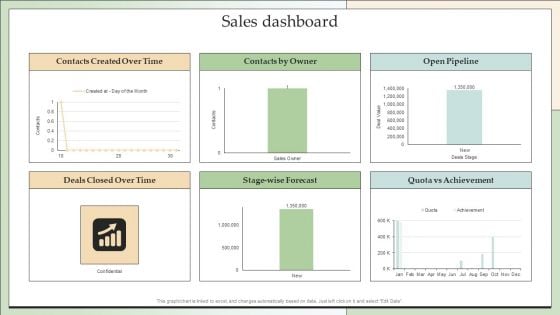
Customer Lead Development Management Strategies Sales Dashboard Sample PDF
Explore a selection of the finest Customer Lead Development Management Strategies Sales Dashboard Sample PDF here. With a plethora of professionally designed and pre made slide templates, you can quickly and easily find the right one for your upcoming presentation. You can use our Customer Lead Development Management Strategies Sales Dashboard Sample PDF to effectively convey your message to a wider audience. Slidegeeks has done a lot of research before preparing these presentation templates. The content can be personalized and the slides are highly editable. Grab templates today from Slidegeeks.
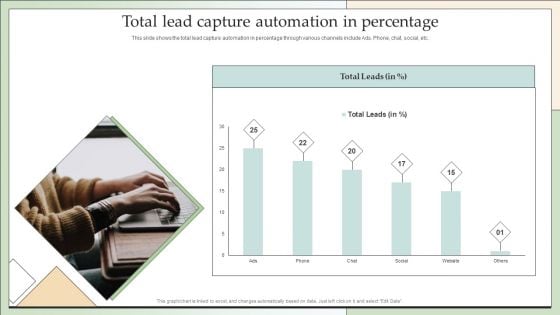
Customer Lead Development Management Strategies Total Lead Capture Automation In Percentage Brochure PDF
This slide shows the total lead capture automation in percentage through various channels include Ads. Phone, chat, social, etc. The Customer Lead Development Management Strategies Total Lead Capture Automation In Percentage Brochure PDF is a compilation of the most recent design trends as a series of slides. It is suitable for any subject or industry presentation, containing attractive visuals and photo spots for businesses to clearly express their messages. This template contains a variety of slides for the user to input data, such as structures to contrast two elements, bullet points, and slides for written information. Slidegeeks is prepared to create an impression.
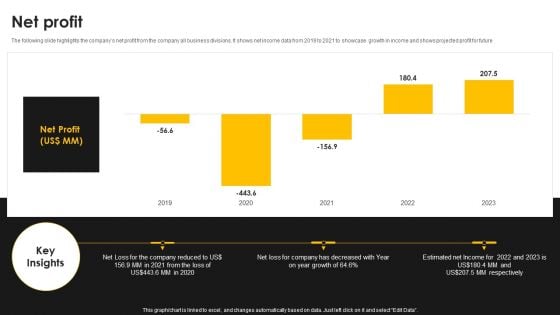
Kantar Consulting Company Outline Net Profit Elements PDF
The following slide highlights the companys net profit from the company all business divisions. It shows net income data from 2019 to 2021 to showcase growth in income and shows projected profit for future. Find a pre designed and impeccable Kantar Consulting Company Outline Net Profit Elements PDF. The templates can ace your presentation without additional effort. You can download these easy to edit presentation templates to make your presentation stand out from others. So, what are you waiting for Download the template from Slidegeeks today and give a unique touch to your presentation.
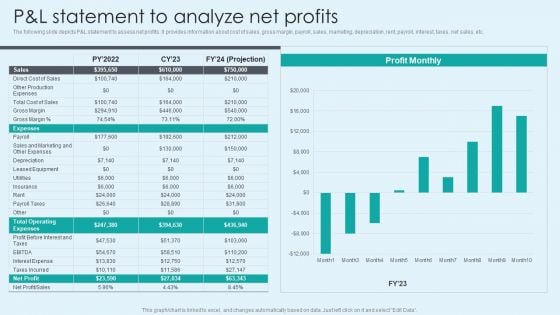
P And L Statement To Analyze Net Profits Mockup PDF
The following slide depicts P and L statement to assess net profits. It provides information about cost of sales, gross margin, payroll, sales, marketing, depreciation, rent, payroll, interest, taxes, net sales, etc. Find a pre designed and impeccable P And L Statement To Analyze Net Profits Mockup PDF. The templates can ace your presentation without additional effort. You can download these easy to edit presentation templates to make your presentation stand out from others. So, what are you waiting for Download the template from Slidegeeks today and give a unique touch to your presentation.
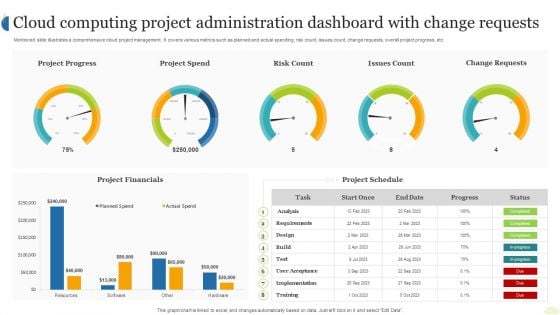
Cloud Computing Project Administration Dashboard With Change Requests Ppt Layouts Background Images PDF
Mentioned slide illustrates a comprehensive cloud project management. It covers various metrics such as planned and actual spending, risk count, issues count, change requests, overall project progress, etc. Showcasing this set of slides titled Cloud Computing Project Administration Dashboard With Change Requests Ppt Layouts Background Images PDF. The topics addressed in these templates are Project Financials, Project Spend, Project Progress. All the content presented in this PPT design is completely editable. Download it and make adjustments in color, background, font etc. as per your unique business setting.
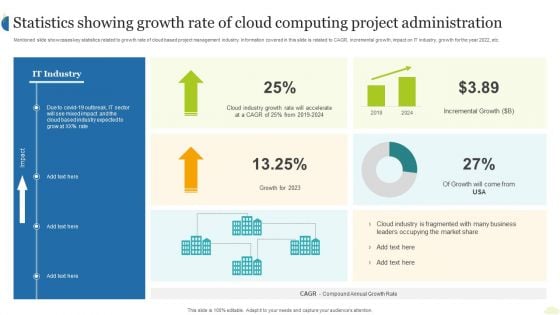
Statistics Showing Growth Rate Of Cloud Computing Project Administration Ppt Ideas Aids PDF
Mentioned slide showcases key statistics related to growth rate of cloud based project management industry. Information covered in this slide is related to CAGR, incremental growth, impact on IT industry, growth for the year 2022, etc. Showcasing this set of slides titled Statistics Showing Growth Rate Of Cloud Computing Project Administration Ppt Ideas Aids PDF. The topics addressed in these templates are IT Industry, Growth 2023, Incremental Growth. All the content presented in this PPT design is completely editable. Download it and make adjustments in color, background, font etc. as per your unique business setting.
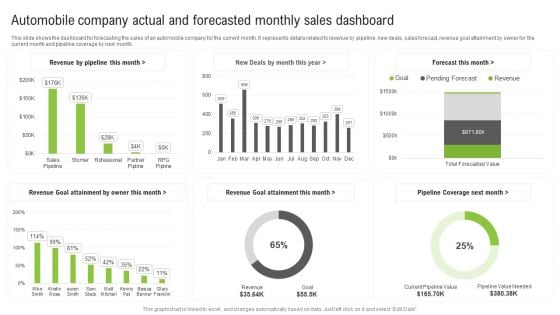
Automobile Company Actual And Forecasted Monthly Sales Dashboard Ppt Infographic Template Aids PDF
This slide shows the dashboard for forecasting the sales of an automobile company for the current month. It represents details related to revenue by pipeline, new deals, sales forecast, revenue goal attainment by owner for the current month and pipeline coverage by next month. Showcasing this set of slides titled Automobile Company Actual And Forecasted Monthly Sales Dashboard Ppt Infographic Template Aids PDF. The topics addressed in these templates are Forecast Month, Revenue Goal Attainment, Revenue Goal Attainment. All the content presented in this PPT design is completely editable. Download it and make adjustments in color, background, font etc. as per your unique business setting.
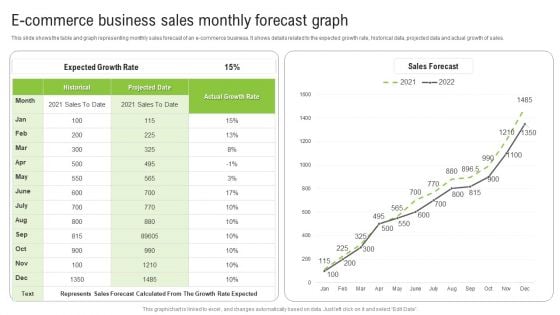
E Commerce Business Sales Monthly Forecast Graph Ppt Infographics Show PDF
This slide shows the table and graph representing monthly sales forecast of an e-commerce business. It shows details related to the expected growth rate, historical data, projected data and actual growth of sales. Pitch your topic with ease and precision using this E Commerce Business Sales Monthly Forecast Graph Ppt Infographics Show PDF. This layout presents information on Expected Growth Rate, Historical, Actual Growth Rate. It is also available for immediate download and adjustment. So, changes can be made in the color, design, graphics or any other component to create a unique layout.
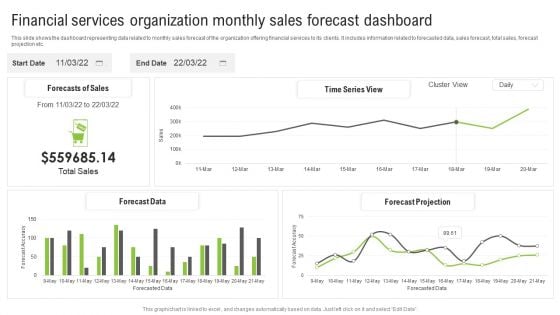
Financial Services Organization Monthly Sales Forecast Dashboard Ppt Summary Slideshow PDF
This slide shows the dashboard representing data related to monthly sales forecast of the organization offering financial services to its clients. It includes information related to forecasted data, sales forecast, total sales, forecast projection etc. Showcasing this set of slides titled Financial Services Organization Monthly Sales Forecast Dashboard Ppt Summary Slideshow PDF. The topics addressed in these templates are Forecasts Sales, Time Series View, Forecast Projection. All the content presented in this PPT design is completely editable. Download it and make adjustments in color, background, font etc. as per your unique business setting.
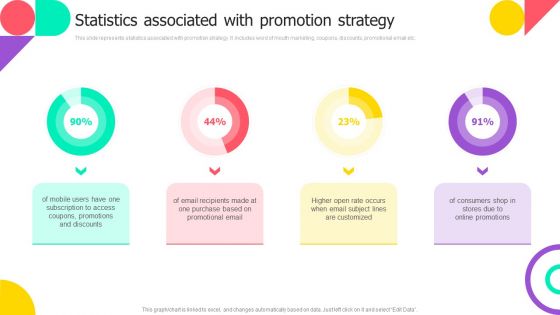
Brand Engagement Promotional Campaign Implementation Statistics Associated With Promotion Strategy Structure PDF
This slide represents statistics associated with promotion strategy. It includes word of mouth marketing, coupons, discounts, promotional email etc. Create an editable Brand Engagement Promotional Campaign Implementation Statistics Associated With Promotion Strategy Structure PDF that communicates your idea and engages your audience. Whether you are presenting a business or an educational presentation, pre designed presentation templates help save time. Brand Engagement Promotional Campaign Implementation Statistics Associated With Promotion Strategy Structure PDF is highly customizable and very easy to edit, covering many different styles from creative to business presentations. Slidegeeks has creative team members who have crafted amazing templates. So, go and get them without any delay.
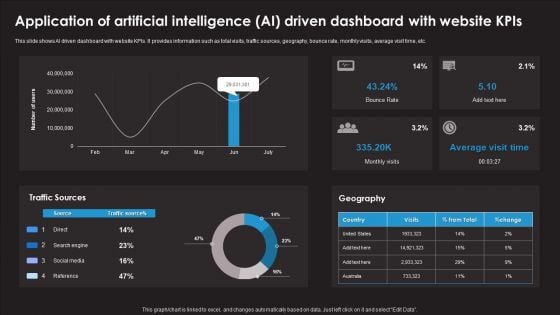
Application Of Artificial Intelligence AI Driven Dashboard With Website Kpis Formats PDF
This slide shows AI driven dashboard with website KPIs. It provides information such as total visits, traffic sources, geography, bounce rate, monthly visits, average visit time, etc. Showcasing this set of slides titled Application Of Artificial Intelligence AI Driven Dashboard With Website Kpis Formats PDF. The topics addressed in these templates are Bounce Rate, Monthly Visits, Traffic Sources. All the content presented in this PPT design is completely editable. Download it and make adjustments in color, background, font etc. as per your unique business setting.
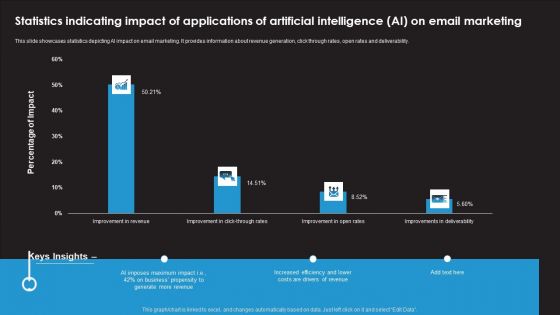
Statistics Indicating Impact Of Applications Of Artificial Intelligence AI On Email Marketing Inspiration PDF
This slide showcases statistics depicting AI impact on email marketing. It provides information about revenue generation, click through rates, open rates and deliverability. Showcasing this set of slides titled Statistics Indicating Impact Of Applications Of Artificial Intelligence AI On Email Marketing Inspiration PDF. The topics addressed in these templates are AI Imposes Maximum Impact, Business Propensity, Increased Efficiency. All the content presented in this PPT design is completely editable. Download it and make adjustments in color, background, font etc. as per your unique business setting.
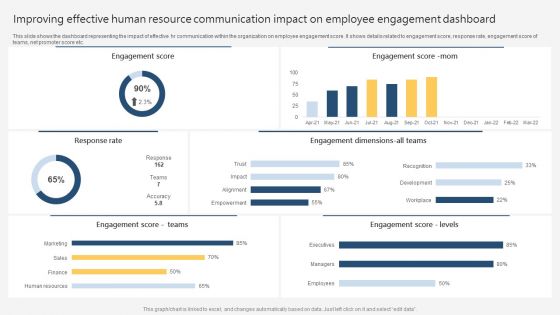
Improving Effective Human Resource Communication Impact On Employee Engagement Dashboard Slides PDF
This slide shows the dashboard representing the impact of effective hr communication within the organization on employee engagement score. It shows details related to engagement score, response rate, engagement score of teams, net promoter score etc. Pitch your topic with ease and precision using this Improving Effective Human Resource Communication Impact On Employee Engagement Dashboard Slides PDF. This layout presents information on Engagement Score, Response Rate, Engagement Score Levels. It is also available for immediate download and adjustment. So, changes can be made in the color, design, graphics or any other component to create a unique layout.

Media Of Mass Communication Marketing Campaign Assessment Dashboard Summary PDF
This slide covers mass media marketing campaign assessment KPI dashboard. It involves details such as total campaign cost, total impressions, click through rate, conversion rate and cost per click. Showcasing this set of slides titled Media Of Mass Communication Marketing Campaign Assessment Dashboard Summary PDF. The topics addressed in these templates are Total Impression, Click Through Rate, Ad Impressions, Conversions. All the content presented in this PPT design is completely editable. Download it and make adjustments in color, background, font etc. as per your unique business setting.
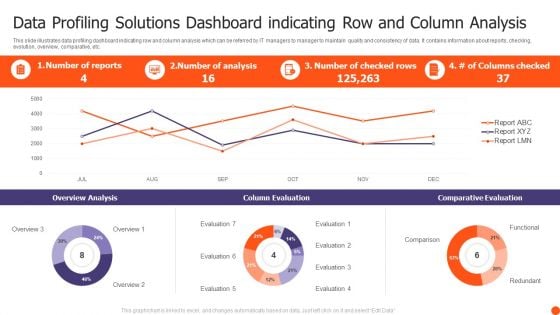
Data Profiling Solutions Dashboard Indicating Row And Column Analysis Summary PDF
This slide illustrates data profiling dashboard indicating row and column analysis which can be referred by IT managers to manager to maintain quality and consistency of data. It contains information about reports, checking, evolution, overview, comparative, etc. Showcasing this set of slides titled Data Profiling Solutions Dashboard Indicating Row And Column Analysis Summary PDF. The topics addressed in these templates are Overview Analysis, Column Evaluation, Comparative Evaluation. All the content presented in this PPT design is completely editable. Download it and make adjustments in color, background, font etc. as per your unique business setting.
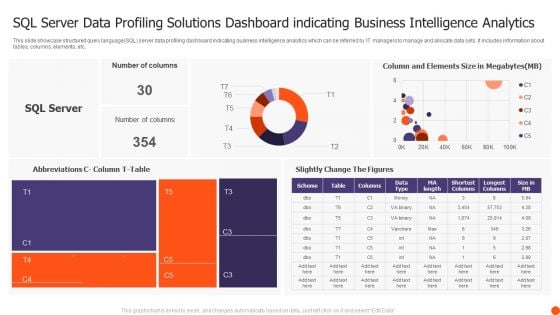
SQL Server Data Profiling Solutions Dashboard Indicating Business Intelligence Analytics Structure PDF
This slide showcase structured query language SQL server data profiling dashboard indicating business intelligence analytics which can be referred by IT managers to manage and allocate data sets. It includes information about tables, columns, elements, etc. Showcasing this set of slides titled SQL Server Data Profiling Solutions Dashboard Indicating Business Intelligence Analytics Structure PDF. The topics addressed in these templates are Number Columns, Slightly Change Figures, SQL Server. All the content presented in this PPT design is completely editable. Download it and make adjustments in color, background, font etc. as per your unique business setting.
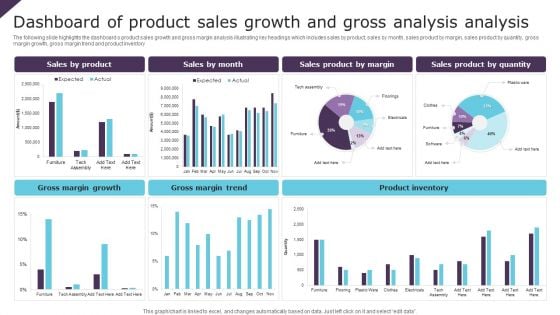
Dashboard Of Product Sales Growth And Gross Analysis Analysis Ppt Styles Good PDF
The following slide highlights the dashboard o product sales growth and gross margin analysis illustrating key headings which includes sales by product, sales by month, sales product by margin, sales product by quantity, gross margin growth, gross margin trend and product inventory. Showcasing this set of slides titled Dashboard Of Product Sales Growth And Gross Analysis Analysis Ppt Styles Good PDF. The topics addressed in these templates are Gross Margin Growth, Gross Margin Trend, Product Inventory. All the content presented in this PPT design is completely editable. Download it and make adjustments in color, background, font etc. as per your unique business setting.
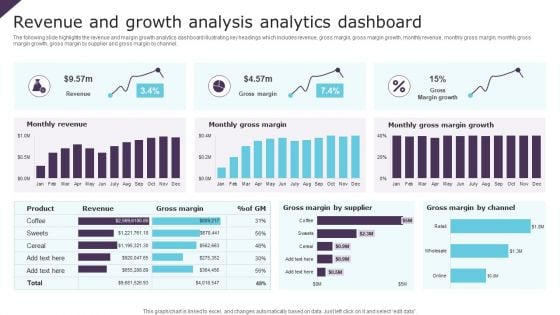
Revenue And Growth Analysis Analytics Dashboard Ppt Infographic Template Brochure PDF
The following slide highlights the revenue and margin growth analytics dashboard illustrating key headings which includes revenue, gross margin, gross margin growth, monthly revenue, monthly gross margin, monthly gross margin growth, gross margin by supplier and gross margin by channel. Pitch your topic with ease and precision using this Revenue And Growth Analysis Analytics Dashboard Ppt Infographic Template Brochure PDF. This layout presents information on Monthly Revenue, Monthly Gross Margin, Gross Margin Growth. It is also available for immediate download and adjustment. So, changes can be made in the color, design, graphics or any other component to create a unique layout.
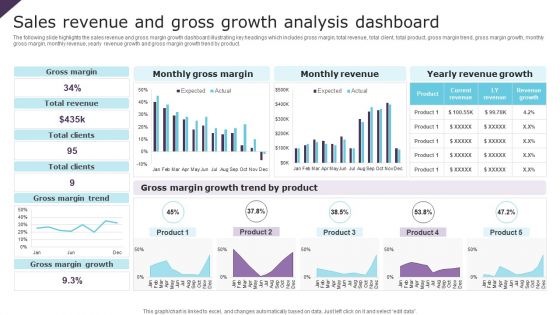
Sales Revenue And Gross Growth Analysis Dashboard Ppt Inspiration Background Image PDF
The following slide highlights the sales revenue and gross margin growth dashboard illustrating key headings which includes gross margin, total revenue, total client, total product, gross margin trend, gross margin growth, monthly gross margin, monthly revenue, yearly revenue growth and gross margin growth trend by product. Showcasing this set of slides titled Sales Revenue And Gross Growth Analysis Dashboard Ppt Inspiration Background Image PDF. The topics addressed in these templates are Gross Margin, Total Revenue, Total Clients. All the content presented in this PPT design is completely editable. Download it and make adjustments in color, background, font etc. as per your unique business setting.
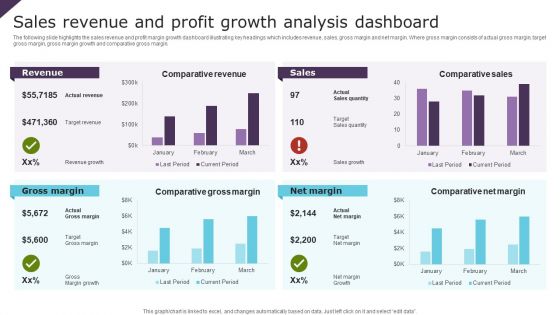
Sales Revenue And Profit Growth Analysis Dashboard Ppt Portfolio Slide PDF
The following slide highlights the sales revenue and profit margin growth dashboard illustrating key headings which includes revenue, sales, gross margin and net margin. Where gross margin consists of actual gross margin, target gross margin, gross margin growth and comparative gross margin. Showcasing this set of slides titled Sales Revenue And Profit Growth Analysis Dashboard Ppt Portfolio Slide PDF. The topics addressed in these templates are Revenue, Sales, Gross Margin, Net Margin. All the content presented in this PPT design is completely editable. Download it and make adjustments in color, background, font etc. as per your unique business setting.
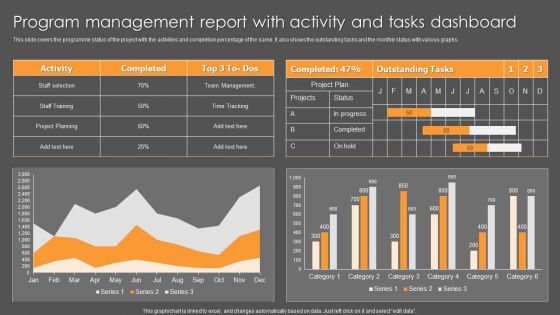
Program Management Report With Activity And Tasks Dashboard Ppt File Objects PDF
This slide covers the programme status of the project with the activities and completion percentage of the same. It also shows the outstanding tasks and the monthly status with various graphs. Pitch your topic with ease and precision using this Program Management Report With Activity And Tasks Dashboard Ppt File Objects PDF. This layout presents information on Activity, Team Management, Time Tracking. It is also available for immediate download and adjustment. So, changes can be made in the color, design, graphics or any other component to create a unique layout.
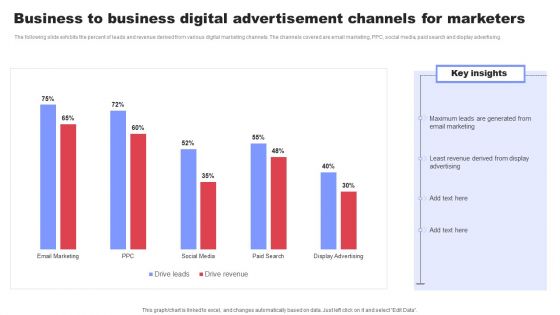
Business To Business Digital Advertisement Channels For Marketers Ppt File Background PDF
The following slide exhibits the percent of leads and revenue derived from various digital marketing channels. The channels covered are email marketing, PPC, social media, paid search and display advertising. Showcasing this set of slides titled Business To Business Digital Advertisement Channels For Marketers Ppt File Background PDF. The topics addressed in these templates are Maximum Leads, Email Marketing, Least Revenue Derived. All the content presented in this PPT design is completely editable. Download it and make adjustments in color, background, font etc. as per your unique business setting.
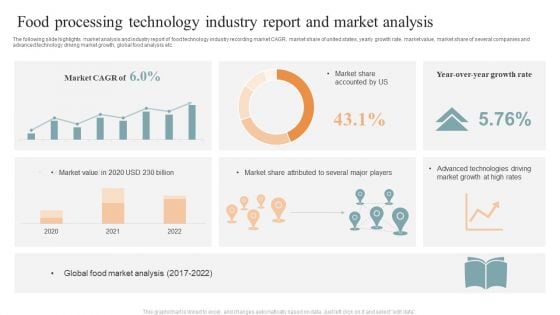
Food Processing Technology Industry Report And Market Analysis Brochure PDF
The following slide highlights market analysis and industry report of food technology industry recording market CAGR, market share of united states, yearly growth rate, market value, market share of several companies and advanced technology driving market growth, global food analysis etc. Pitch your topic with ease and precision using this Food Processing Technology Industry Report And Market Analysis Brochure PDF. This layout presents information on Market CAGR, Market Share Accounted, Global Food, Market Analysis. It is also available for immediate download and adjustment. So, changes can be made in the color, design, graphics or any other component to create a unique layout.
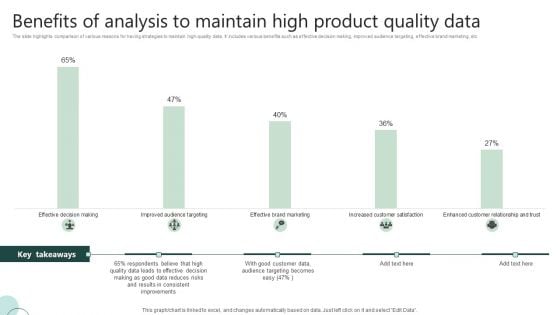
Benefits Of Analysis To Maintain High Product Quality Data Ppt Portfolio Gallery PDF
The slide highlights comparison of various reasons for having strategies to maintain high-quality data. It includes various benefits such as effective decision making, improved audience targeting, effective brand marketing, etc. Showcasing this set of slides titled Benefits Of Analysis To Maintain High Product Quality Data Ppt Portfolio Gallery PDF. The topics addressed in these templates are Effective Decision, Quality Data Leads, Good Customer Data. All the content presented in this PPT design is completely editable. Download it and make adjustments in color, background, font etc. as per your unique business setting.
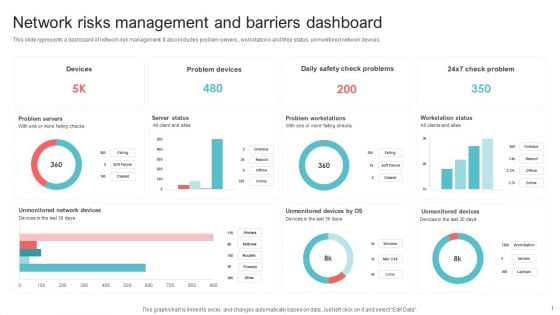
Network Risks Management And Barriers Dashboard Ppt PowerPoint Presentation Gallery Graphic Tips PDF
This slide represents a dashboard of network risk management. It also includes problem servers , workstations and their status, unmonitored network devices. Pitch your topic with ease and precision using this Network Risks Management And Barriers Dashboard Ppt PowerPoint Presentation Gallery Graphic Tips PDF. This layout presents information on Problem Servers, Server Status, Problem Workstations, Workstation Status. It is also available for immediate download and adjustment. So, changes can be made in the color, design, graphics or any other component to create a unique layout.
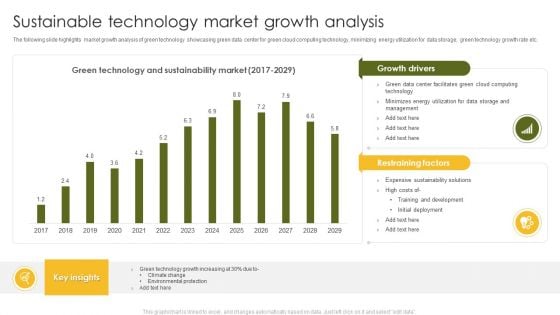
Sustainable Technology Market Growth Analysis Ppt Outline Slide Download PDF
The following slide highlights market growth analysis of green technology showcasing green data center for green cloud computing technology, minimizing energy utilization for data storage, green technology growth rate etc. Showcasing this set of slides titled Sustainable Technology Market Growth Analysis Ppt Outline Slide Download PDF. The topics addressed in these templates are Climate Change, Environmental Protection, Green Technology. All the content presented in this PPT design is completely editable. Download it and make adjustments in color, background, font etc. as per your unique business setting.
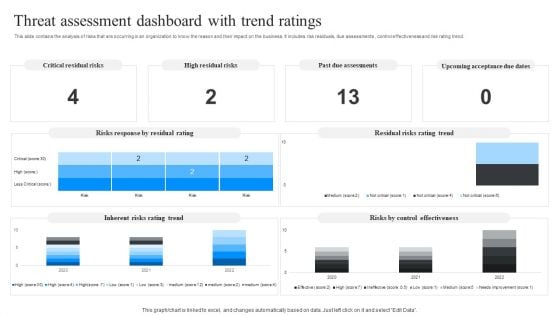
Threat Assessment Dashboard With Trend Ratings Ppt Model Vector PDF
This slide contains the analysis of risks that are occurring in an organization to know the reason and their impact on the business. It includes risk residuals, due assessments , control effectiveness and risk rating trend. Showcasing this set of slides titled Threat Assessment Dashboard With Trend Ratings Ppt Model Vector PDF. The topics addressed in these templates are Critical Residual Risks, High Residual Risks, Past Due Assessments. All the content presented in this PPT design is completely editable. Download it and make adjustments in color, background, font etc. as per your unique business setting.
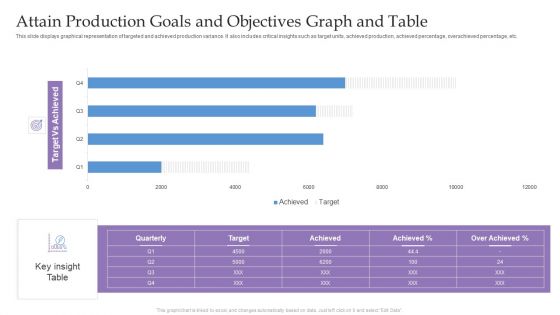
Attain Production Goals And Objectives Graph And Table Ppt Infographic Template Visuals PDF
This slide displays graphical representation of targeted and achieved production variance. It also includes critical insights such as target units, achieved production, achieved percentage, overachieved percentage, etc. Pitch your topic with ease and precision using this Attain Production Goals And Objectives Graph And Table Ppt Infographic Template Visuals PDF. This layout presents information on Target Vs Achieved, Key insight Table, Quarterly. It is also available for immediate download and adjustment. So, changes can be made in the color, design, graphics or any other component to create a unique layout.
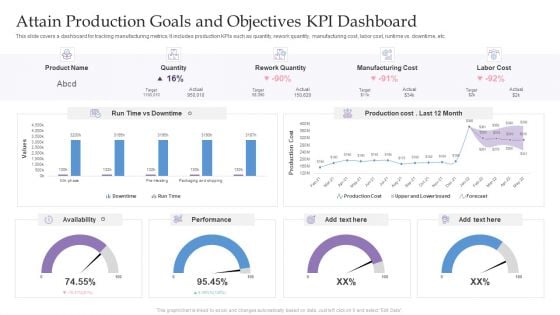
Attain Production Goals And Objectives KPI Dashboard Ppt Pictures Graphics PDF
This slide covers a dashboard for tracking manufacturing metrics. It includes production KPIs such as quantity, rework quantity, manufacturing cost, labor cost, runtime vs. downtime, etc. Showcasing this set of slides titled Attain Production Goals And Objectives KPI Dashboard Ppt Pictures Graphics PDF. The topics addressed in these templates are Product Name, Quantity, Rework Quantity, Manufacturing Cost. All the content presented in this PPT design is completely editable. Download it and make adjustments in color, background, font etc. as per your unique business setting.
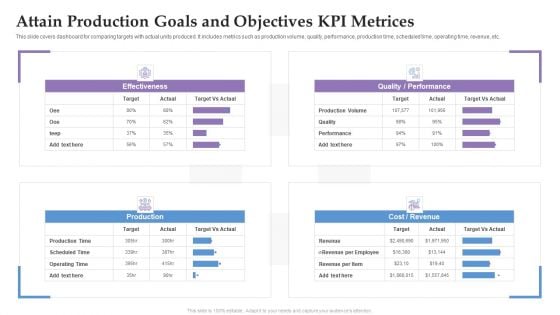
Attain Production Goals And Objectives KPI Metrices Ppt Summary Format Ideas PDF
This slide covers dashboard for comparing targets with actual units produced. It includes metrics such as production volume, quality, performance, production time, scheduled time, operating time, revenue, etc. Pitch your topic with ease and precision using this Attain Production Goals And Objectives KPI Metrices Ppt Summary Format Ideas PDF. This layout presents information on Production, Cost, Revenue, Performance. It is also available for immediate download and adjustment. So, changes can be made in the color, design, graphics or any other component to create a unique layout.
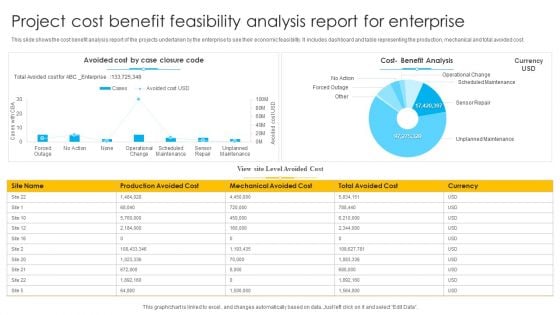
Project Cost Benefit Feasibility Analysis Report For Enterprise Ppt Layouts Background Image PDF
This slide shows the cost benefit analysis report of the projects undertaken by the enterprise to see their economic feasibility. It includes dashboard and table representing the production, mechanical and total avoided cost. Showcasing this set of slides titled Project Cost Benefit Feasibility Analysis Report For Enterprise Ppt Layouts Background Image PDF. The topics addressed in these templates are Avoided Cost, Case Closure Code, Cost Benefit Analysis, Total Avoided Cost. All the content presented in this PPT design is completely editable. Download it and make adjustments in color, background, font etc. as per your unique business setting.
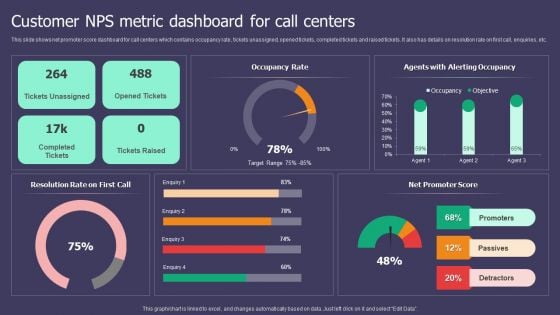
Customer NPS Metric Dashboard For Call Centers Ppt Inspiration Smartart PDF
This slide shows net promoter score dashboard for call centers which contains occupancy rate, tickets unassigned, opened tickets, completed tickets and raised tickets. It also has details on resolution rate on first call, enquiries, etc. Pitch your topic with ease and precision using this Customer NPS Metric Dashboard For Call Centers Ppt Inspiration Smartart PDF. This layout presents information on Occupancy Rate, Resolution Rate, Net Promoter Score. It is also available for immediate download and adjustment. So, changes can be made in the color, design, graphics or any other component to create a unique layout.
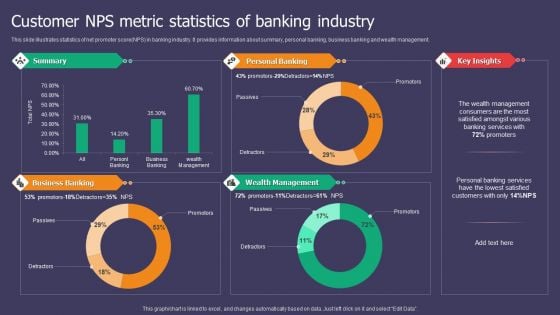
Customer NPS Metric Statistics Of Banking Industry Ppt Styles Microsoft PDF
This slide illustrates statistics of net promoter score NPS in banking industry. It provides information about summary, personal banking, business banking and wealth management. Pitch your topic with ease and precision using this Customer NPS Metric Statistics Of Banking Industry Ppt Styles Microsoft PDF. This layout presents information on Summary, Personal Banking, Business Banking, Wealth Management. It is also available for immediate download and adjustment. So, changes can be made in the color, design, graphics or any other component to create a unique layout.
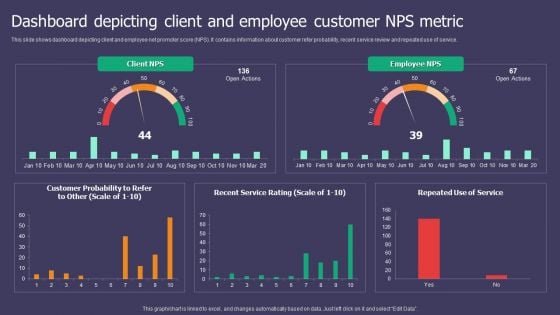
Dashboard Depicting Client And Employee Customer NPS Metric Ppt Gallery Deck PDF
This slide shows dashboard depicting client and employee net promoter score NPS. It contains information about customer refer probability, recent service review and repeated use of service. Showcasing this set of slides titled Dashboard Depicting Client And Employee Customer NPS Metric Ppt Gallery Deck PDF. The topics addressed in these templates are Client NPS, Employee NPS, Customer Probability. All the content presented in this PPT design is completely editable. Download it and make adjustments in color, background, font etc. as per your unique business setting.
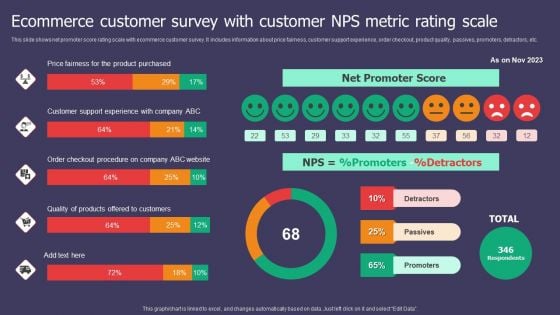
Ecommerce Customer Survey With Customer NPS Metric Rating Scale Ppt Inspiration Visual Aids PDF
This slide shows net promoter score rating scale with ecommerce customer survey. It includes information about price fairness, customer support experience, order checkout, product quality, passives, promoters, detractors, etc. Pitch your topic with ease and precision using this Ecommerce Customer Survey With Customer NPS Metric Rating Scale Ppt Inspiration Visual Aids PDF. This layout presents information on Net Promoter Score, Price Fairness, Product Purchased. It is also available for immediate download and adjustment. So, changes can be made in the color, design, graphics or any other component to create a unique layout.
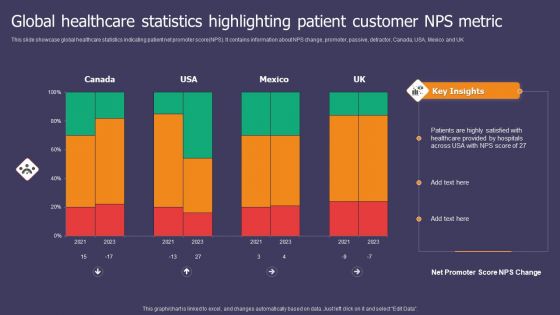
Global Healthcare Statistics Highlighting Patient Customer NPS Metric Ppt Summary Graphics Pictures PDF
This slide showcase global healthcare statistics indicating patient net promoter score NPS. It contains information about NPS change, promoter, passive, detractor, Canada, USA, Mexico and UK. Showcasing this set of slides titled Global Healthcare Statistics Highlighting Patient Customer NPS Metric Ppt Summary Graphics Pictures PDF. The topics addressed in these templates are Healthcare Provided, Hospitals Across, NPS Score. All the content presented in this PPT design is completely editable. Download it and make adjustments in color, background, font etc. as per your unique business setting.
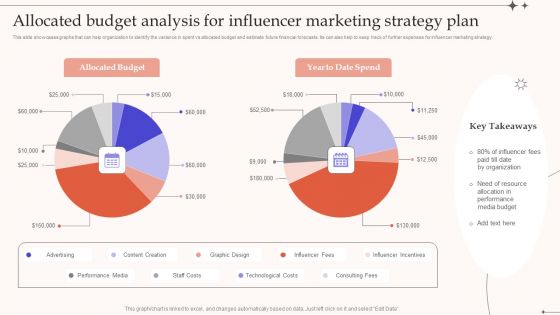
Allocated Budget Analysis For Influencer Marketing Strategy Plan Infographics PDF
This slide showcases graphs that can help organization to identify the variance in spent vs allocated budget and estimate future financial forecasts. Its can also help to keep track of further expenses for influencer marketing strategy.Showcasing this set of slides titled Allocated Budget Analysis For Influencer Marketing Strategy Plan Infographics PDF. The topics addressed in these templates are Allocated Budget, Date Organization, Performance Media Budget. All the content presented in this PPT design is completely editable. Download it and make adjustments in color, background, font etc. as per your unique business setting.
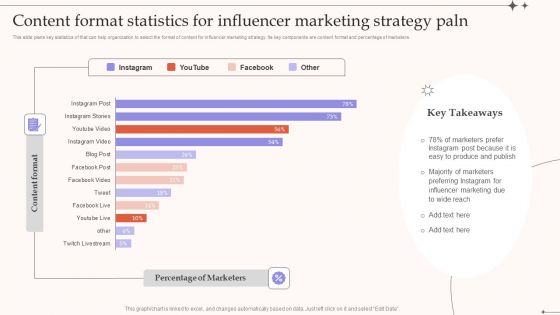
Content Format Statistics For Influencer Marketing Strategy Paln Mockup PDF
This slide plans key statistics of that can help organization to select the format of content for influencer marketing strategy. Its key components are content format and percentage of marketers.Showcasing this set of slides titled Content Format Statistics For Influencer Marketing Strategy Paln Mockup PDF. The topics addressed in these templates are Marketers Prefer, Instagram Post, Easy Produce. All the content presented in this PPT design is completely editable. Download it and make adjustments in color, background, font etc. as per your unique business setting.
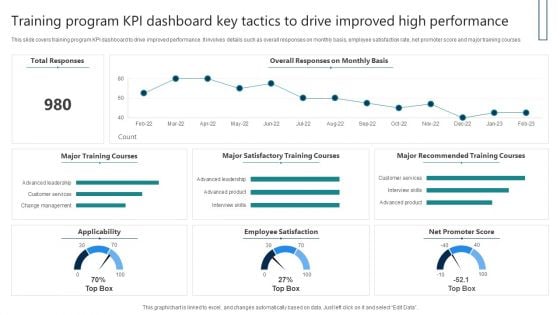
Training Program KPI Dashboard Key Tactics To Drive Improved High Performance Download PDF
This slide covers training program KPI dashboard to drive improved performance. It involves details such as overall responses on monthly basis, employee satisfaction rate, net promoter score and major training courses. Showcasing this set of slides titled Training Program KPI Dashboard Key Tactics To Drive Improved High Performance Download PDF. The topics addressed in these templates are Total Responses, Major Training Courses, Employee Satisfaction. All the content presented in this PPT design is completely editable. Download it and make adjustments in color, background, font etc. as per your unique business setting.
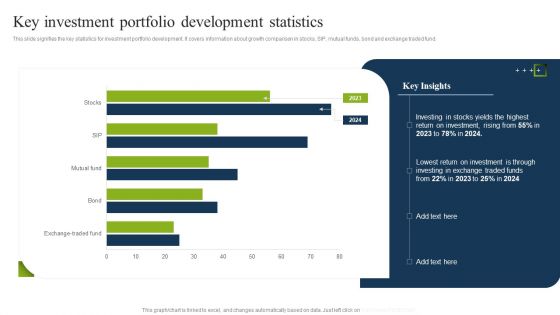
Key Investment Portfolio Development Statistics Ppt PowerPoint Presentation File Elements PDF
This slide signifies the key statistics for investment portfolio development. It covers information about growth comparison in stocks, SIP, mutual funds, bond and exchange traded fund. Showcasing this set of slides titled Key Investment Portfolio Development Statistics Ppt PowerPoint Presentation File Elements PDF. The topics addressed in these templates are Stocks Yields, Return On Investment, Lowest Return. All the content presented in this PPT design is completely editable. Download it and make adjustments in color, background, font etc. as per your unique business setting.
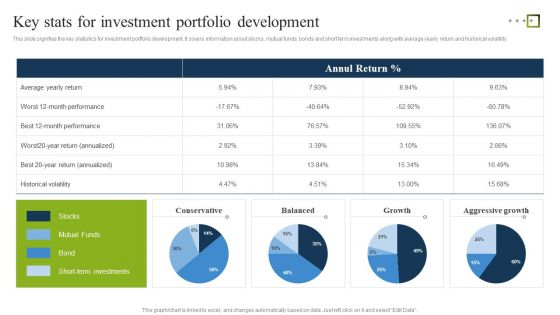
Key Stats For Investment Portfolio Development Ppt PowerPoint Presentation Gallery Good PDF
This slide signifies the key statistics for investment portfolio development. It covers information about stocks, mutual funds, bonds and short term investments along with average yearly return and historical volatility. Showcasing this set of slides titled Key Stats For Investment Portfolio Development Ppt PowerPoint Presentation Gallery Good PDF. The topics addressed in these templates are Average Yearly Return, Historical Volatility, Conservative. All the content presented in this PPT design is completely editable. Download it and make adjustments in color, background, font etc. as per your unique business setting.
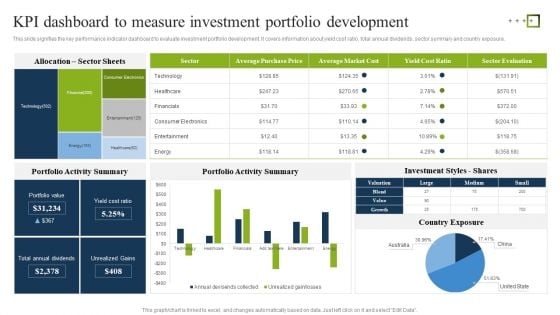
KPI Dashboard To Measure Investment Portfolio Development Ppt Inspiration Gallery PDF
This slide signifies the key performance indicator dashboard to evaluate investment portfolio development. It covers information about yield cost ratio, total annual dividends, sector summary and country exposure. Showcasing this set of slides titled KPI Dashboard To Measure Investment Portfolio Development Ppt Inspiration Gallery PDF. The topics addressed in these templates are Portfolio Activity Summary, Investment Styles Shares, Country Exposure. All the content presented in this PPT design is completely editable. Download it and make adjustments in color, background, font etc. as per your unique business setting.
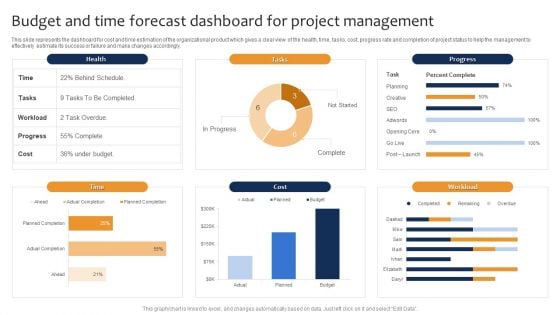
Budget And Time Forecast Dashboard For Project Management Ppt Pictures Format Ideas PDF
This slide represents the dashboard for cost and time estimation of the organizational product which gives a clear view of the health, time, tasks, cost, progress rate and completion of project status to help the management to effectively estimate its success or failure and make changes accordingly. Pitch your topic with ease and precision using this Budget And Time Forecast Dashboard For Project Management Ppt Pictures Format Ideas PDF. This layout presents information on Health, Progress, Cost, Workload. It is also available for immediate download and adjustment. So, changes can be made in the color, design, graphics or any other component to create a unique layout.
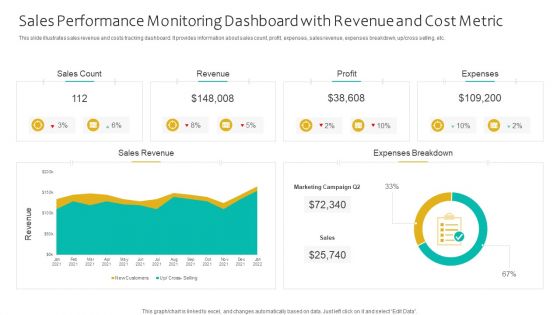
Sales Performance Monitoring Dashboard With Revenue And Cost Metric Ppt Portfolio Good PDF
This slide illustrates sales revenue and costs tracking dashboard. It provides information about sales count, profit, expenses, sales revenue, expenses breakdown, up or cross selling, etc. Showcasing this set of slides titled Sales Performance Monitoring Dashboard With Revenue And Cost Metric Ppt Portfolio Good PDF. The topics addressed in these templates are Sales Count, Revenue, Profit, Expenses. All the content presented in this PPT design is completely editable. Download it and make adjustments in color, background, font etc. as per your unique business setting.
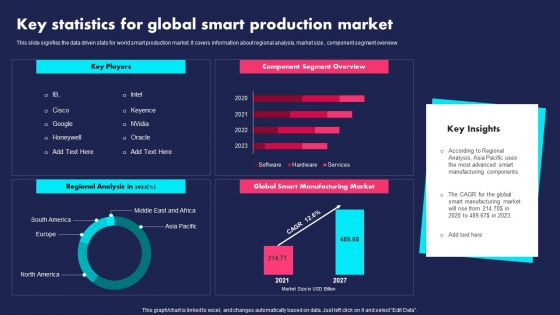
Key Statistics For Global Smart Production Market Ppt PowerPoint Presentation File Slides PDF
This slide signifies the data driven stats for world smart production market. It covers information about regional analysis, market size, component segment overview. Pitch your topic with ease and precision using this Key Statistics For Global Smart Production Market Ppt PowerPoint Presentation File Slides PDF. This layout presents information on Key Players, Component Segment Overview, Regional Analysis. It is also available for immediate download and adjustment. So, changes can be made in the color, design, graphics or any other component to create a unique layout.
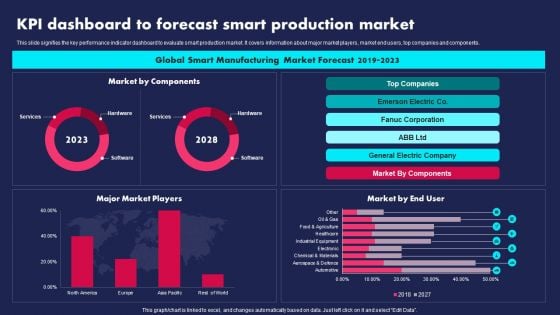
KPI Dashboard To Forecast Smart Production Market Ppt PowerPoint Presentation Gallery Visual Aids PDF
This slide signifies the key performance indicator dashboard to evaluate smart production market. It covers information about major market players, market end users, top companies and components. Pitch your topic with ease and precision using this KPI Dashboard To Forecast Smart Production Market Ppt PowerPoint Presentation Gallery Visual Aids PDF. This layout presents information on Global Smart Manufacturing, Market Forecast, 2019 To 2023. It is also available for immediate download and adjustment. So, changes can be made in the color, design, graphics or any other component to create a unique layout.
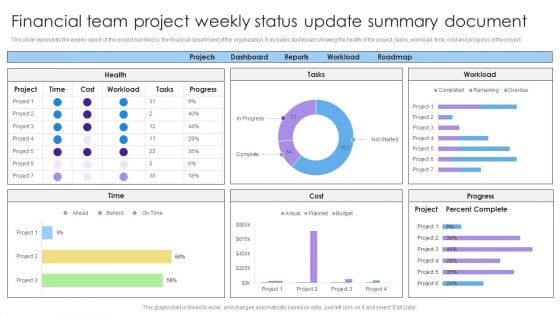
Financial Team Project Weekly Status Update Summary Document Background PDF
This slide represents the weekly report of the project handled by the financial department of the organization. It includes dashboard showing the health of the project, tasks, workload, time, cost and progress of the project. Showcasing this set of slides titled Financial Team Project Weekly Status Update Summary Document Background PDF. The topics addressed in these templates are Projects, Dashboard, Reports, Workload, Roadmap. All the content presented in this PPT design is completely editable. Download it and make adjustments in color, background, font etc. as per your unique business setting.
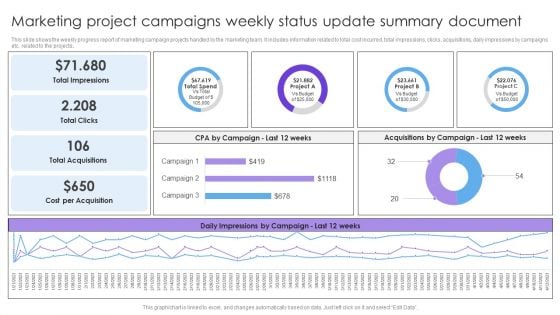
Marketing Project Campaigns Weekly Status Update Summary Document Formats PDF
This slide shows the weekly progress report of marketing campaign projects handled by the marketing team. It includes information related to total cost incurred, total impressions, clicks, acquisitions, daily impressions by campaigns etc. related to the projects. Pitch your topic with ease and precision using this Marketing Project Campaigns Weekly Status Update Summary Document Formats PDF. This layout presents information on Total Impressions, Total Clicks, Total Acquisitions. It is also available for immediate download and adjustment. So, changes can be made in the color, design, graphics or any other component to create a unique layout.
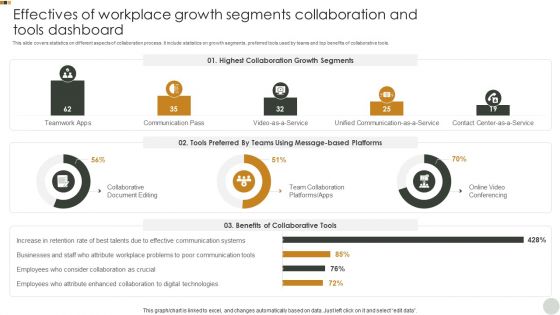
Effectives Of Workplace Growth Segments Collaboration And Tools Dashboard Graphics PDF
This slide covers statistics on different aspects of collaboration process. It include statistics on growth segments, preferred tools used by teams and top benefits of collaborative tools. Pitch your topic with ease and precision using this Effectives Of Workplace Growth Segments Collaboration And Tools Dashboard Graphics PDF. This layout presents information on Highest Collaboration, Growth Segments, Tools Preferred. It is also available for immediate download and adjustment. So, changes can be made in the color, design, graphics or any other component to create a unique layout.
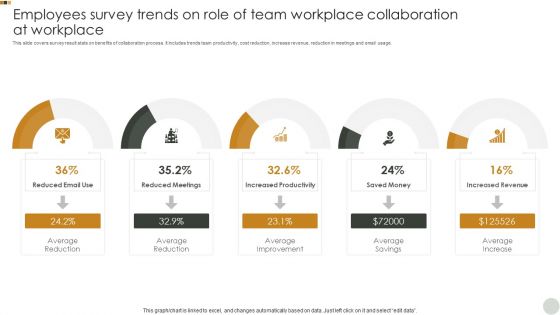
Employees Survey Trends On Role Of Team Workplace Collaboration At Workplace Introduction PDF
This slide covers survey result stats on benefits of collaboration process. It includes trends team productivity, cost reduction, increase revenue, reduction in meetings and email usage. Showcasing this set of slides titled Employees Survey Trends On Role Of Team Workplace Collaboration At Workplace Introduction PDF. The topics addressed in these templates are Average Reduction, Average Improvement, Average Savings. All the content presented in this PPT design is completely editable. Download it and make adjustments in color, background, font etc. as per your unique business setting.
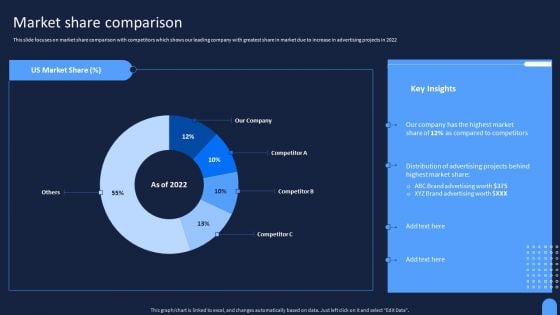
Ad And Media Agency Company Profile Market Share Comparison Infographics PDF
This slide focuses on market share comparison with competitors which shows our leading company with greatest share in market due to increase in advertising projects in 2022. If your project calls for a presentation, then Slidegeeks is your go-to partner because we have professionally designed, easy-to-edit templates that are perfect for any presentation. After downloading, you can easily edit Ad And Media Agency Company Profile Market Share Comparison Infographics PDF and make the changes accordingly. You can rearrange slides or fill them with different images. Check out all the handy templates.
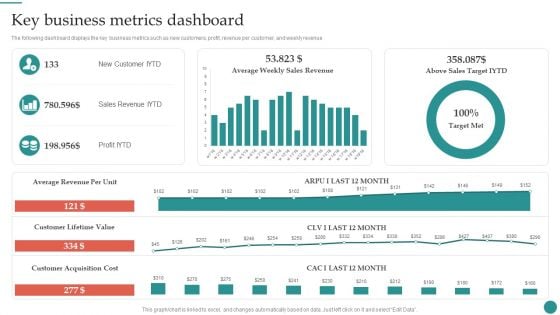
Key Business Metrics Dashboard Company Process Administration And Optimization Playbook Infographics PDF
The following dashboard displays the key business metrics such as new customers, profit, revenue per customer, and weekly revenue. Slidegeeks is here to make your presentations a breeze with Key Business Metrics Dashboard Company Process Administration And Optimization Playbook Infographics PDF With our easy-to-use and customizable templates, you can focus on delivering your ideas rather than worrying about formatting. With a variety of designs to choose from, you are sure to find one that suits your needs. And with animations and unique photos, illustrations, and fonts, you can make your presentation pop. So whether you are giving a sales pitch or presenting to the board, make sure to check out Slidegeeks first.
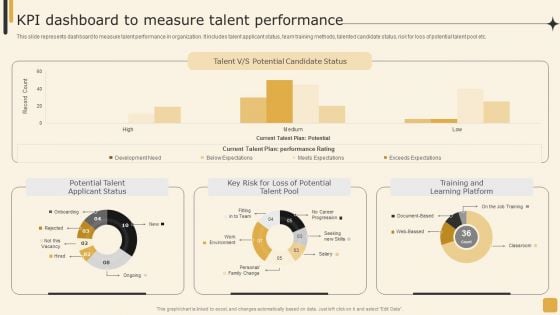
Kpi Dashboard To Measure Talent Performance Employee Performance Management Tactics Professional PDF
This slide represents dashboard to measure talent performance in organization. It includes talent applicant status, team training methods, talented candidate status, risk for loss of potential talent pool etc.The Kpi Dashboard To Measure Talent Performance Employee Performance Management Tactics Professional PDF is a compilation of the most recent design trends as a series of slides. It is suitable for any subject or industry presentation, containing attractive visuals and photo spots for businesses to clearly express their messages. This template contains a variety of slides for the user to input data, such as structures to contrast two elements, bullet points, and slides for written information. Slidegeeks is prepared to create an impression.
Cios Guide To Optimize Determine IT Project Portfolio Management Tracking Formats PDF
This slide provides information regarding IT project portfolio management tracking dashboard including details about allocated budget across portfolios, used budget percentage, estimated vs. actual cost, etc. If your project calls for a presentation, then Slidegeeks is your go-to partner because we have professionally designed, easy-to-edit templates that are perfect for any presentation. After downloading, you can easily edit Cios Guide To Optimize Determine IT Project Portfolio Management Tracking Formats PDF and make the changes accordingly. You can rearrange slides or fill them with different images. Check out all the handy templates.


 Continue with Email

 Home
Home


