Availability Icon
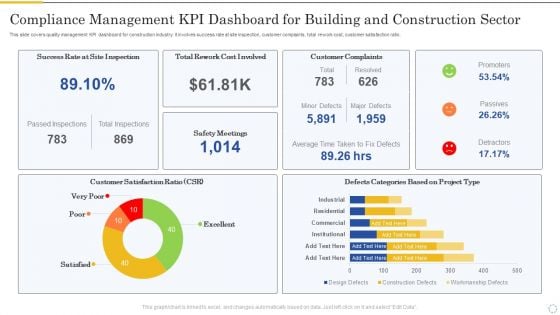
Compliance Management Kpi Dashboard For Building And Construction Sector Inspiration PDF
This slide covers quality management KPI dashboard for construction industry. It involves success rate at site inspection, customer complaints, total rework cost, customer satisfaction ratio. Pitch your topic with ease and precision using this Compliance Management Kpi Dashboard For Building And Construction Sector Inspiration PDF. This layout presents information on Customer Complaints, Customer Satisfaction, Safety Meetings. It is also available for immediate download and adjustment. So, changes can be made in the color, design, graphics or any other component to create a unique layout.
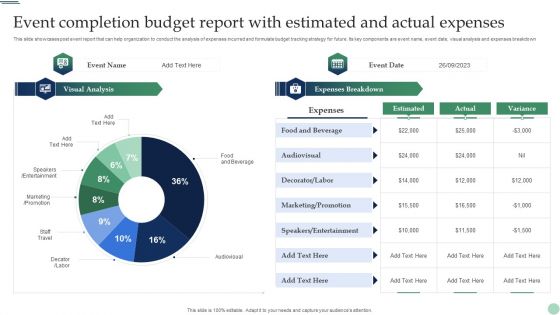
Event Completion Budget Report With Estimated And Actual Expenses Pictures PDF
This slide showcases post event report that can help organization to conduct the analysis of expenses incurred and formulate budget tracking strategy for future. Its key components are event name, event date, visual analysis and expenses breakdown. Pitch your topic with ease and precision using this Event Completion Budget Report With Estimated And Actual Expenses Pictures PDF. This layout presents information on Food And Beverage, Audiovisual, Marketing, Entertainment. It is also available for immediate download and adjustment. So, changes can be made in the color, design, graphics or any other component to create a unique layout.
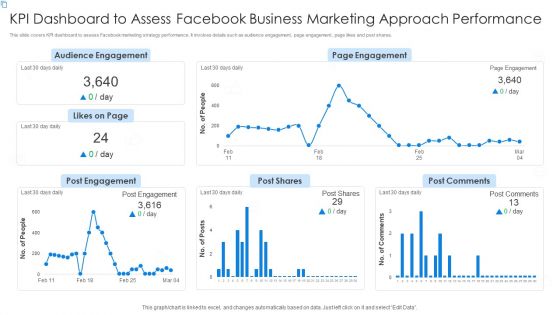
KPI Dashboard To Assess Facebook Business Marketing Approach Performance Portrait PDF
This slide covers KPI dashboard to assess Facebook marketing strategy performance. It involves details such as audience engagement, page engagement, page likes and post shares. Pitch your topic with ease and precision using this KPI Dashboard To Assess Facebook Business Marketing Approach Performance Portrait PDF. This layout presents information on Audience Engagement, Page Engagement, Post Comments. It is also available for immediate download and adjustment. So, changes can be made in the color, design, graphics or any other component to create a unique layout.
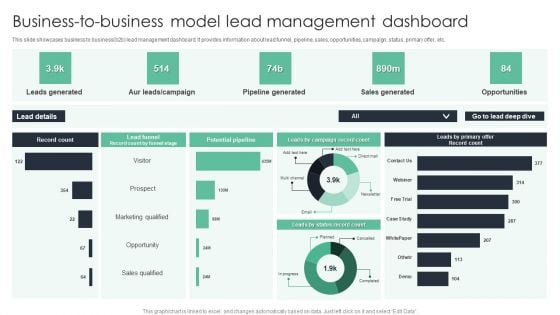
Business To Business Model Lead Management Dashboard Ppt Portfolio Backgrounds PDF
This slide showcases business to business b2b lead management dashboard. It provides information about lead funnel, pipeline, sales, opportunities, campaign, status, primary offer, etc. Pitch your topic with ease and precision using this Business To Business Model Lead Management Dashboard Ppt Portfolio Backgrounds PDF. This layout presents information on Leads Generated, Pipeline Generated, Sales Generated, Opportunities. It is also available for immediate download and adjustment. So, changes can be made in the color, design, graphics or any other component to create a unique layout.
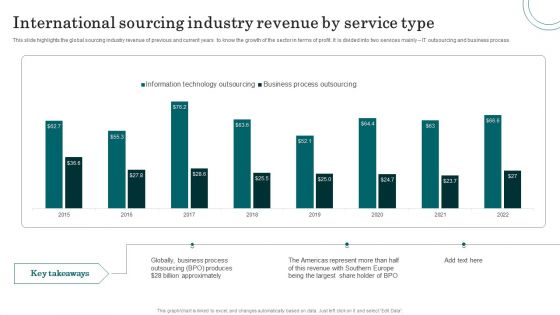
International Sourcing Industry Revenue By Service Type Mockup PDF
This slide highlights the global sourcing industry revenue of previous and current years to know the growth of the sector in terms of profit. It is divided into two services mainly IT outsourcing and business process. Pitch your topic with ease and precision using this International Sourcing Industry Revenue By Service Type Mockup PDF. This layout presents information on Business Process, Revenue, Share Holder. It is also available for immediate download and adjustment. So, changes can be made in the color, design, graphics or any other component to create a unique layout.
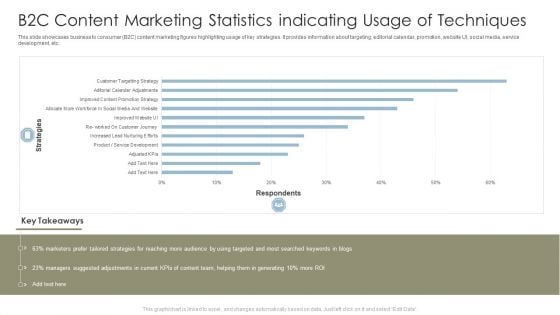
B2C Content Marketing Statistics Indicating Usage Of Techniques Sample PDF
This slide showcases business to consumer B2C content marketing figures highlighting usage of key strategies. It provides information about targeting, editorial calendar, promotion, website UI, social media, service development, etc. Pitch your topic with ease and precision using this B2C Content Marketing Statistics Indicating Usage Of Techniques Sample PDF. This layout presents information on Strategies, Marketers, Content Team. It is also available for immediate download and adjustment. So, changes can be made in the color, design, graphics or any other component to create a unique layout.
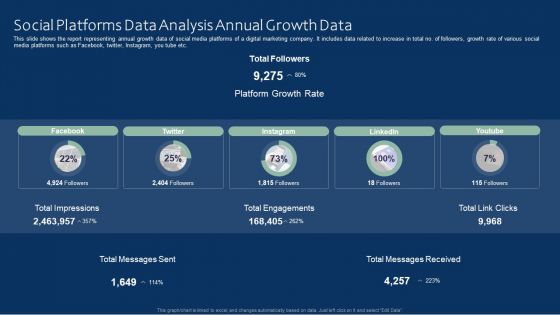
Social Platforms Data Analysis Annual Growth Data Ideas PDF
This slide shows the report representing annual growth data of social media platforms of a digital marketing company. It includes data related to increase in total no. of followers, growth rate of various social media platforms such as Facebook, twitter, Instagram, you tube etc. Pitch your topic with ease and precision using this Social Platforms Data Analysis Annual Growth Data Ideas PDF. This layout presents information on Social Platforms Data Analysis, Annual Growth Data. It is also available for immediate download and adjustment. So, changes can be made in the color, design, graphics or any other component to create a unique layout.
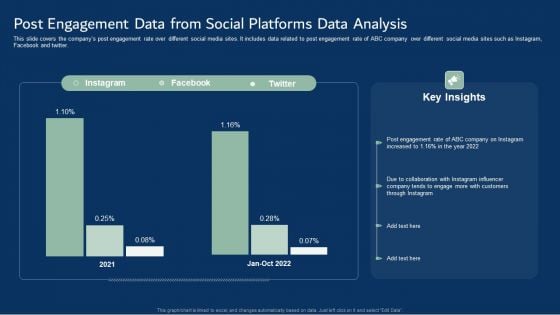
Post Engagement Data From Social Platforms Data Analysis Template PDF
This slide covers the companys post engagement rate over different social media sites. It includes data related to post engagement rate of ABC company over different social media sites such as Instagram, Facebook and twitter. Pitch your topic with ease and precision using this Post Engagement Data From Social Platforms Data Analysis Template PDF. This layout presents information on Post Engagement Data, Social Platforms Data Analysis. It is also available for immediate download and adjustment. So, changes can be made in the color, design, graphics or any other component to create a unique layout.
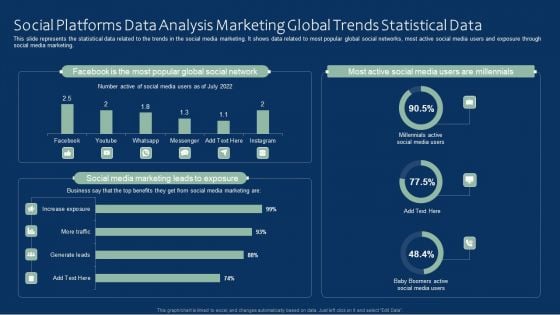
Social Platforms Data Analysis Marketing Global Trends Statistical Data Rules PDF
This slide represents the statistical data related to the trends in the social media marketing. It shows data related to most popular global social networks, most active social media users and exposure through social media marketing. Pitch your topic with ease and precision using this Social Platforms Data Analysis Marketing Global Trends Statistical Data Rules PDF. This layout presents information on Social Platforms Data Analysis, Marketing Global, Trends Statistical Data. It is also available for immediate download and adjustment. So, changes can be made in the color, design, graphics or any other component to create a unique layout.
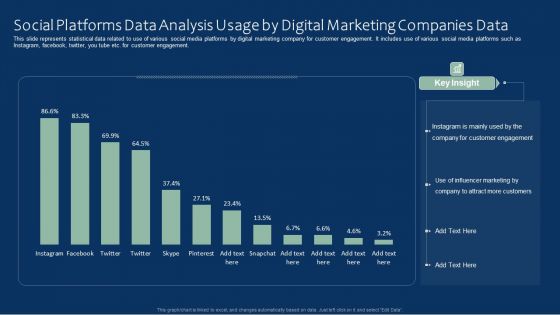
Social Platforms Data Analysis Usage By Digital Marketing Companies Data Clipart PDF
This slide represents statistical data related to use of various social media platforms by digital marketing company for customer engagement. It includes use of various social media platforms such as Instagram, facebook, twitter, you tube etc. for customer engagement. Pitch your topic with ease and precision using this Social Platforms Data Analysis Usage By Digital Marketing Companies Data Clipart PDF. This layout presents information on Social Platforms Data Analysis, Digital Marketing Companies Data. It is also available for immediate download and adjustment. So, changes can be made in the color, design, graphics or any other component to create a unique layout.
Tracking Goals Alignment KPI Dashboard Guidelines PDF
This slide showcases a tracking dashboard for determining the alignment and progress percentage of the assigned objectives. It also includes the objective evaluation KPIs such as active objectives, overall progress, total employees, objective as per employees, aligned, organizational and departmental objectives. Pitch your topic with ease and precision using this Tracking Goals Alignment KPI Dashboard Guidelines PDF. This layout presents information on Employee, Organizational Objectives, Departmental Objectives. It is also available for immediate download and adjustment. So, changes can be made in the color, design, graphics or any other component to create a unique layout.
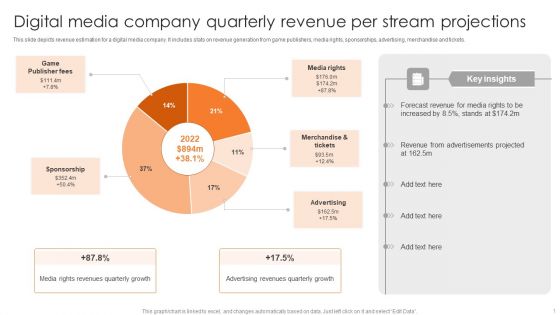
Digital Media Company Quarterly Revenue Per Stream Projections Elements PDF
This slide depicts revenue estimation for a digital media company. It includes stats on revenue generation from game publishers, media rights, sponsorships, advertising, merchandise and tickets. Pitch your topic with ease and precision using this Digital Media Company Quarterly Revenue Per Stream Projections Elements PDF. This layout presents information on Game Publisher Fees, Media Rights, Merchandise And Tickets. It is also available for immediate download and adjustment. So, changes can be made in the color, design, graphics or any other component to create a unique layout.
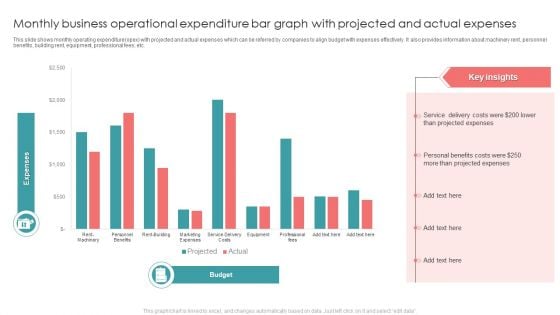
Monthly Business Operational Expenditure Bar Graph With Projected And Actual Expenses Introduction PDF
This slide shows monthly operating expenditure opex with projected and actual expenses which can be referred by companies to align budget with expenses effectively. It also provides information about machinery rent, personnel benefits, building rent, equipment, professional fees, etc. Pitch your topic with ease and precision using this Monthly Business Operational Expenditure Bar Graph With Projected And Actual Expenses Introduction PDF. This layout presents information on Projected Expenses, Costs, Service. It is also available for immediate download and adjustment. So, changes can be made in the color, design, graphics or any other component to create a unique layout.
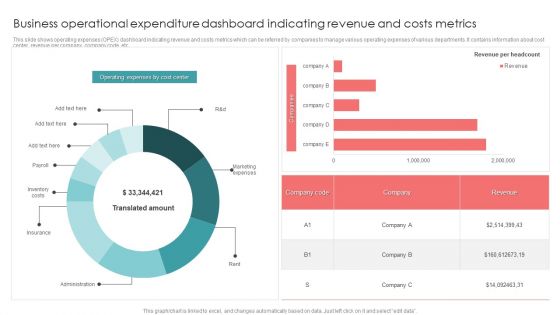
Business Operational Expenditure Dashboard Indicating Revenue And Costs Metrics Pictures PDF
This slide shows operating expenses OPEX dashboard indicating revenue and costs metrics which can be referred by companies to manage various operating expenses of various departments. It contains information about cost center, revenue per company, company code, etc. Pitch your topic with ease and precision using this Business Operational Expenditure Dashboard Indicating Revenue And Costs Metrics Pictures PDF. This layout presents information on Business Operational, Costs Metrics, Revenue. It is also available for immediate download and adjustment. So, changes can be made in the color, design, graphics or any other component to create a unique layout.

Business Revenue Bar Graph With Business Operational Expenditure Details Summary PDF
This slide represents business revenue bar graph with OPEX details which can be referred by companies to earn more revenue by controlling expenditures. It also provides information about marketing and sales, research and development, administration, total revenue, etc. Pitch your topic with ease and precision using this Business Revenue Bar Graph With Business Operational Expenditure Details Summary PDF. This layout presents information on Cost Of Marketing, Sales, Highest Amount. It is also available for immediate download and adjustment. So, changes can be made in the color, design, graphics or any other component to create a unique layout.
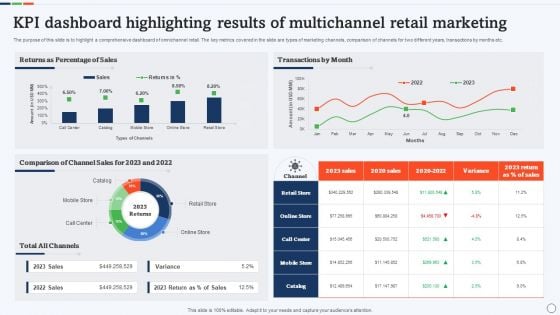
KPI Dashboard Highlighting Results Of Multichannel Retail Marketing Rules PDF
The purpose of this slide is to highlight a comprehensive dashboard of omnichannel retail. The key metrics covered in the slide are types of marketing channels, comparison of channels for two different years, transactions by months etc. Pitch your topic with ease and precision using this KPI Dashboard Highlighting Results Of Multichannel Retail Marketing Rules PDF. This layout presents information on Comparison Of Channel Sales, Percentage Of Sales, Transactions By Month. It is also available for immediate download and adjustment. So, changes can be made in the color, design, graphics or any other component to create a unique layout.
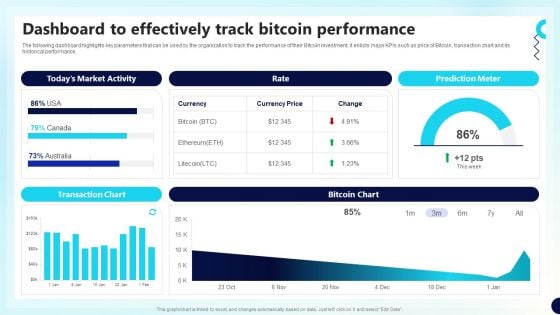
Dashboard To Effectively Track Bitcoin Decentralized Fund Investment Playbook Designs PDF
This Dashboard To Effectively Track Bitcoin Decentralized Fund Investment Playbook Designs PDF from Slidegeeks makes it easy to present information on your topic with precision. It provides customization options, so you can make changes to the colors, design, graphics, or any other component to create a unique layout. It is also available for immediate download, so you can begin using it right away. Slidegeeks has done good research to ensure that you have everything you need to make your presentation stand out. Make a name out there for a brilliant performance.
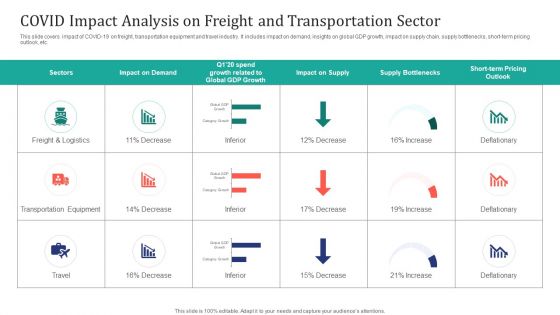
COVID Impact Analysis On Freight And Transportation Sector Ppt Outline Graphics Tutorials PDF
This slide covers impact of COVID-19 on freight, transportation equipment and travel industry. It includes impact on demand, insights on global GDP growth, impact on supply chain, supply bottlenecks, short-term pricing outlook, etc. Pitch your topic with ease and precision using this COVID Impact Analysis On Freight And Transportation Sector Ppt Outline Graphics Tutorials PDF. This layout presents information on Freight And Logistics, Transportation Equipment, Deflationary. It is also available for immediate download and adjustment. So, changes can be made in the color, design, graphics or any other component to create a unique layout.
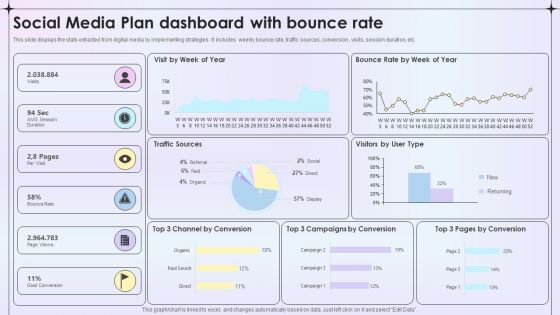
Social Media Plan Dashboard With Bounce Rate Ppt Ideas Graphics Template PDF
This slide displays the stats extracted from digital media by implementing strategies . It includes weekly bounce rate, traffic sources, conversion , visits, session duration, etc. Pitch your topic with ease and precision using this Social Media Plan Dashboard With Bounce Rate Ppt Ideas Graphics Template PDF. This layout presents information on Traffic Sources, Visitors User Type, Goal Conversion. It is also available for immediate download and adjustment. So, changes can be made in the color, design, graphics or any other component to create a unique layout.
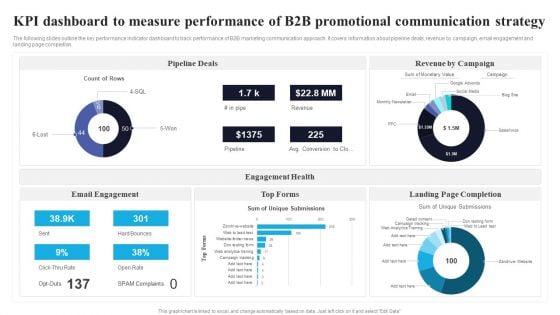
KPI Dashboard To Measure Performance Of B2B Promotional Communication Strategy Mockup PDF
The following slides outline the key performance indicator dashboard to track performance of B2B marketing communication approach. It covers information about pipeline deals, revenue by campaign, email engagement and landing page completion. Pitch your topic with ease and precision using this KPI Dashboard To Measure Performance Of B2B Promotional Communication Strategy Mockup PDF. This layout presents information on Pipeline Deals, Engagement Health, Email Engagement. It is also available for immediate download and adjustment. So, changes can be made in the color, design, graphics or any other component to create a unique layout.
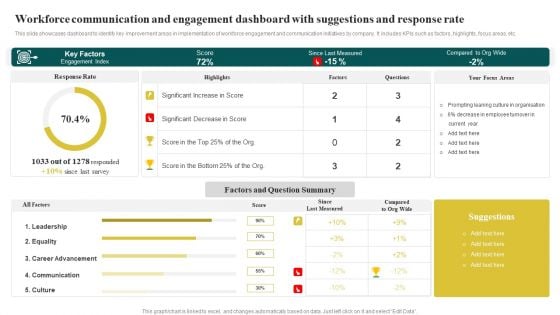
Workforce Communication And Engagement Dashboard With Suggestions And Response Rate Microsoft PDF
This slide showcases dashboard to identify key improvement areas in implementation of workforce engagement and communication initiatives by company. It includes KPIs such as factors, highlights, focus areas, etc. Pitch your topic with ease and precision using this Workforce Communication And Engagement Dashboard With Suggestions And Response Rate Microsoft PDF. This layout presents information on Key Factors, Since Last Measured, Factors And Que. It is also available for immediate download and adjustment. So, changes can be made in the color, design, graphics or any other component to create a unique layout.
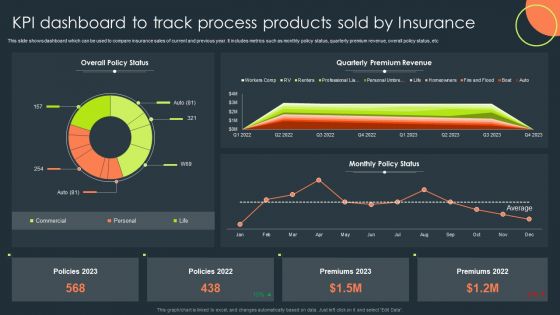
KPI Dashboard To Track Process Products Sold By Insurance Topics PDF
This slide shows dashboard which can be used to compare insurance sales of current and previous year. It includes metrics such as monthly policy status, quarterly premium revenue, overall policy status, etc. Pitch your topic with ease and precision using this KPI Dashboard To Track Process Products Sold By Insurance Topics PDF. This layout presents information on Overall Policy Status, Quarterly Premium Revenue, Monthly Policy Status. It is also available for immediate download and adjustment. So, changes can be made in the color, design, graphics or any other component to create a unique layout.
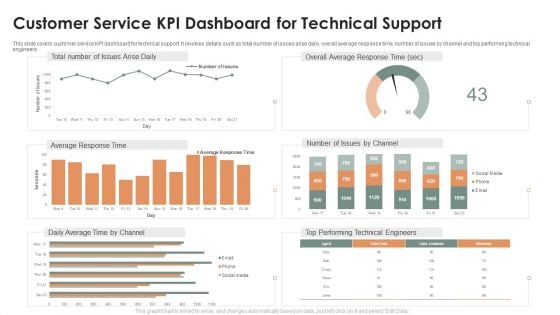
Customer Service KPI Dashboard For Technical Support Ppt Model Vector PDF
This slide covers customer service KPI dashboard for technical support. It involves details such as total number of issues arise daily, overall average response time, number of issues by channel and top performing technical engineers. Pitch your topic with ease and precision using this Customer Service KPI Dashboard For Technical Support Ppt Model Vector PDF. This layout presents information on Overall Average, Response Time, Total Number, Issues Arise Daily. It is also available for immediate download and adjustment. So, changes can be made in the color, design, graphics or any other component to create a unique layout.
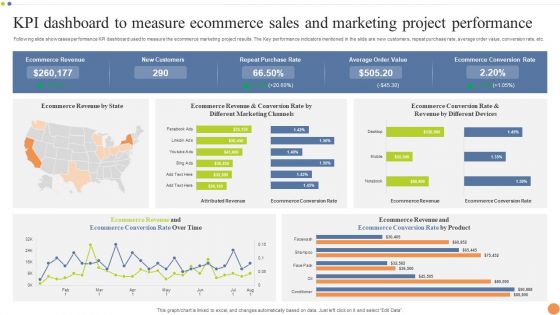
KPI Dashboard To Measure Ecommerce Sales And Marketing Project Performance Portrait PDF
Following slide showcases performance KPI dashboard used to measure the ecommerce marketing project results. The Key performance indicators mentioned in the slide are new customers, repeat purchase rate, average order value, conversion rate, etc. Pitch your topic with ease and precision using this KPI Dashboard To Measure Ecommerce Sales And Marketing Project Performance Portrait PDF. This layout presents information on Purchase Rate, Average Order Value, Ecommerce Conversion Rate. It is also available for immediate download and adjustment. So, changes can be made in the color, design, graphics or any other component to create a unique layout.
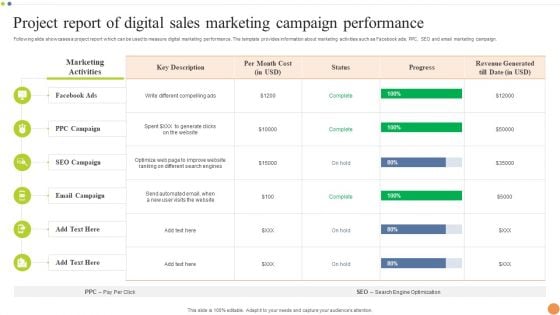
Project Report Of Digital Sales Marketing Campaign Performance Professional PDF
Following slide showcases a project report which can be used to measure digital marketing performance. The template provides information about marketing activities such as Facebook ads, PPC, SEO and email marketing campaign. Pitch your topic with ease and precision using this Project Report Of Digital Sales Marketing Campaign Performance Professional PDF. This layout presents information on Email Campaign, SEO Campaign, Marketing Activities. It is also available for immediate download and adjustment. So, changes can be made in the color, design, graphics or any other component to create a unique layout.
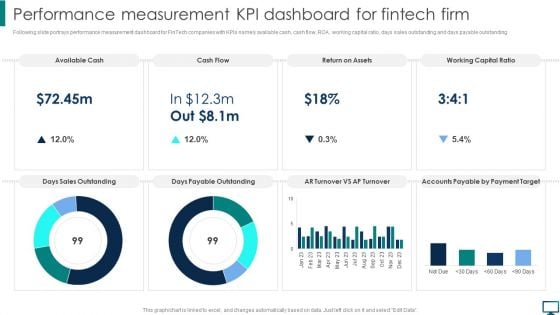
Performance Measurement KPI Dashboard For Fintech Firm Topics PDF
Following slide portrays performance measurement dashboard for FinTech companies with KPIs namely available cash, cash flow, ROA, working capital ratio, days sales outstanding and days payable outstanding. Create an editable Performance Measurement KPI Dashboard For Fintech Firm Topics PDF that communicates your idea and engages your audience. Whether you are presenting a business or an educational presentation, pre designed presentation templates help save time. Performance Measurement KPI Dashboard For Fintech Firm Topics PDF is highly customizable and very easy to edit, covering many different styles from creative to business presentations. Slidegeeks has creative team members who have crafted amazing templates. So, go and get them without any delay.
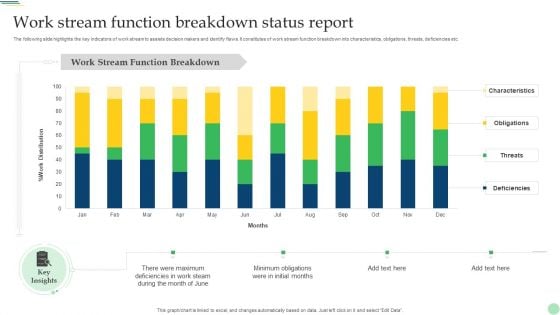
Work Stream Function Breakdown Status Report Demonstration PDF
The following slide highlights the key indicators of work stream to assists decision makers and identify flaws. It constitutes of work stream function breakdown into characteristics, obligations, threats, deficiencies etc. Pitch your topic with ease and precision using this Work Stream Function Breakdown Status Report Demonstration PDF. This layout presents information on Characteristics, Obligations, Threats, Deficiencies. It is also available for immediate download and adjustment. So, changes can be made in the color, design, graphics or any other component to create a unique layout.
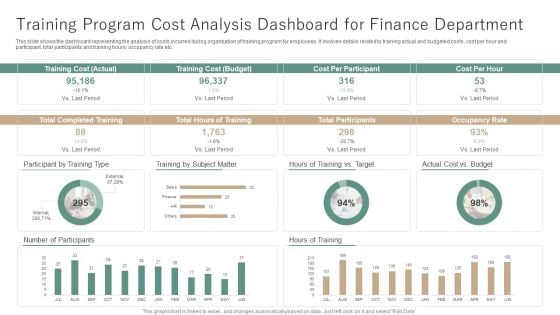
Training Program Cost Analysis Dashboard For Finance Department Ppt Example PDF
This slide shows the dashboard representing the analysis of costs incurred during organization of training program for employees. It involves details related to training actual and budgeted costs, cost per hour and participant, total participants and training hours, occupancy rate etc. Pitch your topic with ease and precision using this Training Program Cost Analysis Dashboard For Finance Department Ppt Example PDF. This layout presents information on Training Cost, Number Participants, Hours Of Training. It is also available for immediate download and adjustment. So, changes can be made in the color, design, graphics or any other component to create a unique layout.
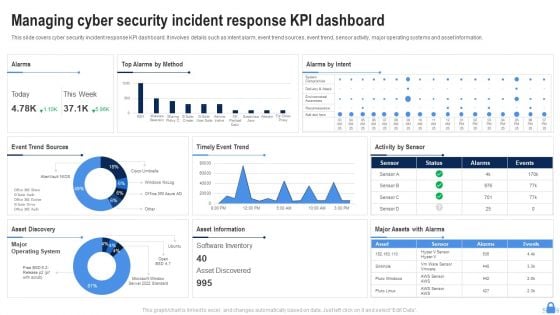
Managing Cyber Security Incident Response KPI Dashboard Ppt Layouts Shapes PDF
This slide covers cyber security incident response KPI dashboard. It involves details such as intent alarm, event trend sources, event trend, sensor activity, major operating systems and asset information. Pitch your topic with ease and precision using this Managing Cyber Security Incident Response KPI Dashboard Ppt Layouts Shapes PDF. This layout presents information on Top Alarms Method, Alarms Intent, Timely Event Trend. It is also available for immediate download and adjustment. So, changes can be made in the color, design, graphics or any other component to create a unique layout.
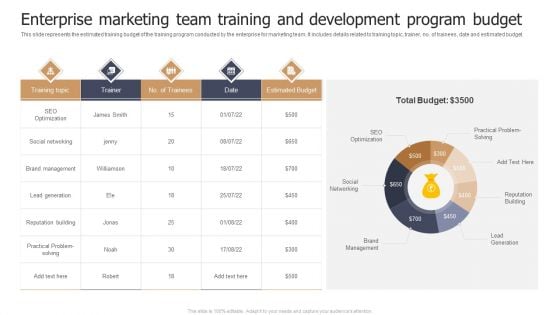
Enterprise Marketing Team Training And Development Program Budget Infographics PDF
This slide represents the estimated training budget of the training program conducted by the enterprise for marketing team. It includes details related to training topic, trainer, no. of trainees, date and estimated budget. Pitch your topic with ease and precision using this Enterprise Marketing Team Training And Development Program Budget Infographics PDF. This layout presents information on SEO Optimization, Social Networking, Brand Management. It is also available for immediate download and adjustment. So, changes can be made in the color, design, graphics or any other component to create a unique layout.
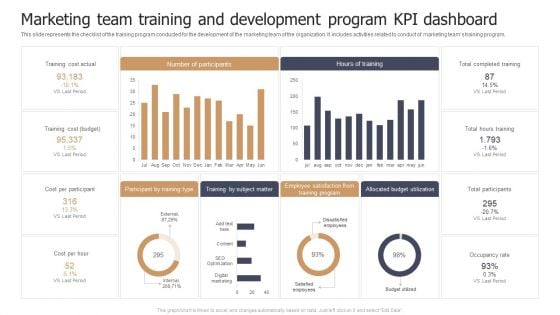
Marketing Team Training And Development Program KPI Dashboard Designs PDF
This slide represents the checklist of the training program conducted for the development of the marketing team of the organization. It includes activities related to conduct of marketing teams training program. Pitch your topic with ease and precision using this Marketing Team Training And Development Program KPI Dashboard Designs PDF. This layout presents information on Training Cost Actual, Cost Per Participant, Cost Per Hour. It is also available for immediate download and adjustment. So, changes can be made in the color, design, graphics or any other component to create a unique layout.
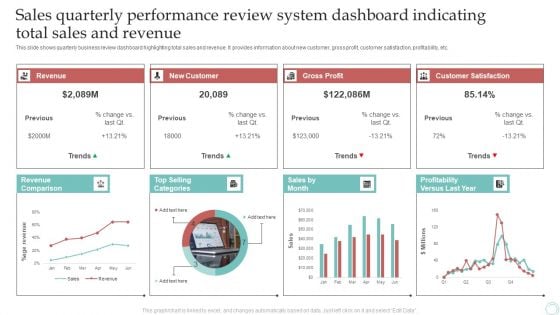
Sales Quarterly Performance Review System Dashboard Indicating Total Sales And Revenue Download PDF
This slide shows quarterly business review dashboard highlighting total sales and revenue. It provides information about new customer, gross profit, customer satisfaction, profitability, etc. Pitch your topic with ease and precision using this Sales Quarterly Performance Review System Dashboard Indicating Total Sales And Revenue Download PDF. This layout presents information on Revenue, New Customer, Gross Profit. It is also available for immediate download and adjustment. So, changes can be made in the color, design, graphics or any other component to create a unique layout.
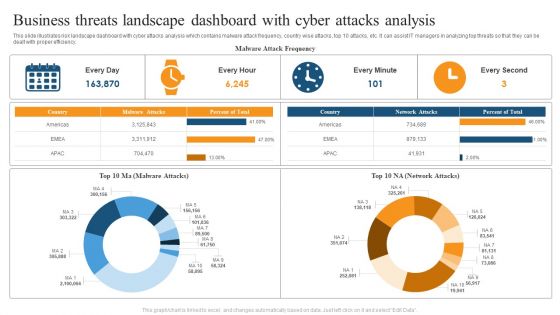
Business Threats Landscape Dashboard With Cyber Attacks Analysis Ppt Summary Brochure PDF
This slide illustrates risk landscape dashboard with cyber attacks analysis which contains malware attack frequency, country wise attacks, top 10 attacks, etc. It can assist IT managers in analyzing top threats so that they can be dealt with proper efficiency. Pitch your topic with ease and precision using this Business Threats Landscape Dashboard With Cyber Attacks Analysis Ppt Summary Brochure PDF. This layout presents information on Malware Attack Frequency, Every Minute, Every Second. It is also available for immediate download and adjustment. So, changes can be made in the color, design, graphics or any other component to create a unique layout.
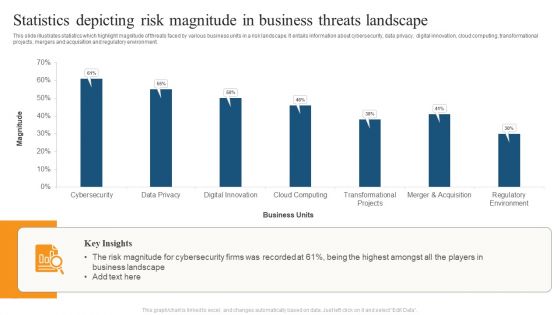
Statistics Depicting Risk Magnitude In Business Threats Landscape Ppt File Example Introduction PDF
This slide illustrates statistics which highlight magnitude of threats faced by various business units in a risk landscape. It entails information about cybersecurity, data privacy, digital innovation, cloud computing, transformational projects, mergers and acquisition and regulatory environment. Pitch your topic with ease and precision using this Statistics Depicting Risk Magnitude In Business Threats Landscape Ppt File Example Introduction PDF. This layout presents information on Business Units, Risk Magnitude, Business Landscape. It is also available for immediate download and adjustment. So, changes can be made in the color, design, graphics or any other component to create a unique layout.
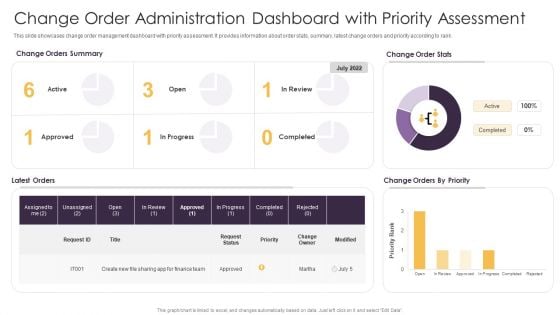
Change Order Administration Dashboard With Priority Assessment Ppt Portfolio Inspiration PDF
This slide showcases change order management dashboard with priority assessment. It provides information about order stats, summary, latest change orders and priority according to rank. Pitch your topic with ease and precision using this Change Order Administration Dashboard With Priority Assessment Ppt Portfolio Inspiration PDF. This layout presents information on Change Orders Priority, Change Order Stats, Change Orders Summary. It is also available for immediate download and adjustment. So, changes can be made in the color, design, graphics or any other component to create a unique layout.
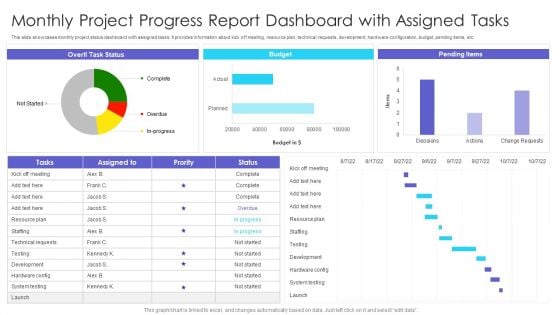
Monthly Project Progress Report Dashboard With Assigned Tasks Ppt Styles Clipart PDF
This slide showcases monthly project status dashboard with assigned tasks. It provides information about kick off meeting, resource plan, technical requests, development, hardware configuration, budget, pending items, etc. Pitch your topic with ease and precision using this Monthly Project Progress Report Dashboard With Assigned Tasks Ppt Styles Clipart PDF. This layout presents information on Pending Items, Budget, Kick Off Meeting. It is also available for immediate download and adjustment. So, changes can be made in the color, design, graphics or any other component to create a unique layout.
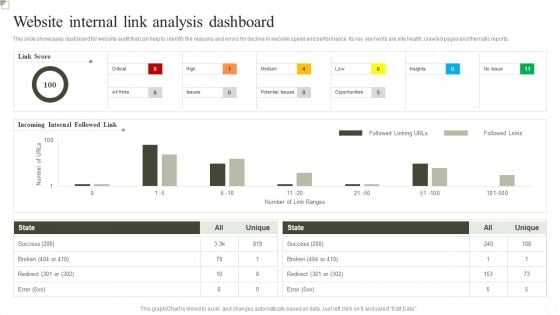
Website Internal Link Analysis Dashboard Ppt Inspiration Outline PDF
This slide showcases dashboard for website Analysis that can help to identify the reasons and errors for decline in website speed and performance. Its key elements are site health, crawled pages and thematic reports. Pitch your topic with ease and precision using this Website Internal Link Analysis Dashboard Ppt Inspiration Outline PDF. This layout presents information on Success, Incoming Internal Followed Link, Link Score. It is also available for immediate download and adjustment. So, changes can be made in the color, design, graphics or any other component to create a unique layout.
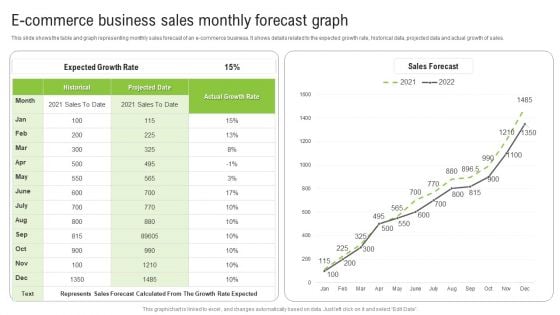
E Commerce Business Sales Monthly Forecast Graph Ppt Infographics Show PDF
This slide shows the table and graph representing monthly sales forecast of an e-commerce business. It shows details related to the expected growth rate, historical data, projected data and actual growth of sales. Pitch your topic with ease and precision using this E Commerce Business Sales Monthly Forecast Graph Ppt Infographics Show PDF. This layout presents information on Expected Growth Rate, Historical, Actual Growth Rate. It is also available for immediate download and adjustment. So, changes can be made in the color, design, graphics or any other component to create a unique layout.
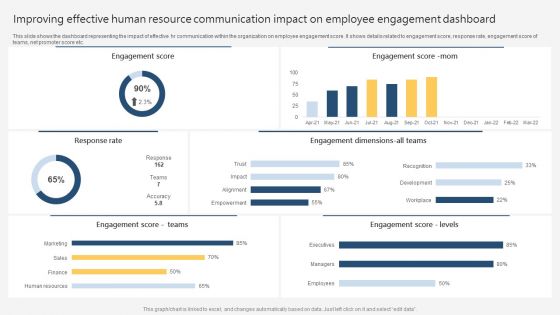
Improving Effective Human Resource Communication Impact On Employee Engagement Dashboard Slides PDF
This slide shows the dashboard representing the impact of effective hr communication within the organization on employee engagement score. It shows details related to engagement score, response rate, engagement score of teams, net promoter score etc. Pitch your topic with ease and precision using this Improving Effective Human Resource Communication Impact On Employee Engagement Dashboard Slides PDF. This layout presents information on Engagement Score, Response Rate, Engagement Score Levels. It is also available for immediate download and adjustment. So, changes can be made in the color, design, graphics or any other component to create a unique layout.
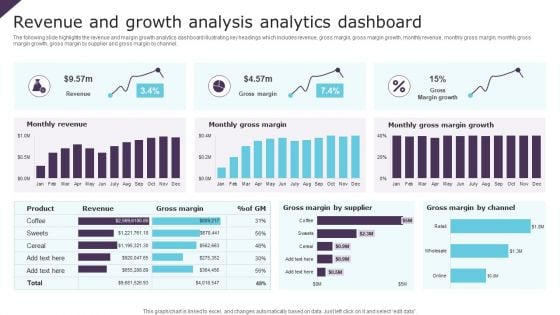
Revenue And Growth Analysis Analytics Dashboard Ppt Infographic Template Brochure PDF
The following slide highlights the revenue and margin growth analytics dashboard illustrating key headings which includes revenue, gross margin, gross margin growth, monthly revenue, monthly gross margin, monthly gross margin growth, gross margin by supplier and gross margin by channel. Pitch your topic with ease and precision using this Revenue And Growth Analysis Analytics Dashboard Ppt Infographic Template Brochure PDF. This layout presents information on Monthly Revenue, Monthly Gross Margin, Gross Margin Growth. It is also available for immediate download and adjustment. So, changes can be made in the color, design, graphics or any other component to create a unique layout.
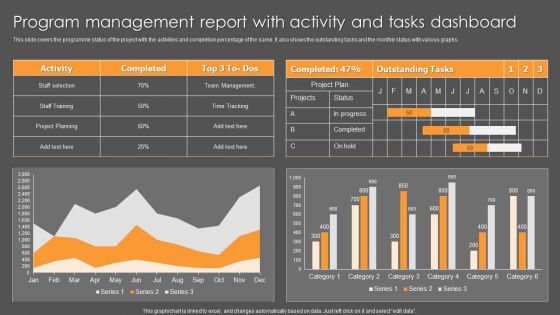
Program Management Report With Activity And Tasks Dashboard Ppt File Objects PDF
This slide covers the programme status of the project with the activities and completion percentage of the same. It also shows the outstanding tasks and the monthly status with various graphs. Pitch your topic with ease and precision using this Program Management Report With Activity And Tasks Dashboard Ppt File Objects PDF. This layout presents information on Activity, Team Management, Time Tracking. It is also available for immediate download and adjustment. So, changes can be made in the color, design, graphics or any other component to create a unique layout.
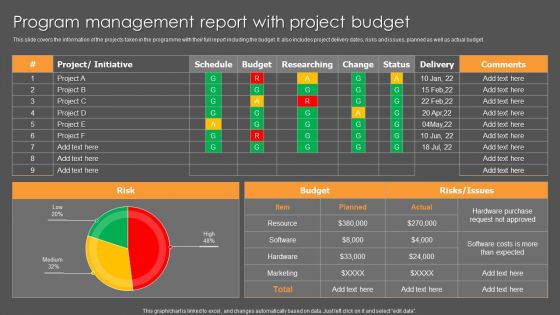
Program Management Report With Project Budget Ppt Model Designs PDF
This slide covers the information of the projects taken in the programme with their full report including the budget. It also includes project delivery dates, risks and issues, planned as well as actual budget. Pitch your topic with ease and precision using this Program Management Report With Project Budget Ppt Model Designs PDF. This layout presents information on Project, Initiative, Risk, Budget. It is also available for immediate download and adjustment. So, changes can be made in the color, design, graphics or any other component to create a unique layout.
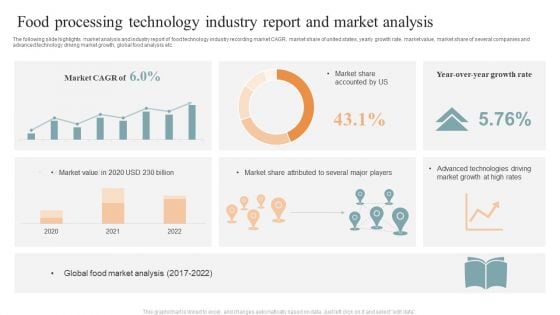
Food Processing Technology Industry Report And Market Analysis Brochure PDF
The following slide highlights market analysis and industry report of food technology industry recording market CAGR, market share of united states, yearly growth rate, market value, market share of several companies and advanced technology driving market growth, global food analysis etc. Pitch your topic with ease and precision using this Food Processing Technology Industry Report And Market Analysis Brochure PDF. This layout presents information on Market CAGR, Market Share Accounted, Global Food, Market Analysis. It is also available for immediate download and adjustment. So, changes can be made in the color, design, graphics or any other component to create a unique layout.
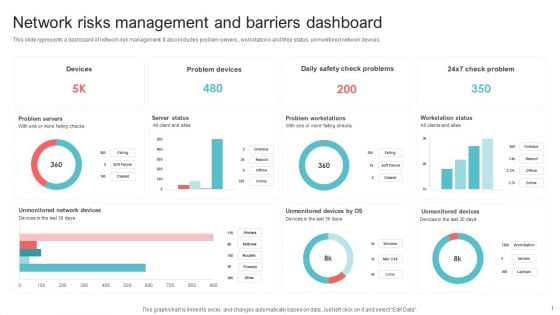
Network Risks Management And Barriers Dashboard Ppt PowerPoint Presentation Gallery Graphic Tips PDF
This slide represents a dashboard of network risk management. It also includes problem servers , workstations and their status, unmonitored network devices. Pitch your topic with ease and precision using this Network Risks Management And Barriers Dashboard Ppt PowerPoint Presentation Gallery Graphic Tips PDF. This layout presents information on Problem Servers, Server Status, Problem Workstations, Workstation Status. It is also available for immediate download and adjustment. So, changes can be made in the color, design, graphics or any other component to create a unique layout.
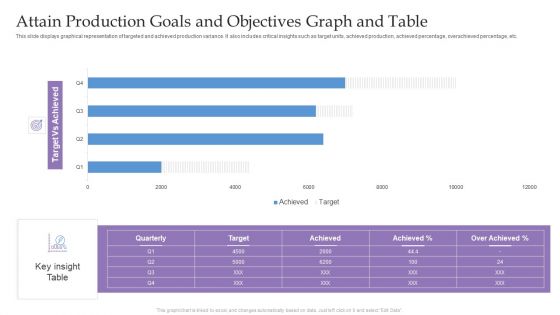
Attain Production Goals And Objectives Graph And Table Ppt Infographic Template Visuals PDF
This slide displays graphical representation of targeted and achieved production variance. It also includes critical insights such as target units, achieved production, achieved percentage, overachieved percentage, etc. Pitch your topic with ease and precision using this Attain Production Goals And Objectives Graph And Table Ppt Infographic Template Visuals PDF. This layout presents information on Target Vs Achieved, Key insight Table, Quarterly. It is also available for immediate download and adjustment. So, changes can be made in the color, design, graphics or any other component to create a unique layout.
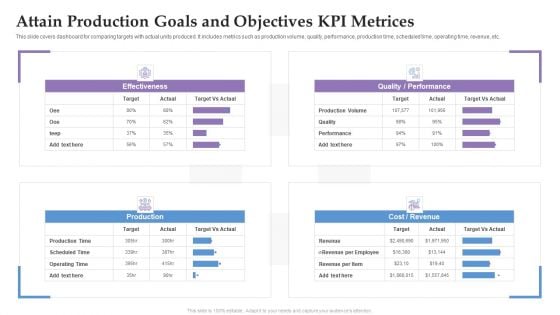
Attain Production Goals And Objectives KPI Metrices Ppt Summary Format Ideas PDF
This slide covers dashboard for comparing targets with actual units produced. It includes metrics such as production volume, quality, performance, production time, scheduled time, operating time, revenue, etc. Pitch your topic with ease and precision using this Attain Production Goals And Objectives KPI Metrices Ppt Summary Format Ideas PDF. This layout presents information on Production, Cost, Revenue, Performance. It is also available for immediate download and adjustment. So, changes can be made in the color, design, graphics or any other component to create a unique layout.
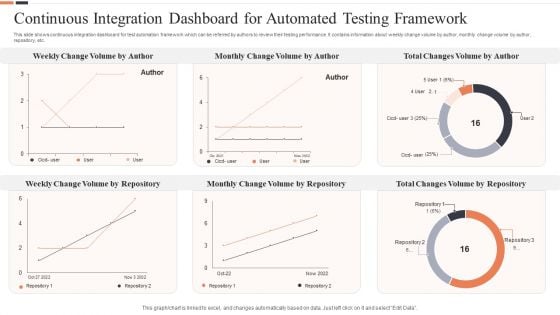
Continuous Integration Dashboard For Automated Testing Framework Ppt Layouts Layout Ideas PDF
This slide shows continuous integration dashboard for test automation framework which can be referred by authors to review their testing performance. It contains information about weekly change volume by author, monthly change volume by author, repository, etc. Pitch your topic with ease and precision using this Continuous Integration Dashboard For Automated Testing Framework Ppt Layouts Layout Ideas PDF. This layout presents information on Total Changes Volume, Monthly Change Volume, Weekly Change Volume. It is also available for immediate download and adjustment. So, changes can be made in the color, design, graphics or any other component to create a unique layout.
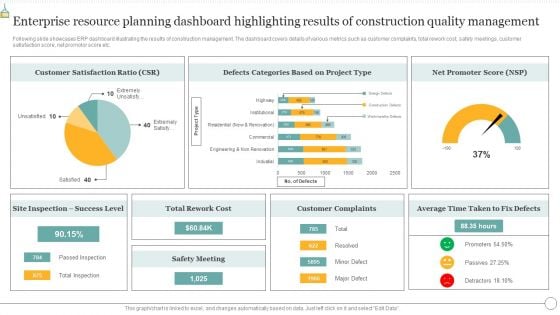
Enterprise Resource Planning Dashboard Highlighting Results Of Construction Quality Management Summary PDF
Following slide exhibits various functionalities that constructing company look for in ERP software. The multiple functionalities covered in the slide are project tracking, job costing, project estimating, improved accuracy, process automation etc. Pitch your topic with ease and precision using this Enterprise Resource Planning Dashboard Highlighting Results Of Construction Quality Management Summary PDF. This layout presents information on Technology Efficiency, Process Automation, Improved Accuracy. It is also available for immediate download and adjustment. So, changes can be made in the color, design, graphics or any other component to create a unique layout.
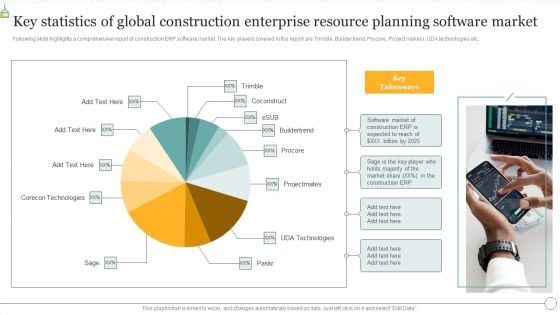
Key Statistics Of Global Construction Enterprise Resource Planning Software Market Sample PDF
Following slide highlights a comprehensive report of construction ERP software market. The key players covered in the report are Trimble, Builder trend, Procore, Project makers, UDA technologies etc. Pitch your topic with ease and precision using this Key Statistics Of Global Construction Enterprise Resource Planning Software Market Sample PDF. This layout presents information on Key Statistics, Global Construction Enterprise, Resource Planning Software Market. It is also available for immediate download and adjustment. So, changes can be made in the color, design, graphics or any other component to create a unique layout.
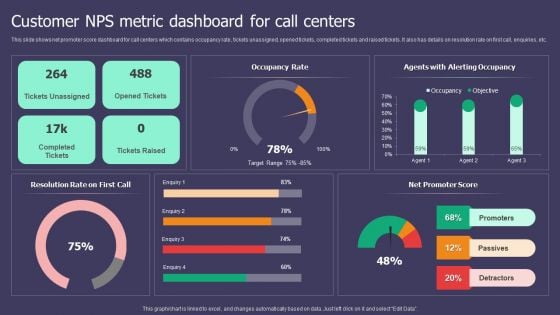
Customer NPS Metric Dashboard For Call Centers Ppt Inspiration Smartart PDF
This slide shows net promoter score dashboard for call centers which contains occupancy rate, tickets unassigned, opened tickets, completed tickets and raised tickets. It also has details on resolution rate on first call, enquiries, etc. Pitch your topic with ease and precision using this Customer NPS Metric Dashboard For Call Centers Ppt Inspiration Smartart PDF. This layout presents information on Occupancy Rate, Resolution Rate, Net Promoter Score. It is also available for immediate download and adjustment. So, changes can be made in the color, design, graphics or any other component to create a unique layout.
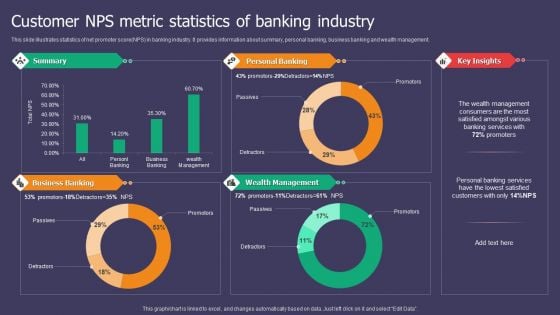
Customer NPS Metric Statistics Of Banking Industry Ppt Styles Microsoft PDF
This slide illustrates statistics of net promoter score NPS in banking industry. It provides information about summary, personal banking, business banking and wealth management. Pitch your topic with ease and precision using this Customer NPS Metric Statistics Of Banking Industry Ppt Styles Microsoft PDF. This layout presents information on Summary, Personal Banking, Business Banking, Wealth Management. It is also available for immediate download and adjustment. So, changes can be made in the color, design, graphics or any other component to create a unique layout.
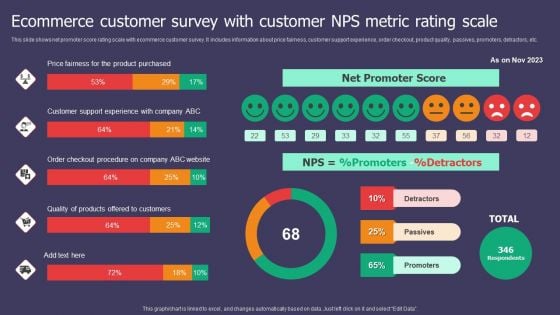
Ecommerce Customer Survey With Customer NPS Metric Rating Scale Ppt Inspiration Visual Aids PDF
This slide shows net promoter score rating scale with ecommerce customer survey. It includes information about price fairness, customer support experience, order checkout, product quality, passives, promoters, detractors, etc. Pitch your topic with ease and precision using this Ecommerce Customer Survey With Customer NPS Metric Rating Scale Ppt Inspiration Visual Aids PDF. This layout presents information on Net Promoter Score, Price Fairness, Product Purchased. It is also available for immediate download and adjustment. So, changes can be made in the color, design, graphics or any other component to create a unique layout.
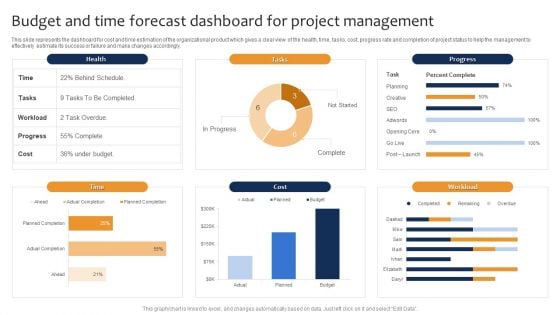
Budget And Time Forecast Dashboard For Project Management Ppt Pictures Format Ideas PDF
This slide represents the dashboard for cost and time estimation of the organizational product which gives a clear view of the health, time, tasks, cost, progress rate and completion of project status to help the management to effectively estimate its success or failure and make changes accordingly. Pitch your topic with ease and precision using this Budget And Time Forecast Dashboard For Project Management Ppt Pictures Format Ideas PDF. This layout presents information on Health, Progress, Cost, Workload. It is also available for immediate download and adjustment. So, changes can be made in the color, design, graphics or any other component to create a unique layout.
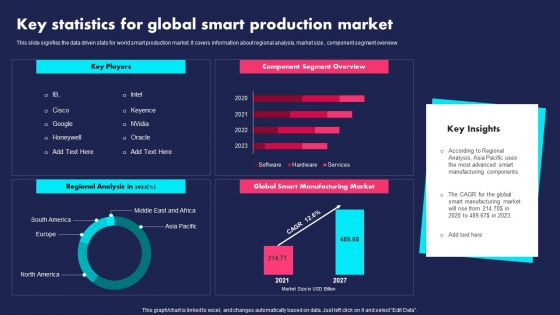
Key Statistics For Global Smart Production Market Ppt PowerPoint Presentation File Slides PDF
This slide signifies the data driven stats for world smart production market. It covers information about regional analysis, market size, component segment overview. Pitch your topic with ease and precision using this Key Statistics For Global Smart Production Market Ppt PowerPoint Presentation File Slides PDF. This layout presents information on Key Players, Component Segment Overview, Regional Analysis. It is also available for immediate download and adjustment. So, changes can be made in the color, design, graphics or any other component to create a unique layout.
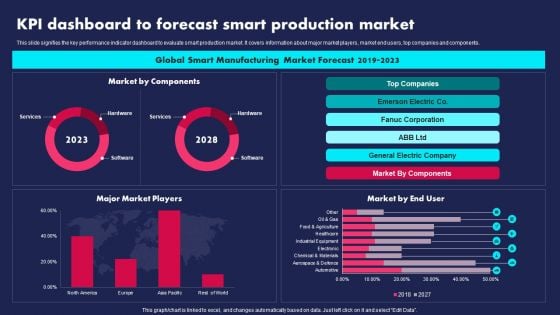
KPI Dashboard To Forecast Smart Production Market Ppt PowerPoint Presentation Gallery Visual Aids PDF
This slide signifies the key performance indicator dashboard to evaluate smart production market. It covers information about major market players, market end users, top companies and components. Pitch your topic with ease and precision using this KPI Dashboard To Forecast Smart Production Market Ppt PowerPoint Presentation Gallery Visual Aids PDF. This layout presents information on Global Smart Manufacturing, Market Forecast, 2019 To 2023. It is also available for immediate download and adjustment. So, changes can be made in the color, design, graphics or any other component to create a unique layout.
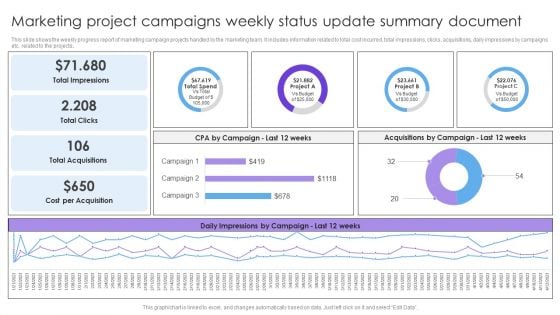
Marketing Project Campaigns Weekly Status Update Summary Document Formats PDF
This slide shows the weekly progress report of marketing campaign projects handled by the marketing team. It includes information related to total cost incurred, total impressions, clicks, acquisitions, daily impressions by campaigns etc. related to the projects. Pitch your topic with ease and precision using this Marketing Project Campaigns Weekly Status Update Summary Document Formats PDF. This layout presents information on Total Impressions, Total Clicks, Total Acquisitions. It is also available for immediate download and adjustment. So, changes can be made in the color, design, graphics or any other component to create a unique layout.
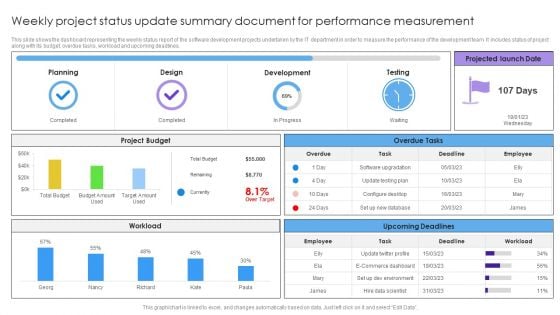
Weekly Project Status Update Summary Document For Performance Measurement Mockup PDF
This slide shows the dashboard representing the weekly status report of the software development projects undertaken by the IT department in order to measure the performance of the development team. It includes status of project along with its budget, overdue tasks, workload and upcoming deadlines. Pitch your topic with ease and precision using this Weekly Project Status Update Summary Document For Performance Measurement Mockup PDF. This layout presents information on Planning, Design, Development, Testing. It is also available for immediate download and adjustment. So, changes can be made in the color, design, graphics or any other component to create a unique layout.
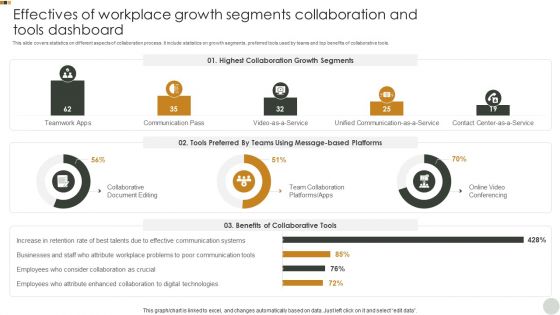
Effectives Of Workplace Growth Segments Collaboration And Tools Dashboard Graphics PDF
This slide covers statistics on different aspects of collaboration process. It include statistics on growth segments, preferred tools used by teams and top benefits of collaborative tools. Pitch your topic with ease and precision using this Effectives Of Workplace Growth Segments Collaboration And Tools Dashboard Graphics PDF. This layout presents information on Highest Collaboration, Growth Segments, Tools Preferred. It is also available for immediate download and adjustment. So, changes can be made in the color, design, graphics or any other component to create a unique layout.
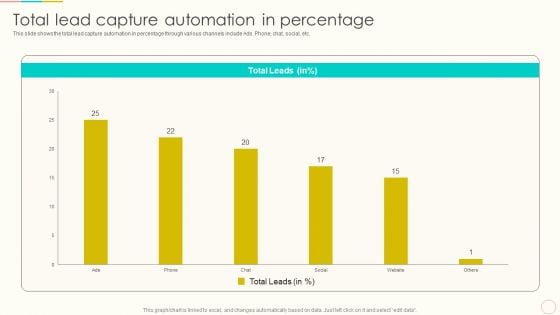
Lead Management To Engage Potential Customers Total Lead Capture Automation In Percentage Rules PDF
This slide shows the total lead capture automation in percentage through various channels include Ads. Phone, chat, social, etc. This Lead Management To Engage Potential Customers Total Lead Capture Automation In Percentage Rules PDF from Slidegeeks makes it easy to present information on your topic with precision. It provides customization options, so you can make changes to the colors, design, graphics, or any other component to create a unique layout. It is also available for immediate download, so you can begin using it right away. Slidegeeks has done good research to ensure that you have everything you need to make your presentation stand out. Make a name out there for a brilliant performance.
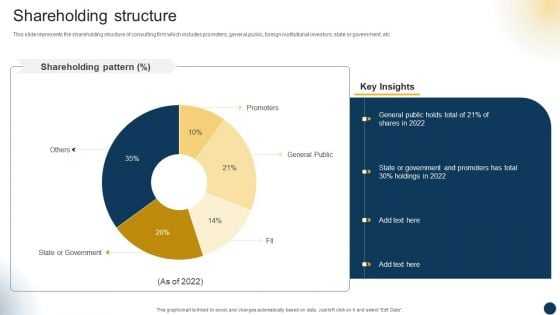
Organizational Advisory Solutions Business Profile Shareholding Structure Designs PDF
This slide represents the shareholding structure of consulting firm which includes promoters, general public, foreign institutional investors, state or government, etc. This Organizational Advisory Solutions Business Profile Shareholding Structure Designs PDF from Slidegeeks makes it easy to present information on your topic with precision. It provides customization options, so you can make changes to the colors, design, graphics, or any other component to create a unique layout. It is also available for immediate download, so you can begin using it right away. Slidegeeks has done good research to ensure that you have everything you need to make your presentation stand out. Make a name out there for a brilliant performance.
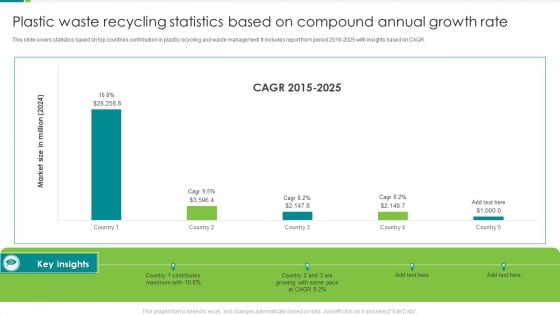
Plastic Waste Recycling Statistics Based On Compound Annual Growth Rate Inspiration PDF
This slide covers statistics based on top countries contribution in plastic recycling and waste management. It includes report from period 2019-2025 with insights based on CAGR. Pitch your topic with ease and precision using this Plastic Waste Recycling Statistics Based On Compound Annual Growth Rate Inspiration PDF. This layout presents information on Contributes Maximum, 2015 To 2025. It is also available for immediate download and adjustment. So, changes can be made in the color, design, graphics or any other component to create a unique layout.
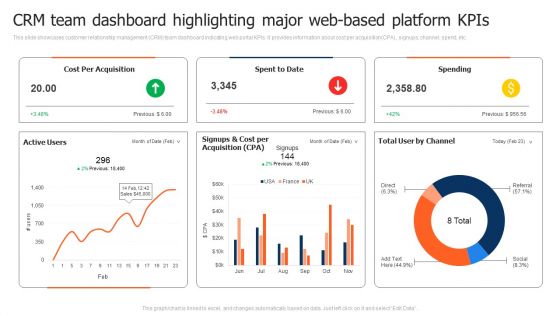
CRM Team Dashboard Highlighting Major Web Based Platform Kpis Template PDF
This slide showcases customer relationship management CRM team dashboard indicating web portal KPIs. It provides information about cost per acquisition CPA, signups, channel, spend, etc. Pitch your topic with ease and precision using this CRM Team Dashboard Highlighting Major Web Based Platform Kpis Template PDF. This layout presents information on CRM Team Dashboard Highlighting, Web Based Platform Kpis. It is also available for immediate download and adjustment. So, changes can be made in the color, design, graphics or any other component to create a unique layout.
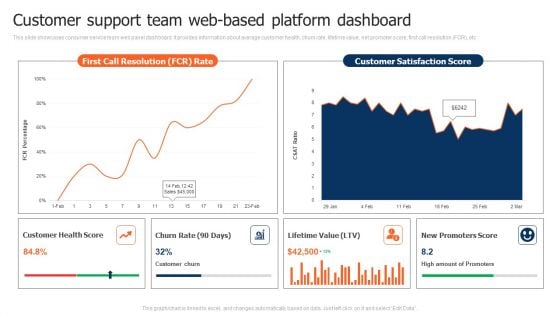
Customer Support Team Web Based Platform Dashboard Demonstration PDF
This slide showcases consumer service team web panel dashboard. It provides information about average customer health, churn rate, lifetime value, net promoter score, first call resolution FCR, etc. Pitch your topic with ease and precision using this Customer Support Team Web Based Platform Dashboard Demonstration PDF. This layout presents information on Churn Rate, Lifetime Value, Customer Health Score. It is also available for immediate download and adjustment. So, changes can be made in the color, design, graphics or any other component to create a unique layout.
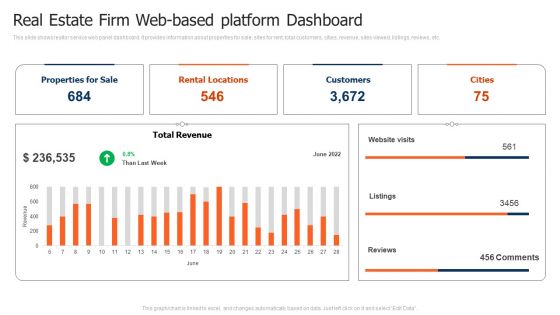
Real Estate Firm Web Based Platform Dashboard Background PDF
This slide shows realtor service web panel dashboard. It provides information about properties for sale, sites for rent, total customers, cities, revenue, sites viewed, listings, reviews, etc. Pitch your topic with ease and precision using this Real Estate Firm Web Based Platform Dashboard Background PDF. This layout presents information on Total Revenue, Rental Locations, Properties For Sale. It is also available for immediate download and adjustment. So, changes can be made in the color, design, graphics or any other component to create a unique layout.

Financial Highlights For Construction Company Yearly Report Template PDF
This slide showcases report for construction company annual financial highlights that can help in analyzing the financial health of organization and help investors to make informed decisions. It outlines information about turnover, profit before tax, profit after, equity capital and reserves. Pitch your topic with ease and precision using this Financial Highlights For Construction Company Yearly Report Template PDF. This layout presents information on Reserve And Surplus, Profit, Turnover. It is also available for immediate download and adjustment. So, changes can be made in the color, design, graphics or any other component to create a unique layout.
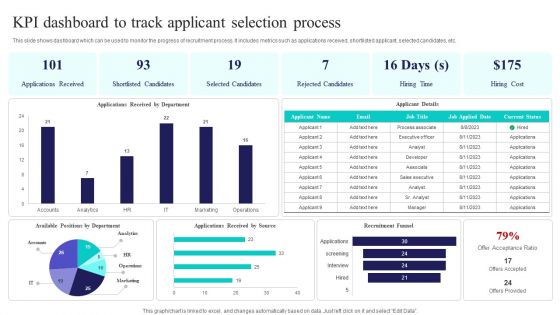
Kpi Dashboard To Track Applicant Selection Process Ppt PowerPoint Presentation File Graphics Template PDF
This slide shows dashboard which can be used to monitor the progress of recruitment process. It includes metrics such as applications received, shortlisted applicant, selected candidates, etc. Pitch your topic with ease and precision using this Kpi Dashboard To Track Applicant Selection Process Ppt PowerPoint Presentation File Graphics Template PDF. This layout presents information on Applications Received, Shortlisted Candidates, Selected Candidates. It is also available for immediate download and adjustment. So, changes can be made in the color, design, graphics or any other component to create a unique layout.
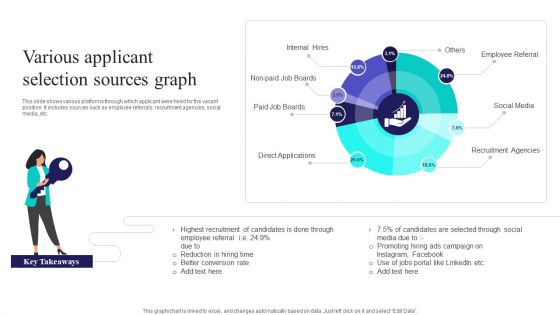
Various Applicant Selection Sources Graph Ppt PowerPoint Presentation Gallery Slide Download PDF
This slide shows various platforms through which applicant were hired for the vacant position. It includes sources such as employee referrals, recruitment agencies, social media, etc. Pitch your topic with ease and precision using this Various Applicant Selection Sources Graph Ppt PowerPoint Presentation Gallery Slide Download PDF. This layout presents information on Internal Hires, Paid Job Boards, Direct Applications. It is also available for immediate download and adjustment. So, changes can be made in the color, design, graphics or any other component to create a unique layout.
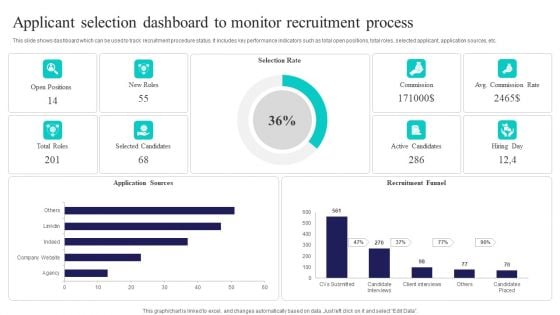
Applicant Selection Dashboard To Monitor Recruitment Process Sample PDF
This slide shows dashboard which can be used to track recruitment procedure status. It includes key performance indicators such as total open positions, total roles, selected applicant, application sources, etc. Pitch your topic with ease and precision using this Applicant Selection Dashboard To Monitor Recruitment Process Sample PDF. This layout presents information on Selection Rate, Recruitment Funnel, Application Sources. It is also available for immediate download and adjustment. So, changes can be made in the color, design, graphics or any other component to create a unique layout.
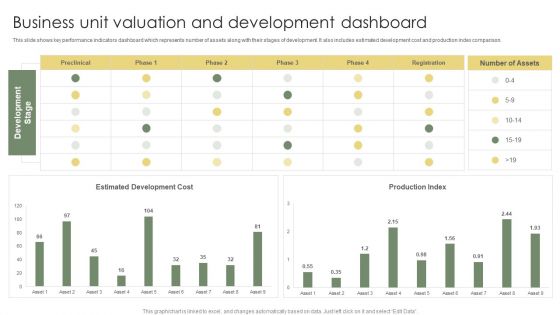
Business Unit Valuation And Development Dashboard Ppt Professional Graphic Tips PDF
This slide shows key performance indicators dashboard which represents number of assets along with their stages of development. It also includes estimated development cost and production index comparison. Pitch your topic with ease and precision using this Business Unit Valuation And Development Dashboard Ppt Professional Graphic Tips PDF. This layout presents information on Estimated Development Cost, Production Index, Development Stage. It is also available for immediate download and adjustment. So, changes can be made in the color, design, graphics or any other component to create a unique layout.
Reverse Proxy Web Server Dashboard For Reverse Proxy Performance Tracking Elements PDF
This slide represents the dashboard for reverse proxy performance tracking by covering details of CPU load, available memory, and connections. If your project calls for a presentation, then Slidegeeks is your go-to partner because we have professionally designed, easy-to-edit templates that are perfect for any presentation. After downloading, you can easily edit Reverse Proxy Web Server Dashboard For Reverse Proxy Performance Tracking Elements PDF and make the changes accordingly. You can rearrange slides or fill them with different images. Check out all the handy templates
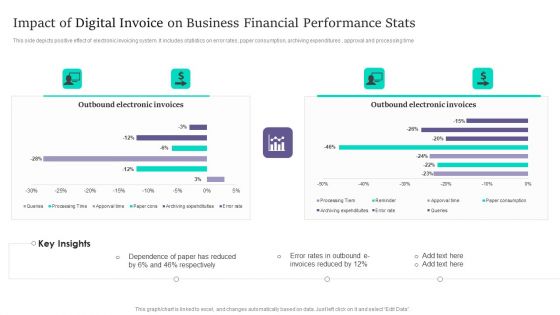
Impact Of Digital Invoice On Business Financial Performance Stats Infographics PDF
This side depicts positive effect of electronic invoicing system. It includes statistics on error rates, paper consumption, archiving expenditures , approval and processing time. Pitch your topic with ease and precision using this Impact Of Digital Invoice On Business Financial Performance Stats Infographics PDF. This layout presents information on Impact Of Digital Invoice, Business Financial Performance Stats. It is also available for immediate download and adjustment. So, changes can be made in the color, design, graphics or any other component to create a unique layout.
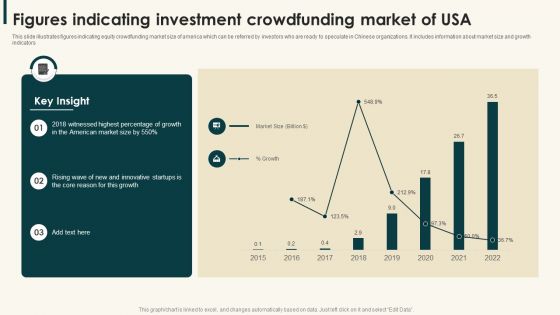
Figures Indicating Investment Crowdfunding Market Of Usa Information PDF
This slide illustrates figures indicating equity crowdfunding market size of america which can be referred by investors who are ready to speculate in Chinese organizations. It includes information about market size and growth indicators,Pitch your topic with ease and precision using this Figures Indicating Investment Crowdfunding Market Of Usa Information PDF. This layout presents information on Witnessed Highest, American Market, Innovative Startups. It is also available for immediate download and adjustment. So, changes can be made in the color, design, graphics or any other component to create a unique layout.
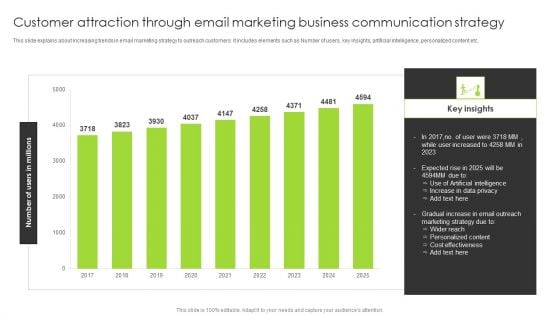
Customer Attraction Through Email Marketing Business Communication Strategy Portrait PDF
This slide explains about increasing trends in email marketing strategy to outreach customers. It includes elements such as Number of users, key insights, artificial intelligence, personalized content etc. Pitch your topic with ease and precision using this Customer Attraction Through Email Marketing Business Communication Strategy Portrait PDF. This layout presents information on Gradual Increase, Email Outreach, Marketing Strategy. It is also available for immediate download and adjustment. So, changes can be made in the color, design, graphics or any other component to create a unique layout.
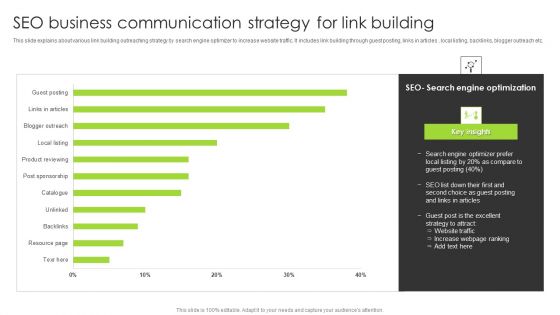
SEO Business Communication Strategy For Link Building Mockup PDF
This slide explains about various link building outreaching strategy by search engine optimizer to increase website traffic. It includes link building through guest posting, links in articles , local listing, backlinks, blogger outreach etc. Pitch your topic with ease and precision using this SEO Business Communication Strategy For Link Building Mockup PDF. This layout presents information on Resource Page, Backlinks, Post Sponsorship. It is also available for immediate download and adjustment. So, changes can be made in the color, design, graphics or any other component to create a unique layout.
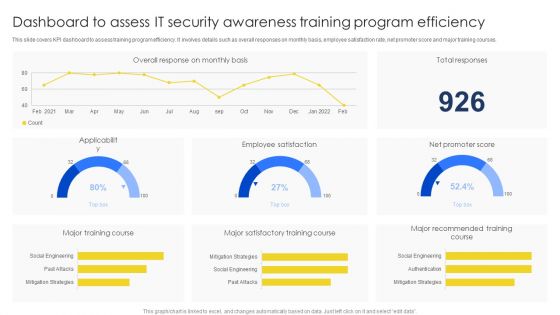
Dashboard To Assess IT Security Awareness Training Program Efficiency Brochure PDF
This slide covers KPI dashboard to assess training program efficiency. It involves details such as overall responses on monthly basis, employee satisfaction rate, net promoter score and major training courses. Pitch your topic with ease and precision using this Dashboard To Assess IT Security Awareness Training Program Efficiency Brochure PDF. This layout presents information on Major Training Course, Major Satisfactory, Training Course. It is also available for immediate download and adjustment. So, changes can be made in the color, design, graphics or any other component to create a unique layout.
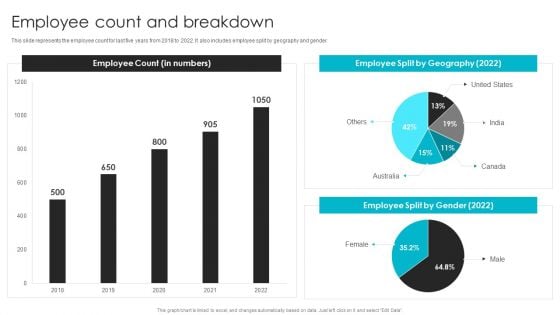
Web Design Company Overview Employee Count And Breakdown Topics PDF
This slide represents the employee count for last five years from 2018 to 2022. It also includes employee split by geography and gender. This Web Design Company Overview Employee Count And Breakdown Topics PDF from Slidegeeks makes it easy to present information on your topic with precision. It provides customization options, so you can make changes to the colors, design, graphics, or any other component to create a unique layout. It is also available for immediate download, so you can begin using it right away. Slidegeeks has done good research to ensure that you have everything you need to make your presentation stand out. Make a name out there for a brilliant performance.
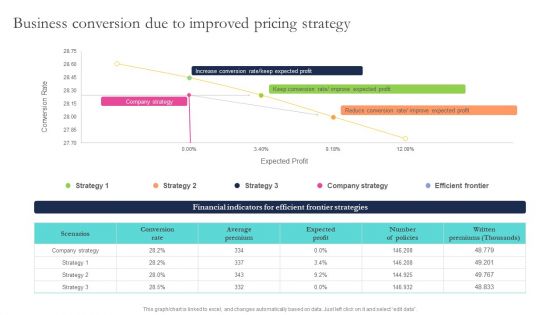
Optimizing Smart Pricing Tactics To Improve Sales Business Conversion Due To Improved Pricing Strategy Summary PDF
This Optimizing Smart Pricing Tactics To Improve Sales Business Conversion Due To Improved Pricing Strategy Summary PDF from Slidegeeks makes it easy to present information on your topic with precision. It provides customization options, so you can make changes to the colors, design, graphics, or any other component to create a unique layout. It is also available for immediate download, so you can begin using it right away. Slidegeeks has done good research to ensure that you have everything you need to make your presentation stand out. Make a name out there for a brilliant performance.
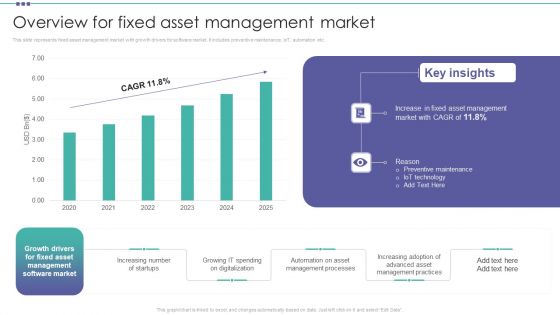
Overview For Fixed Asset Management Market Organization Physical Assets Portrait PDF
This slide represents fixed asset management market with growth drivers for software market. It includes preventive maintenance, IoT, automation etc.This Overview For Fixed Asset Management Market Organization Physical Assets Portrait PDF from Slidegeeks makes it easy to present information on your topic with precision. It provides customization options, so you can make changes to the colors, design, graphics, or any other component to create a unique layout. It is also available for immediate download, so you can begin using it right away. Slidegeeks has done good research to ensure that you have everything you need to make your presentation stand out. Make a name out there for a brilliant performance.
Implementation Challenges For Tracking And Assessment Framework Slides PDF
The slide displays statistical report for potential failures in effective implementation of monitoring and evaluation framework. It includes key components such as insufficient funds, employee resistance, poor communication, etc. Pitch your topic with ease and precision using this Implementation Challenges For Tracking And Assessment Framework Slides PDF. This layout presents information on Budget Allocated, Monitoring, Framework. It is also available for immediate download and adjustment. So, changes can be made in the color, design, graphics or any other component to create a unique layout.
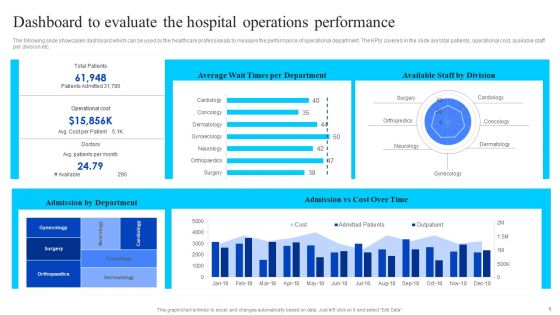
Healthcare Management Overview Trends Stats And Operational Areas Dashboard To Evaluate The Hospital Operations Performance Pictures PDF
The following slide showcases dashboard which can be used by the healthcare professionals to measure the performance of operational department. The KPIs covered in the slide are total patients, operational cost, available staff per division etc. There are so many reasons you need a Healthcare Management Overview Trends Stats And Operational Areas Dashboard To Evaluate The Hospital Operations Performance Pictures PDF. The first reason is you can not spend time making everything from scratch, Thus, Slidegeeks has made presentation templates for you too. You can easily download these templates from our website easily.
Staff Awareness Playbook Determine Workforce Training Performance Tracking Dashboard Slides PDF
This slide provides information regarding workforce training performance tracking dashboard with training cost, number of participants, hours of training, etc. This Staff Awareness Playbook Determine Workforce Training Performance Tracking Dashboard Slides PDF from Slidegeeks makes it easy to present information on your topic with precision. It provides customization options, so you can make changes to the colors, design, graphics, or any other component to create a unique layout. It is also available for immediate download, so you can begin using it right away. Slidegeeks has done good research to ensure that you have everything you need to make your presentation stand out. Make a name out there for a brilliant performance.
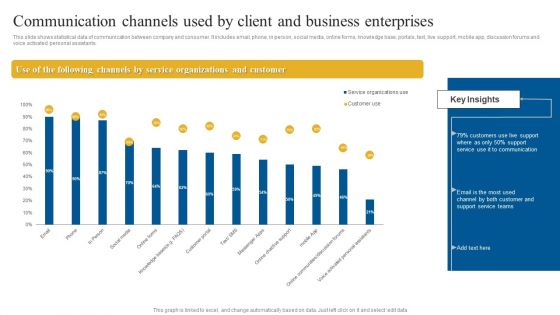
Communication Channels Used By Client And Business Enterprises Guidelines PDF
This slide shows statistical data of communication between company and consumer. It includes email, phone, in person, social media, online forms, knowledge base, portals, text, live support, mobile app, discussion forums and voice activated personal assistants. Pitch your topic with ease and precision using this Communication Channels Used By Client And Business Enterprises Guidelines PDF. This layout presents information on Service, Communication, Customer. It is also available for immediate download and adjustment. So, changes can be made in the color, design, graphics or any other component to create a unique layout.
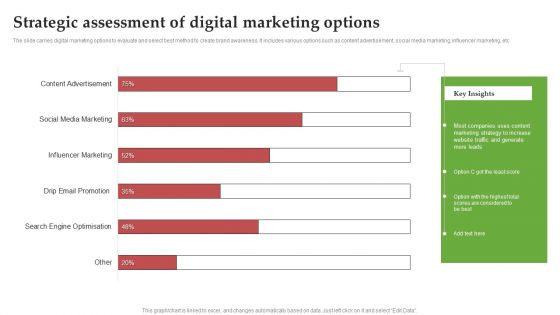
Strategic Assessment Of Digital Marketing Options Ppt PowerPoint Presentation File Show PDF
The slide carries digital marketing options to evaluate and select best method to create brand awareness. It includes various options such as content advertisement, social media marketing, influencer marketing, etc. Pitch your topic with ease and precision using this Strategic Assessment Of Digital Marketing Options Ppt PowerPoint Presentation File Show PDF. This layout presents information on Influencer Marketing, Social Media Marketing, Content Advertisement. It is also available for immediate download and adjustment. So, changes can be made in the color, design, graphics or any other component to create a unique layout.
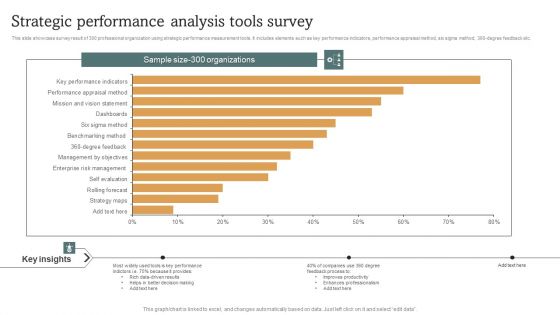
Strategic Performance Analysis Tools Survey Microsoft PDF
This slide showcase survey result of 300 professional organization using strategic performance measurement tools. It includes elements such as key performance indicators, performance appraisal method, six sigma method, 360 degree feedback etc. Pitch your topic with ease and precision using this Strategic Performance Analysis Tools Survey Microsoft PDF. This layout presents information on Strategic Performance, Analysis Tools Survey. It is also available for immediate download and adjustment. So, changes can be made in the color, design, graphics or any other component to create a unique layout.
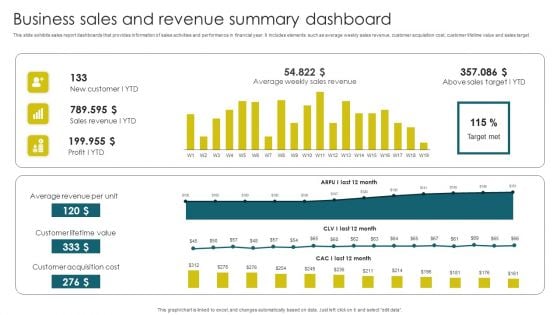
Business Sales And Revenue Summary Dashboard Brochure PDF
This slide exhibits sales report dashboards that provides information of sales activities and performance in financial year. It includes elements such as average weekly sales revenue, customer acquisition cost, customer lifetime value and sales target. Pitch your topic with ease and precision using this Business Sales And Revenue Summary Dashboard Brochure PDF. This layout presents information on Average Revenue, Customer Lifetime, Customer Acquisition. It is also available for immediate download and adjustment. So, changes can be made in the color, design, graphics or any other component to create a unique layout.
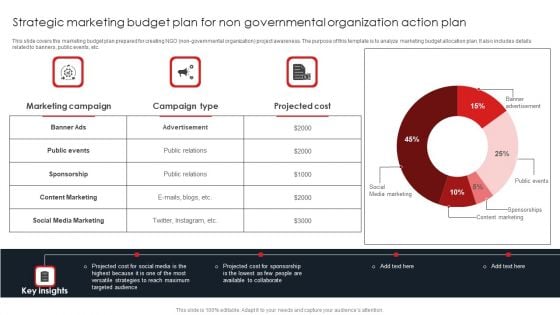
Strategic Marketing Budget Plan For Non Governmental Organization Action Plan Background PDF
This slide covers the marketing budget plan prepared for creating NGO non-governmental organization project awareness. The purpose of this template is to analyze marketing budget allocation plan. It also includes details related to banners, public events, etc.Pitch your topic with ease and precision using this Strategic Marketing Budget Plan For Non Governmental Organization Action Plan Background PDF. This layout presents information on Content Marketing, Media Marketing, Projected Cost. It is also available for immediate download and adjustment. So, changes can be made in the color, design, graphics or any other component to create a unique layout.
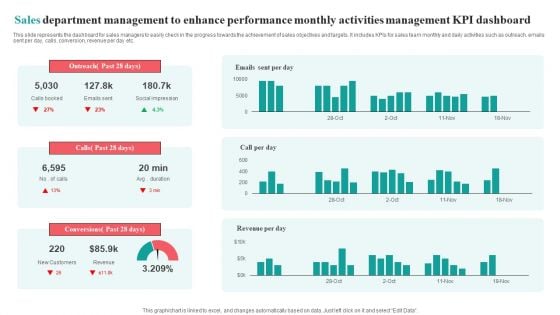
Sales Department Management To Enhance Performance Monthly Activities Management KPI Dashboard Brochure PDF
This slide represents the dashboard for sales managers to easily check in the progress towards the achievement of sales objectives and targets. It includes KPIs for sales team monthly and daily activities such as outreach, emails sent per day, calls, conversion, revenue per day etc.Pitch your topic with ease and precision using this Sales Department Management To Enhance Performance Monthly Activities Management KPI Dashboard Brochure PDF. This layout presents information on Social Impression, Conversions Past, Outreach Past. It is also available for immediate download and adjustment. So, changes can be made in the color, design, graphics or any other component to create a unique layout.
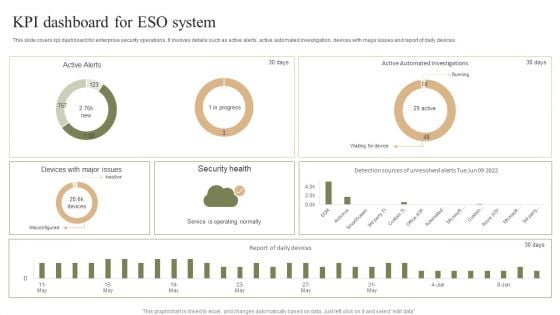
KPI Dashboard For ESO System Ppt PowerPoint Presentation File Template PDF
This slide covers kpi dashboard for enterprise security operations. It involves details such as active alerts, active automated investigation, devices with major issues and report of daily devices. Pitch your topic with ease and precision using this KPI Dashboard For ESO System Ppt PowerPoint Presentation File Template PDF. This layout presents information on Security Health, Misconfigured, Service Operating Normally. It is also available for immediate download and adjustment. So, changes can be made in the color, design, graphics or any other component to create a unique layout.
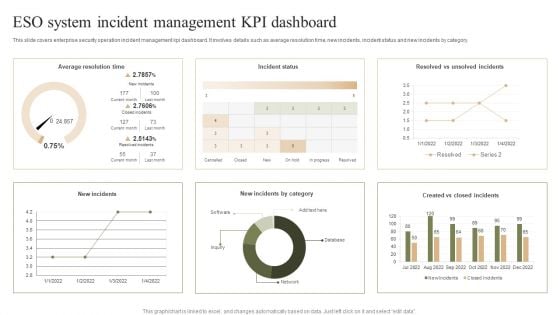
ESO System Incident Management KPI Dashboard Ppt PowerPoint Presentation File Graphic Images PDF
This slide covers enterprise security operation incident management kpi dashboard. It involves details such as average resolution time, new incidents, incident status and new incidents by category. Pitch your topic with ease and precision using this ESO System Incident Management KPI Dashboard Ppt PowerPoint Presentation File Graphic Images PDF. This layout presents information on Average Resolution Time, Incident Status, New Incidents. It is also available for immediate download and adjustment. So, changes can be made in the color, design, graphics or any other component to create a unique layout.
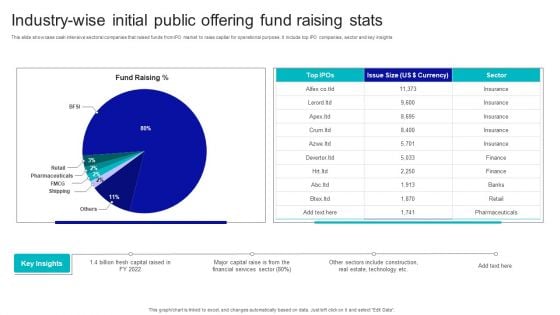
Industry Wise Initial Public Offering Fund Raising Stats Demonstration PDF
This slide showcase cash intensive sectoral companies that raised funds from IPO market to raise capital for operational purpose. It include top IPO companies, sector and key insights. Pitch your topic with ease and precision using this Industry Wise Initial Public Offering Fund Raising Stats Demonstration PDF. This layout presents information on Industry Wise Initial, Public Offering, Fund Raising Stats. It is also available for immediate download and adjustment. So, changes can be made in the color, design, graphics or any other component to create a unique layout.
Employees Attrition Tracking Statistics And Resignation Rate Report By Industry Background PDF
This slide covers dashboard for industry wise employees turnover rates. It further includes statistics on resignation rare of workers, average turnover rates for different industries. Pitch your topic with ease and precision using this Employees Attrition Tracking Statistics And Resignation Rate Report By Industry Background PDF. This layout presents information on Employees, Industry, Average Turnover Rate. It is also available for immediate download and adjustment. So, changes can be made in the color, design, graphics or any other component to create a unique layout.
Impact Survey Report Of Employee Attrition Tracking On Team Operations Demonstration PDF
This slide covers key factors having high impact on day to day team operations. It includes areas such as delay in project delivery, loss of productivity, rehiring cost and on boarding a replacement, low team morale, stress issues, legal and HR related issues. Pitch your topic with ease and precision using this Impact Survey Report Of Employee Attrition Tracking On Team Operations Demonstration PDF. This layout presents information on Employees Turnover, Project, Cost. It is also available for immediate download and adjustment. So, changes can be made in the color, design, graphics or any other component to create a unique layout.
Report On Cost Of High Restaurant Attrition Tracking With Key Insights Topics PDF
This slide depicts breakdown of cost incurred due to restaurant employees turnover. It includes components such as productivity loss, recruitment costs, selection costs, pre-departure costs, orientation and training costs, along with turnover rates, cost per churned employee, total annual cost. Pitch your topic with ease and precision using this Report On Cost Of High Restaurant Attrition Tracking With Key Insights Topics PDF. This layout presents information on Average Turnover Cost, Employee, Productivity. It is also available for immediate download and adjustment. So, changes can be made in the color, design, graphics or any other component to create a unique layout.
Staff Productivity And Attrition Tracking Rate Statistical Report Ideas PDF
This slide covers dashboard for employees productivity stats. It further includes stats for absence rates, cost incurred, benefits derived, satisfaction index, net promoter score, turnover and promotion rates. Pitch your topic with ease and precision using this Staff Productivity And Attrition Tracking Rate Statistical Report Ideas PDF. This layout presents information on Absence Cost, Benefits Satisfaction, Productivity Rate. It is also available for immediate download and adjustment. So, changes can be made in the color, design, graphics or any other component to create a unique layout.
Issues Tracking Dashboard For Organizational Building Management Ppt Infographics Topics PDF
This slide showcases dashboard which can help organization to keep track of issues plus faults during facility management and rectify them within stipulated time. Its key elements are issues reported, fault tracking, etc. Pitch your topic with ease and precision using this Issues Tracking Dashboard For Organizational Building Management Ppt Infographics Topics PDF. This layout presents information on Fault Tracking, Issues Reported, Location. It is also available for immediate download and adjustment. So, changes can be made in the color, design, graphics or any other component to create a unique layout.
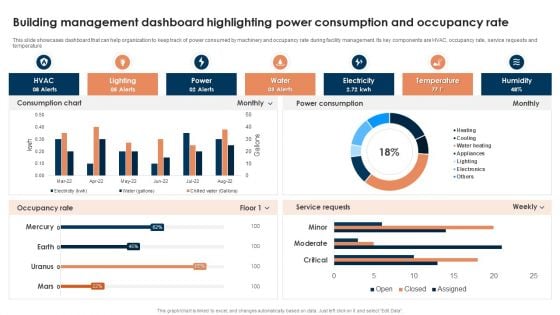
Building Management Dashboard Highlighting Power Consumption And Occupancy Rate Template PDF
This slide showcases dashboard that can help organization to keep track of power consumed by machinery and occupancy rate during facility management. Its key components are HVAC, occupancy rate, service requests and temperature. Pitch your topic with ease and precision using this Building Management Dashboard Highlighting Power Consumption And Occupancy Rate Template PDF. This layout presents information on Lighting, Power, Water, Electricity, Temperature. It is also available for immediate download and adjustment. So, changes can be made in the color, design, graphics or any other component to create a unique layout.
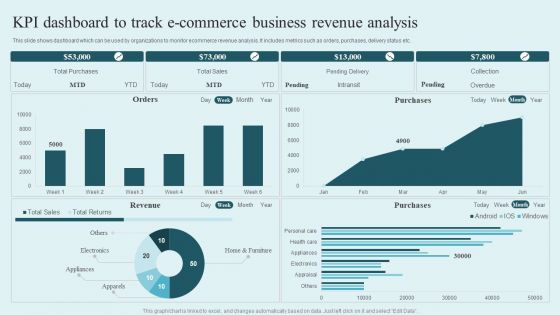
KPI Dashboard To Track E Commerce Business Revenue Analysis Rules PDF
This slide shows dashboard which can be used by organizations to monitor ecommerce revenue analysis. It includes metrics such as orders, purchases, delivery status etc. Pitch your topic with ease and precision using this KPI Dashboard To Track E Commerce Business Revenue Analysis Rules PDF. This layout presents information on Total Purchases, Total Sales, Pending Delivery, Collection. It is also available for immediate download and adjustment. So, changes can be made in the color, design, graphics or any other component to create a unique layout.
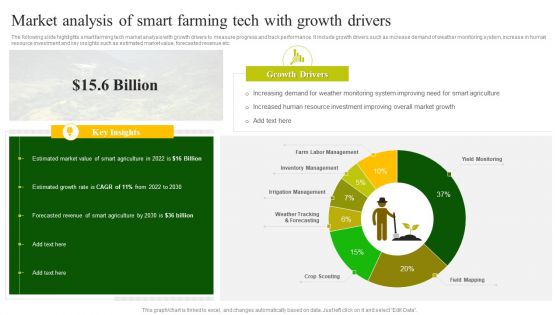
Market Analysis Of Smart Farming Tech With Growth Drivers Template PDF
The following slide highlights smart farming tech market analysis with growth drivers to measure progress and track performance. It include growth drivers such as increase demand of weather monitoring system, increase in human resource investment and key insights such as estimated market value, forecasted revenue etc.Pitch your topic with ease and precision using this Market Analysis Of Smart Farming Tech With Growth Drivers Template PDF. This layout presents information on Estimated Growth, Estimated Market Value, Forecasted Revenue. It is also available for immediate download and adjustment. So, changes can be made in the color, design, graphics or any other component to create a unique layout.
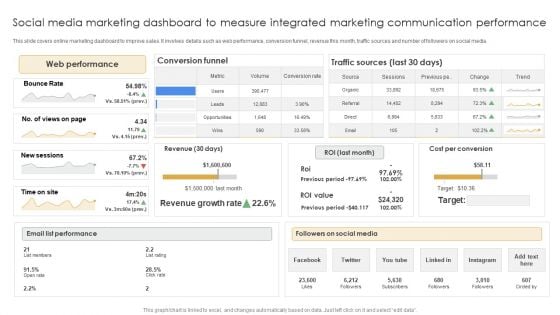
Social Media Marketing Dashboard To Measure Integrated Marketing Communication Performance Clipart PDF
This slide covers online marketing dashboard to improve sales. It involves details such as web performance, conversion funnel, revenue this month, traffic sources and number of followers on social media. Pitch your topic with ease and precision using this Social Media Marketing Dashboard To Measure Integrated Marketing Communication Performance Clipart PDF. This layout presents information on Web Performance, Email List Performance, Followers Social Media. It is also available for immediate download and adjustment. So, changes can be made in the color, design, graphics or any other component to create a unique layout.

Cash Management Dashboard With Sales Outstanding And Liquidity Ratio Analysis Information PDF
This showcases dashboard that can help organization in cash management and track KPIs to evaluate the financial performance of company. It key components are liquidity ratios, cash balance. days sales outstanding, days inventory outstanding and days payable outstanding. Pitch your topic with ease and precision using this Cash Management Dashboard With Sales Outstanding And Liquidity Ratio Analysis Information PDF. This layout presents information on Cash Conversion, Working Capital, Cash Balance. It is also available for immediate download and adjustment. So, changes can be made in the color, design, graphics or any other component to create a unique layout.
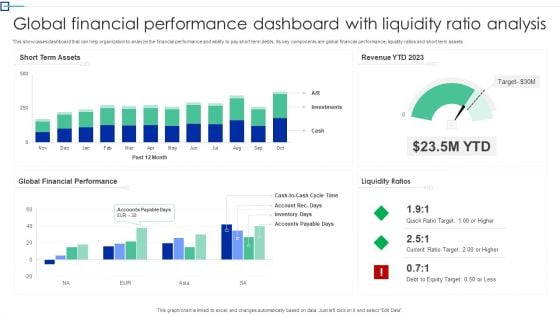
Global Financial Performance Dashboard With Liquidity Ratio Analysis Information PDF
This showcases dashboard that can help organization to analyze the financial performance and ability to pay short term debts. Its key components are global financial performance, liquidity ratios and short term assets. Pitch your topic with ease and precision using this Global Financial Performance Dashboard With Liquidity Ratio Analysis Information PDF. This layout presents information on Short Term Assets, Global Financial Performance, Liquidity Ratios. It is also available for immediate download and adjustment. So, changes can be made in the color, design, graphics or any other component to create a unique layout.
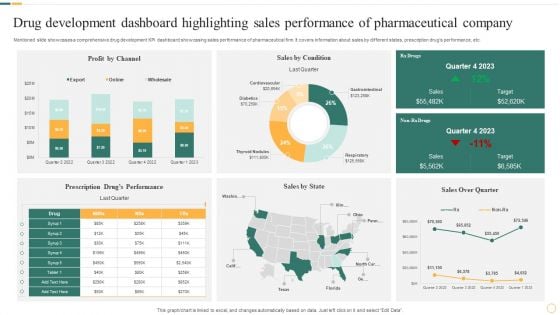
Drug Development Dashboard Highlighting Sales Performance Of Pharmaceutical Company Microsoft PDF
Mentioned slide showcases a comprehensive drug development KPI dashboard showcasing sales performance of pharmaceutical firm. It covers information about sales by different states, prescription drugs performance, etc. Pitch your topic with ease and precision using this Drug Development Dashboard Highlighting Sales Performance Of Pharmaceutical Company Microsoft PDF. This layout presents information on Sales By Condition, Profit By Channel, Sales By State. It is also available for immediate download and adjustment. So, changes can be made in the color, design, graphics or any other component to create a unique layout.
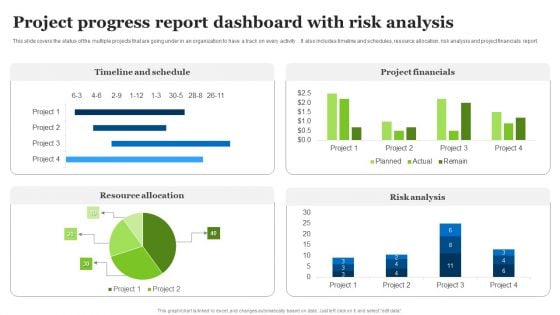
Project Progress Report Dashboard With Risk Analysis Ppt Examples PDF
This slide covers the status of the multiple projects that are going under in an organization to have a track on every activity . It also includes timeline and schedules, resource allocation, risk analysis and project financials report. Pitch your topic with ease and precision using this Project Progress Report Dashboard With Risk Analysis Ppt Examples PDF. This layout presents information on Timeline And Schedule, Project Financials, Risk Analysis. It is also available for immediate download and adjustment. So, changes can be made in the color, design, graphics or any other component to create a unique layout.
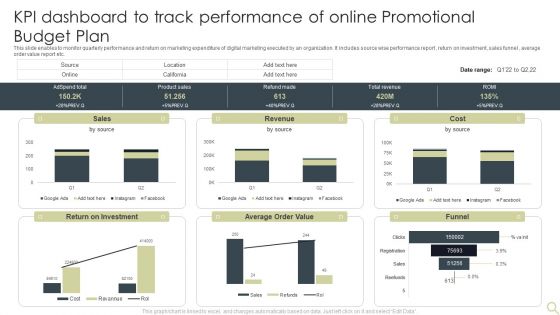
KPI Dashboard To Track Performance Of Online Promotional Budget Plan Inspiration PDF
This slide enables to monitor quarterly performance and return on marketing expenditure of digital marketing executed by an organization. It includes source wise performance report , return on investment, sales funnel , average order value report etc. Pitch your topic with ease and precision using this KPI Dashboard To Track Performance Of Online Promotional Budget Plan Inspiration PDF. This layout presents information on Average Order Value, Return On Investment, Sales. It is also available for immediate download and adjustment. So, changes can be made in the color, design, graphics or any other component to create a unique layout.
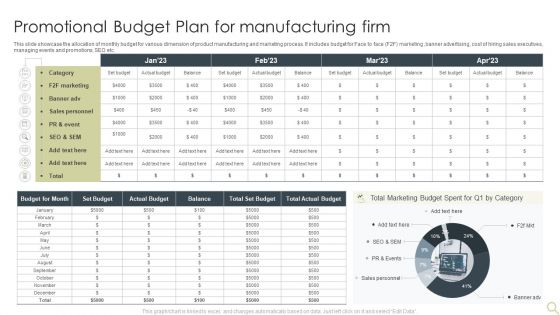
Promotional Budget Plan For Manufacturing Firm Information PDF
This slide showcase the allocation of monthly budget for various dimension of product manufacturing and marketing process. It includes budget for Face to face F2F marketing ,banner advertising, cost of hiring sales executives, managing events and promotions, SEO etc. Pitch your topic with ease and precision using this Promotional Budget Plan For Manufacturing Firm Information PDF. This layout presents information on Marketing, Budget, Sales Personnel. It is also available for immediate download and adjustment. So, changes can be made in the color, design, graphics or any other component to create a unique layout.
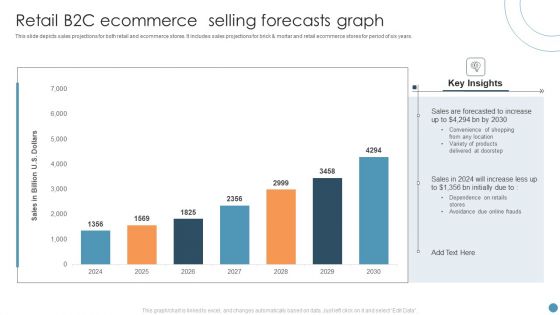
Retail B2C Ecommerce Selling Forecasts Graph Portrait PDF
This slide depicts sales projections for both retail and ecommerce stores. It includes sales projections for brick and mortar and retail ecommerce stores for period of six years. Pitch your topic with ease and precision using this Retail B2C Ecommerce Selling Forecasts Graph Portrait PDF. This layout presents information on Retail B2C Ecommerce, Selling Forecasts Graph. It is also available for immediate download and adjustment. So, changes can be made in the color, design, graphics or any other component to create a unique layout.
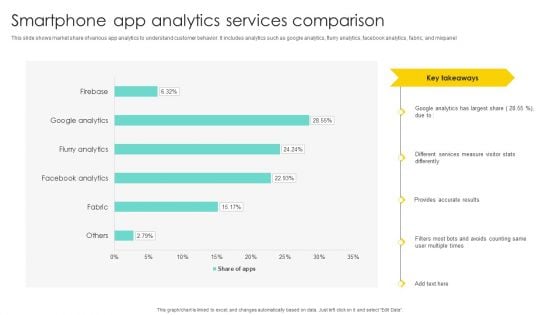
Smartphone App Analytics Services Comparison Brochure PDF
This slide shows market share of various app analytics to understand customer behavior. It includes analytics such as google analytics, flurry analytics, facebook analytics, fabric, and mixpanel. Pitch your topic with ease and precision using this Smartphone App Analytics Services Comparison Brochure PDF. This layout presents information on Different Services Measure, Visitor Stats Differently, Provides Accurate Results. It is also available for immediate download and adjustment. So, changes can be made in the color, design, graphics or any other component to create a unique layout.
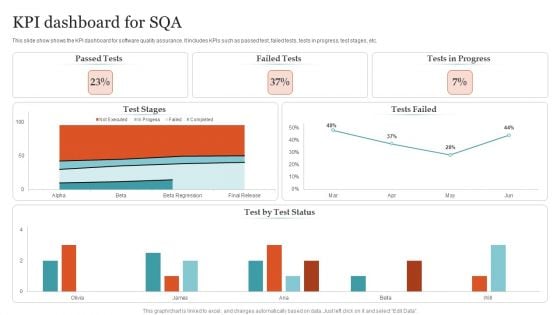
KPI Dashboard For SQA Ppt PowerPoint Presentation Gallery Structure PDF
This slide show shows the KPI dashboard for software quality assurance. It includes KPIs such as passed test, failed tests, tests in progress, test stages, etc. Pitch your topic with ease and precision using this KPI Dashboard For SQA Ppt PowerPoint Presentation Gallery Structure PDF. This layout presents information on Passed Tests, Failed Tests, Tests Progress . It is also available for immediate download and adjustment. So, changes can be made in the color, design, graphics or any other component to create a unique layout.
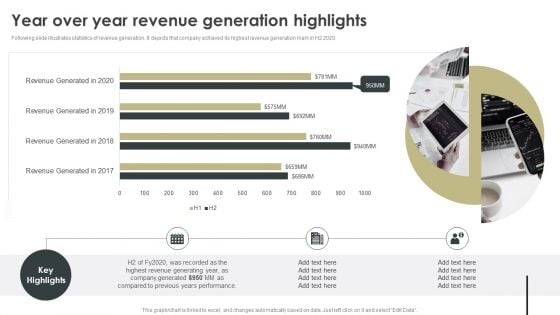
Year Over Year Revenue Generation Highlights Inspiration PDF
Following slide illustrates statistics of revenue generation. It depicts that company achieved its highest revenue generation mark in H2 2020. This Year Over Year Revenue Generation Highlights Inspiration PDF from Slidegeeks makes it easy to present information on your topic with precision. It provides customization options, so you can make changes to the colors, design, graphics, or any other component to create a unique layout. It is also available for immediate download, so you can begin using it right away. Slidegeeks has done good research to ensure that you have everything you need to make your presentation stand out. Make a name out there for a brilliant performance.
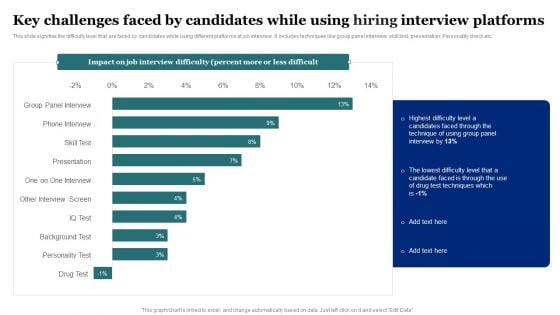
Key Challenges Faced By Candidates While Using Hiring Interview Platforms Rules PDF
This slide signifies the difficulty level that are faced by candidates while using different platforms at job interview. It includes techniques like group panel interview, skill test, presentation, Personality check etc. Pitch your topic with ease and precision using this Key Challenges Faced By Candidates While Using Hiring Interview Platforms Rules PDF. This layout presents information on Group Panel Interview, Phone Interview, Skill Test, Presentation. It is also available for immediate download and adjustment. So, changes can be made in the color, design, graphics or any other component to create a unique layout.
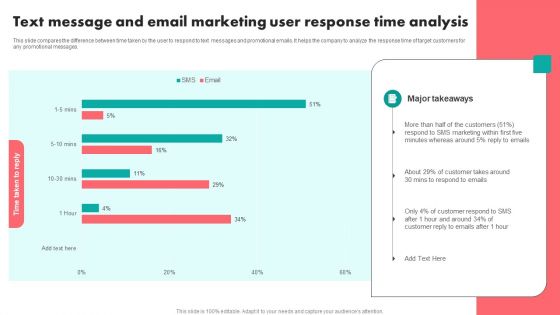
Text Message And Email Marketing User Response Time Analysis Template PDF
This slide compares the difference between time taken by the user to respond to text messages and promotional emails. It helps the company to analyze the response time of target customers for any promotional messages. Pitch your topic with ease and precision using this Text Message And Email Marketing User Response Time Analysis Template PDF. This layout presents information on Text Message, Email Marketing User, Response Time Analysis. It is also available for immediate download and adjustment. So, changes can be made in the color, design, graphics or any other component to create a unique layout.
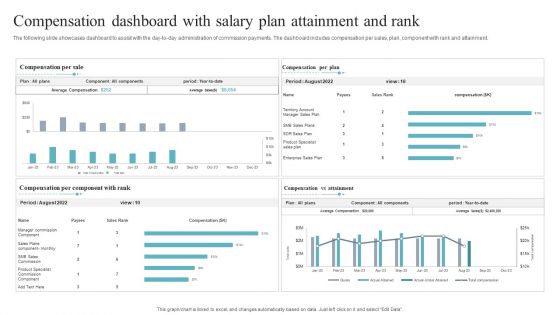
Compensation Dashboard With Salary Plan Attainment And Rank Slides PDF
The following slide showcases dashboard to assist with the day to day administration of commission payments. The dashboard includes compensation per sales, plan, component with rank and attainment. Pitch your topic with ease and precision using this Compensation Dashboard With Salary Plan Attainment And Rank Slides PDF. This layout presents information on Salary Plan Attainment Rank, Compensation Dashboard. It is also available for immediate download and adjustment. So, changes can be made in the color, design, graphics or any other component to create a unique layout.
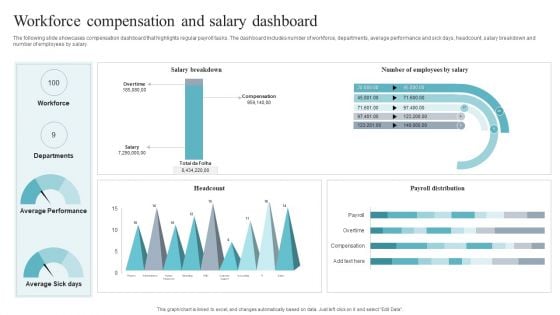
Workforce Compensation And Salary Dashboard Brochure PDF
The following slide showcases compensation dashboard that highlights regular payroll tasks. The dashboard includes number of workforce, departments, average performance and sick days, headcount, salary breakdown and number of employees by salary. Pitch your topic with ease and precision using this Workforce Compensation And Salary Dashboard Brochure PDF. This layout presents information on Workforce Compensation, Salary Dashboard. It is also available for immediate download and adjustment. So, changes can be made in the color, design, graphics or any other component to create a unique layout.
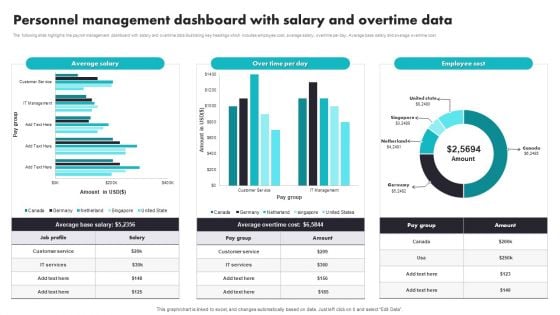
Personnel Management Dashboard With Salary And Overtime Data Ideas PDF
The following slide highlights the payroll management dashboard with salary and overtime data illustrating key headings which includes employee cost, average salary, overtime per day, Average base salary and average overtime cost. Pitch your topic with ease and precision using this Personnel Management Dashboard With Salary And Overtime Data Ideas PDF. This layout presents information on Average, Customer Service, Cost. It is also available for immediate download and adjustment. So, changes can be made in the color, design, graphics or any other component to create a unique layout.
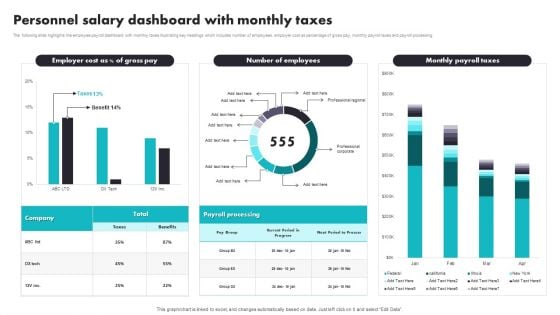
Personnel Salary Dashboard With Monthly Taxes Introduction PDF
The following slide highlights the employee payroll dashboard with monthly taxes illustrating key headings which includes number of employees, employer cost as percentage of gross pay, monthly payroll taxes and payroll processing. Pitch your topic with ease and precision using this Personnel Salary Dashboard With Monthly Taxes Introduction PDF. This layout presents information on Payroll Processing, Benefits. It is also available for immediate download and adjustment. So, changes can be made in the color, design, graphics or any other component to create a unique layout.
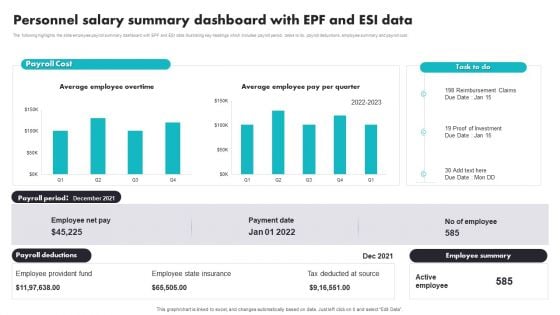
Personnel Salary Summary Dashboard With EPF And ESI Data Brochure PDF
The following highlights the slide employee payroll summary dashboard with EPF and ESI data illustrating key headings which includes payroll period, tasks to do, payroll deductions, employee summary and payroll cost. Pitch your topic with ease and precision using this Personnel Salary Summary Dashboard With EPF And ESI Data Brochure PDF. This layout presents information on Employee Provident Fund, Employee State Insurance, Tax Deducted At Source. It is also available for immediate download and adjustment. So, changes can be made in the color, design, graphics or any other component to create a unique layout.
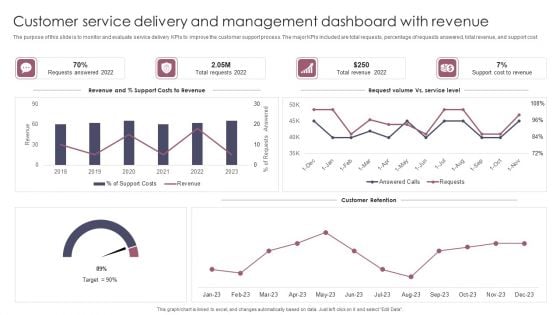
Customer Service Delivery And Management Dashboard With Revenue Brochure PDF
The purpose of this slide is to monitor and evaluate service delivery KPIs to improve the customer support process. The major KPIs included are total requests, percentage of requests answered, total revenue, and support cost. Pitch your topic with ease and precision using this Customer Service Delivery And Management Dashboard With Revenue Brochure PDF. This layout presents information on Customer Service Delivery, Management Dashboard With Revenue. It is also available for immediate download and adjustment. So, changes can be made in the color, design, graphics or any other component to create a unique layout.
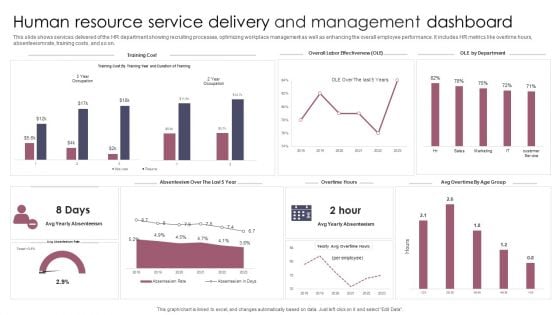
Human Resource Service Delivery And Management Dashboard Information PDF
This slide shows services delivered of the HR department showing recruiting processes, optimizing workplace management as well as enhancing the overall employee performance. It includes HR metrics like overtime hours, absenteeism rate, training costs, and so on. Pitch your topic with ease and precision using this Human Resource Service Delivery And Management Dashboard Information PDF. This layout presents information on Human Resource Service Delivery, Management Dashboard. It is also available for immediate download and adjustment. So, changes can be made in the color, design, graphics or any other component to create a unique layout.
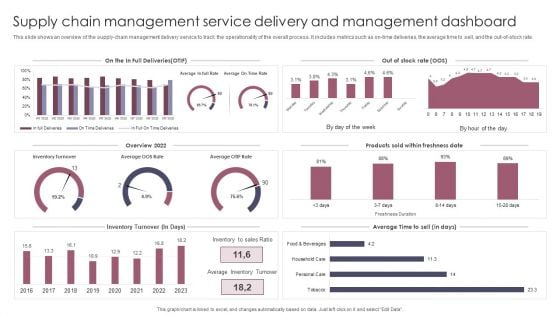
Supply Chain Management Service Delivery And Management Dashboard Guidelines PDF
This slide shows an overview of the supply chain management delivery service to track the operationality of the overall process. It includes metrics such as on time deliveries, the average time to sell, and the out of stock rate. Pitch your topic with ease and precision using this Supply Chain Management Service Delivery And Management Dashboard Guidelines PDF. This layout presents information on Supply Chain Management, Service Delivery, Management Dashboard. It is also available for immediate download and adjustment. So, changes can be made in the color, design, graphics or any other component to create a unique layout.
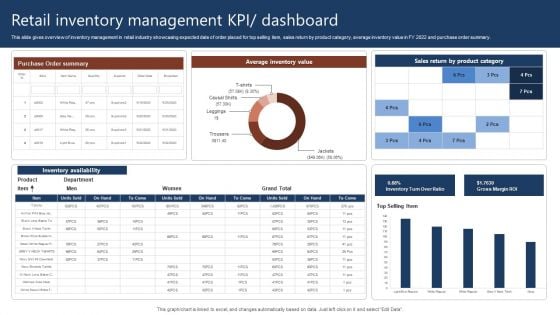
Retail Inventory Management Kpi Dashboard Rules PDF
This slide gives overview of inventory management in retail industry showcasing expected date of order placed for top selling item, sales return by product category, average inventory value in FY 2022 and purchase order summary. Pitch your topic with ease and precision using this Retail Inventory Management Kpi Dashboard Rules PDF. This layout presents information on Retail Inventory Management, Dashboard. It is also available for immediate download and adjustment. So, changes can be made in the color, design, graphics or any other component to create a unique layout.

 Home
Home