Bank Dashboard
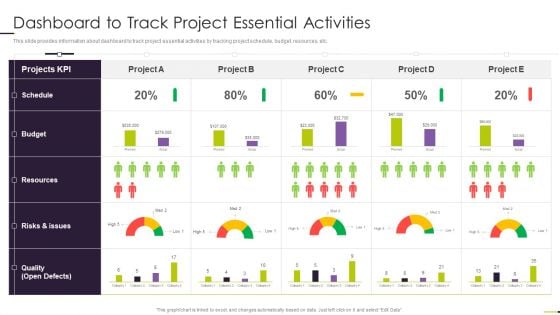
Managing Project Communication Dashboard To Track Project Essential Activities Structure PDF
This slide provides information about dashboard to track project essential activities by tracking project schedule, budget, resources, etc. Deliver an awe inspiring pitch with this creative Managing Project Communication Dashboard To Track Project Essential Activities Structure PDF bundle. Topics like Resources, Budget, Projects Kpi can be discussed with this completely editable template. It is available for immediate download depending on the needs and requirements of the user.
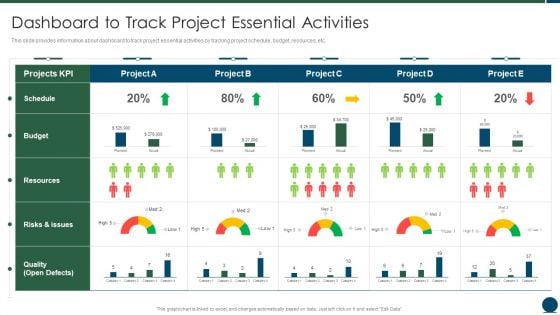
Project Scope Management Playbook Dashboard To Track Project Essential Activities Formats PDF
This slide provides information about dashboard to track project essential activities by tracking project schedule, budget, resources, etc. Deliver an awe inspiring pitch with this creative Project Scope Management Playbook Dashboard To Track Project Essential Activities Formats PDF bundle. Topics like Budget, Resources, Quality can be discussed with this completely editable template. It is available for immediate download depending on the needs and requirements of the user.

KPI Dashboard Showing Results Of Sales And Marketing Project Campaign Formats PDF
Following slide showcases performance KPI dashboard used to evaluate marketing project campaign results. The dashboard provides overview of key metrics such as total revenue, marketing spend, profit and cost per acquisition, leads etc. Showcasing this set of slides titled KPI Dashboard Showing Results Of Sales And Marketing Project Campaign Formats PDF. The topics addressed in these templates are Marketing Spend, Revenue, Profit Per Acquisition. All the content presented in this PPT design is completely editable. Download it and make adjustments in color, background, font etc. as per your unique business setting.
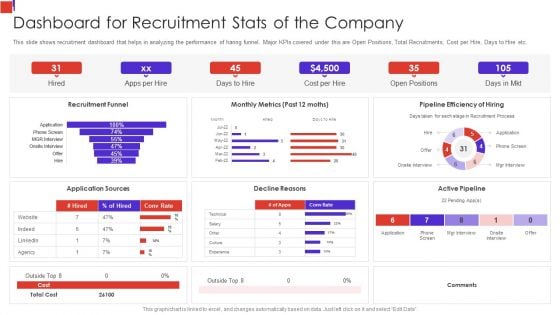
Outline Of Employee Recruitment Dashboard For Recruitment Stats Of The Company Formats PDF
This slide shows recruitment dashboard that helps in analyzing the performance of haring funnel. Major KPIs covered under this are Open Positions, Total Recruitments, Cost per Hire, Days to Hire etc.Deliver and pitch your topic in the best possible manner with this Outline Of Employee Recruitment Dashboard For Recruitment Stats Of The Company Formats PDF Use them to share invaluable insights on Dashboard For Recruitment, Stats Of The Company, Decline Reasons and impress your audience. This template can be altered and modified as per your expectations. So, grab it now.

Inventory Overview Dashboard In Supply Chain Management To Enhance Logistics Operations Summary PDF
This slide showcases the inventory management dashboard. It include KPIs such as inventory value, re-order products, restocking cost, inventory value by vendor, item name, last order date, warehouse, etc. Showcasing this set of slides titled Inventory Overview Dashboard In Supply Chain Management To Enhance Logistics Operations Summary PDF. The topics addressed in these templates are Inventory Overview Dashboard, Supply Chain Management, Enhance Logistics Operations. All the content presented in this PPT design is completely editable. Download it and make adjustments in color, background, font etc. as per your unique business setting.
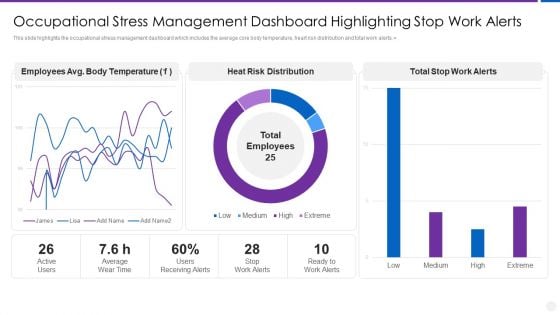
Organization Stress Administration Practices Occupational Stress Management Dashboard Highlighting Graphics PDF
This slide highlights the occupational stress management dashboard which includes the average core body temperature, heart risk distribution and total work alerts.Deliver and pitch your topic in the best possible manner with this Organization Stress Administration Practices Occupational Stress Management Dashboard Highlighting Graphics PDF Use them to share invaluable insights on Invest In Technology, Outcome Based, Clear Expectations and impress your audience. This template can be altered and modified as per your expectations. So, grab it now.
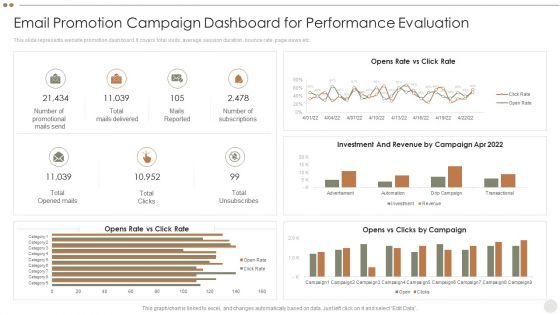
Online Promotional Techniques To Increase Email Promotion Campaign Dashboard For Performance Evaluation Themes PDF
This slide represents website promotion dashboard. It covers total visits, average session duration, bounce rate, page views etc.Deliver and pitch your topic in the best possible manner with this Online Promotional Techniques To Increase Email Promotion Campaign Dashboard For Performance Evaluation Themes PDF. Use them to share invaluable insights on Mails Reported, Total Opened, Investment Revenue and impress your audience. This template can be altered and modified as per your expectations. So, grab it now.
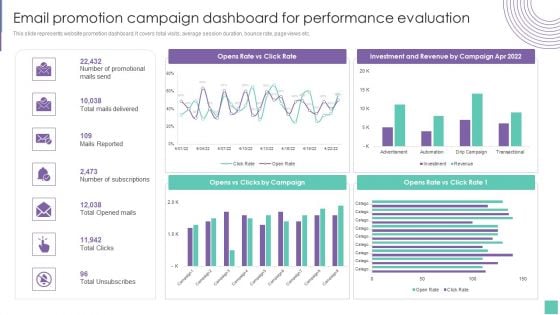
Email Promotion Campaign Dashboard For Performance Evaluation Introduce Promotion Plan To Enhance Formats PDF
This slide represents website promotion dashboard. It covers total visits, average session duration, bounce rate, page views etc.Deliver and pitch your topic in the best possible manner with this Email Promotion Campaign Dashboard For Performance Evaluation Introduce Promotion Plan To Enhance Formats PDF. Use them to share invaluable insights on Investment Revenue, Clicks Campaign, Mails Delivered and impress your audience. This template can be altered and modified as per your expectations. So, grab it now.
Playbook For Lean Agile Project Administration Agile Project Management Activities Tracking Dashboard Introduction PDF
This slide provides information regarding the dashboard which will help team in managing different activities associated to agile projects and keep track on the time, task summary, etc. Deliver an awe inspiring pitch with this creative Playbook For Lean Agile Project Administration Agile Project Management Activities Tracking Dashboard Introduction PDF bundle. Topics like Activities Tracking Dashboard, Agile Project Management, Summary By Resources can be discussed with this completely editable template. It is available for immediate download depending on the needs and requirements of the user.
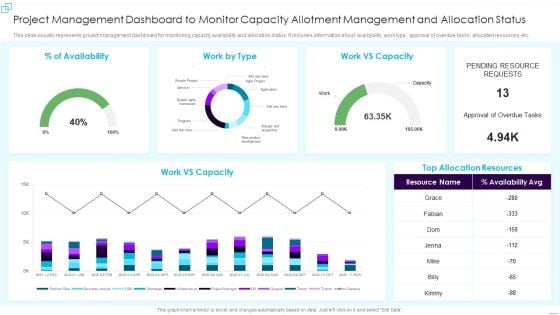
Project Management Dashboard To Monitor Capacity Allotment Management And Allocation Status Background PDF
This slide visually represents project management dashboard for monitoring capacity availability and allocation status. It includes information about availability, work type, approval of overdue tasks, allocated resources, etc. Showcasing this set of slides titled Project Management Dashboard To Monitor Capacity Allotment Management And Allocation Status Background PDF. The topics addressed in these templates are Capacity Allotment Management, Project Management Dashboard. All the content presented in this PPT design is completely editable. Download it and make adjustments in color, background, font etc. as per your unique business setting.
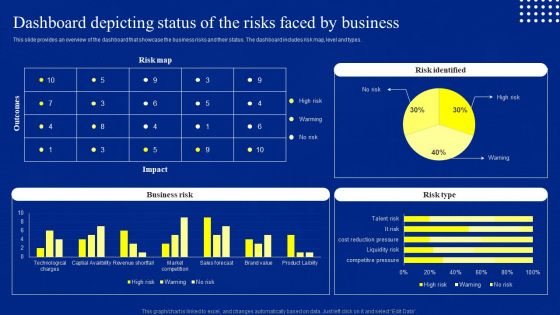
Risk Control And Surveillance Dashboard Depicting Status Of The Risks Faced By Business Elements PDF
This slide provides an overview of the dashboard that showcase the business risks and their status. The dashboard includes risk map, level and types. The best PPT templates are a great way to save time, energy, and resources. Slidegeeks have 100 percent editable powerpoint slides making them incredibly versatile. With these quality presentation templates, you can create a captivating and memorable presentation by combining visually appealing slides and effectively communicating your message. Download Risk Control And Surveillance Dashboard Depicting Status Of The Risks Faced By Business Elements PDF from Slidegeeks and deliver a wonderful presentation.
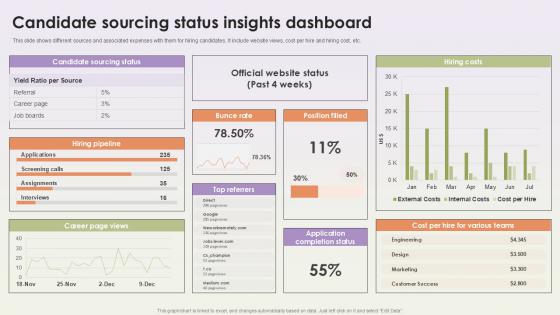
Candidate Sourcing Status Insights Dashboard Workforce Procurement And Aptitude Evaluation Ppt Sample
This slide shows different sources and associated expenses with them for hiring candidates. It include website views, cost per hire and hiring cost, etc. Slidegeeks is one of the best resources for PowerPoint templates. You can download easily and regulate Candidate Sourcing Status Insights Dashboard Workforce Procurement And Aptitude Evaluation Ppt Sample for your personal presentations from our wonderful collection. A few clicks is all it takes to discover and get the most relevant and appropriate templates. Use our Templates to add a unique zing and appeal to your presentation and meetings. All the slides are easy to edit and you can use them even for advertisement purposes. This slide shows different sources and associated expenses with them for hiring candidates. It include website views, cost per hire and hiring cost, etc.
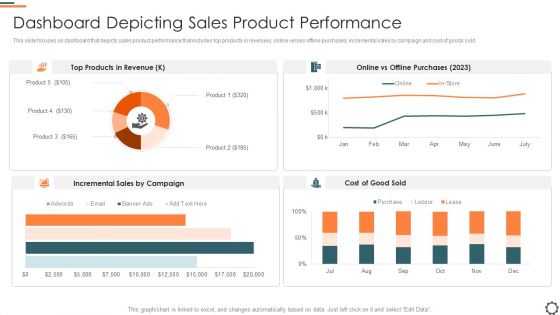
Agile Group For Product Development Dashboard Depicting Sales Product Performance Pictures PDF
This slide focuses on dashboard that depicts sales product performance that includes top products in revenues, online verses offline purchases, incremental sales by campaign and cost of goods sold. Deliver and pitch your topic in the best possible manner with this agile group for product development dashboard depicting sales product performance pictures pdf. Use them to share invaluable insights on dashboard depicting sales product performance and impress your audience. This template can be altered and modified as per your expectations. So, grab it now.
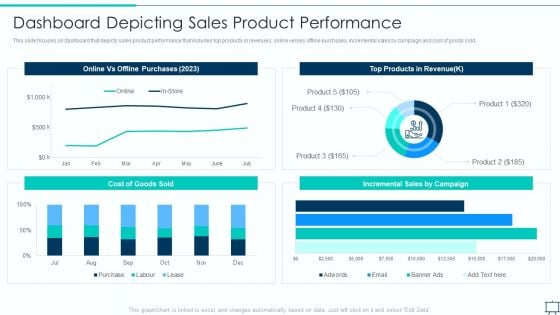
Formulating Competitive Plan Of Action For Effective Product Leadership Dashboard Depicting Sales Topics PDF
This slide focuses on dashboard that depicts sales product performance that includes top products in revenues, online verses offline purchases, incremental sales by campaign and cost of goods sold. Deliver and pitch your topic in the best possible manner with this formulating competitive plan of action for effective product leadership dashboard depicting sales topics pdf. Use them to share invaluable insights on dashboard depicting sales product performance and impress your audience. This template can be altered and modified as per your expectations. So, grab it now.
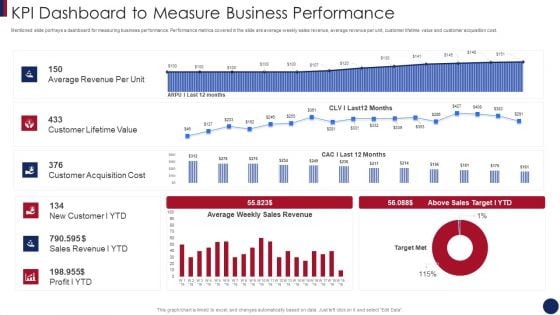
Post Merger Information Technology Service Delivery Amalgamation KPI Dashboard To Measure Business Template PDF
Mentioned slide portrays a dashboard for measuring business performance. Performance metrics covered in the slide are average weekly sales revenue, average revenue per unit, customer lifetime value and customer acquisition cost. Deliver an awe inspiring pitch with this creative post merger information technology service delivery amalgamation kpi dashboard to measure business template pdf bundle. Topics like kpi dashboard to measure business performance can be discussed with this completely editable template. It is available for immediate download depending on the needs and requirements of the user.

New Product Sales Strategy And Marketing KPI Dashboard To Monitor Sales Performance Information PDF
This slide shows sales performance monitoring dashboard. Metrics included in the dashboard are sales revenue, sales growth, average revenue per unit, customer lifetime value and customer acquisition cost. Deliver an awe inspiring pitch with this creative New Product Sales Strategy And Marketing KPI Dashboard To Monitor Sales Performance Information PDF bundle. Topics like Sales Revenue, Monthly Sales Growth, Sales Country Performance can be discussed with this completely editable template. It is available for immediate download depending on the needs and requirements of the user.
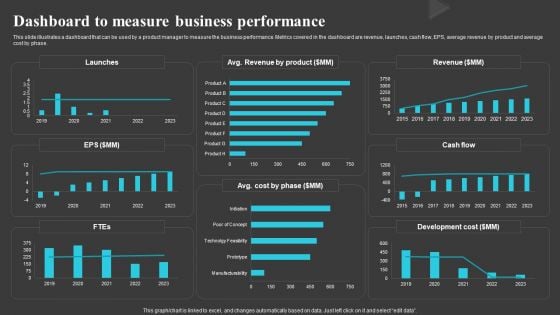
Dashboard To Measure Business Performance Creating And Offering Multiple Product Ranges In New Business Introduction PDF
This slide illustrates a dashboard that can be used by a product manager to measure the business performance. Metrics covered in the dashboard are revenue, launches, cash flow, EPS, average revenue by product and average cost by phase.There are so many reasons you need a Dashboard To Measure Business Performance Creating And Offering Multiple Product Ranges In New Business Introduction PDF. The first reason is you can notspend time making everything from scratch, Thus, Slidegeeks has made presentation templates for you too. You can easily download these templates from our website easily.
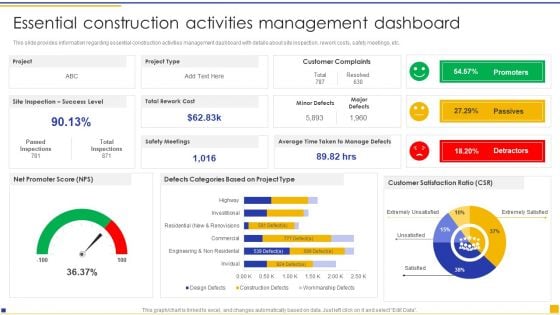
Construction Project Instructions Playbook Essential Construction Activities Management Dashboard Graphics PDF
This slide provides information regarding essential construction activities management dashboard with details about site inspection, rework costs, safety meetings, etc. Crafting an eye catching presentation has never been more straightforward. Let your presentation shine with this tasteful yet straightforward Construction Project Instructions Playbook Essential Construction Activities Management Dashboard Graphics PDF template. It offers a minimalistic and classy look that is great for making a statement. The colors have been employed intelligently to add a bit of playfulness while still remaining professional. Construct the ideal Construction Project Instructions Playbook Essential Construction Activities Management Dashboard Graphics PDF that effortlessly grabs the attention of your audience Begin now and be certain to wow your customers.
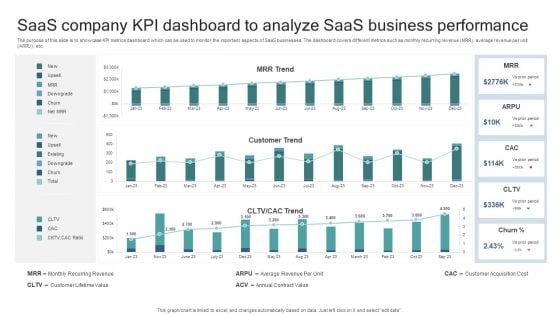
Saas Company KPI Dashboard To Analyze Saas Business Performance Elements PDF
The purpose of this slide is to showcase KPI metrics dashboard which can be used to monitor the important aspects of SaaS businesses. The dashboard covers different metrics such as monthly recurring revenue MRR, average revenue per unit ARPU, etc. Pitch your topic with ease and precision using this Saas Company KPI Dashboard To Analyze Saas Business Performance Elements PDF. This layout presents information on Monthly Recurring Revenue, Customer Lifetime Value, Average Revenue Per Unit, Annual Contract Value, Customer Acquisition Cost. It is also available for immediate download and adjustment. So, changes can be made in the color, design, graphics or any other component to create a unique layout.
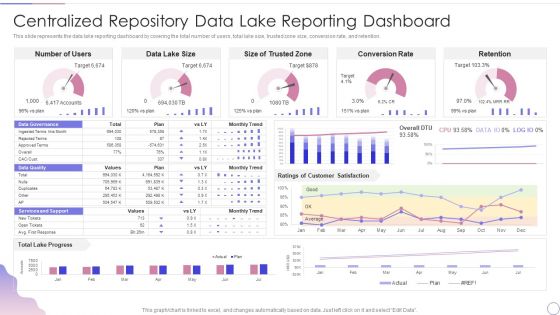
Data Lake Architecture Future Of Data Analysis Centralized Repository Data Lake Reporting Dashboard Elements PDF
This slide represents the data lake reporting dashboard by covering the total number of users, total lake size, trusted zone size, conversion rate, and retention.Deliver an awe inspiring pitch with this creative Data Lake Architecture Future Of Data Analysis Centralized Repository Data Lake Reporting Dashboard Elements PDF bundle. Topics like Data Governance, Conversion Rate, Retention can be discussed with this completely editable template. It is available for immediate download depending on the needs and requirements of the user.
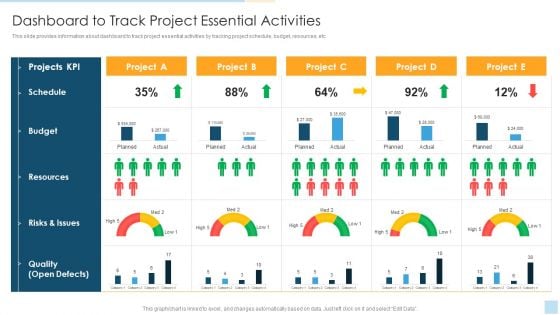
Task Management For Successful Project Delivery Dashboard To Track Project Essential Activities Pictures PDF
This slide provides information about dashboard to track project essential activities by tracking project schedule, budget, resources, etc. Deliver and pitch your topic in the best possible manner with this Task Management For Successful Project Delivery Dashboard To Track Project Essential Activities Pictures PDF Use them to share invaluable insights on Resources, Qualit Defects, Resources and impress your audience. This template can be altered and modified as per your expectations. So, grab it now.
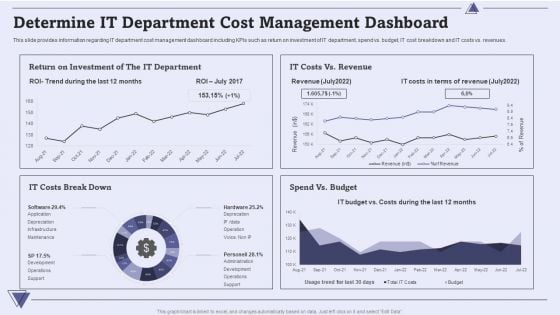
CIO For IT Cost Optimization Techniques Determine IT Department Cost Management Dashboard Introduction PDF
This slide provides information regarding IT department cost management dashboard including KPIs such as return on investment of IT department, spend vs. budget, IT cost breakdown and IT costs vs. revenues. Deliver and pitch your topic in the best possible manner with this CIO For IT Cost Optimization Techniques Determine IT Department Cost Management Dashboard Introduction PDF. Use them to share invaluable insights on Costs, Budget, Revenue and impress your audience. This template can be altered and modified as per your expectations. So, grab it now.
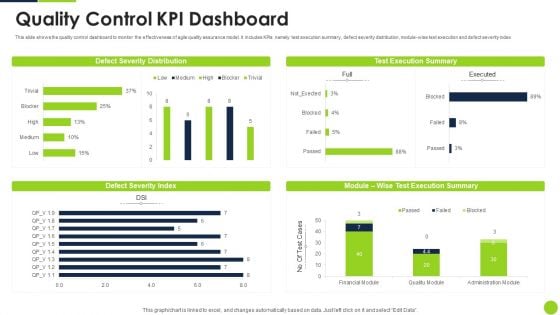
Agile Methodology Quality Control Quality Control KPI Dashboard Ppt Infographic Template Layout Ideas PDF
This slide shows the quality control dashboard to monitor the effectiveness of agile quality assurance model. It includes KPIs namely test execution summary, defect severity distribution, module-wise text execution and defect severity index Deliver an awe inspiring pitch with this creative agile methodology quality control quality control kpi dashboard ppt infographic template layout ideas pdf bundle. Topics like quality control kpi dashboard can be discussed with this completely editable template. It is available for immediate download depending on the needs and requirements of the user.
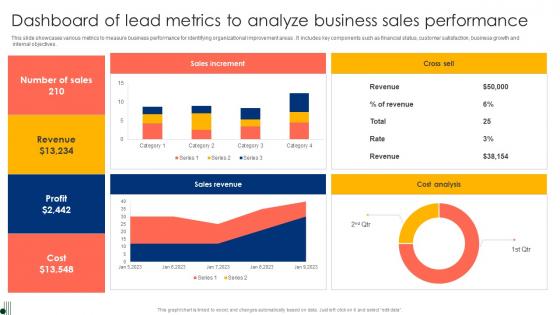
Dashboard Of Lead Metrics To Analyze Business Sales Performance Ppt Summary Graphics Pdf
This slide showcases various metrics to measure business performance for identifying organizational improvement areas. It includes key components such as financial status, customer satisfaction, business growth and internal objectives. Showcasing this set of slides titled Dashboard Of Lead Metrics To Analyze Business Sales Performance Ppt Summary Graphics Pdf. The topics addressed in these templates are Sales Increment, Cross Sell, Cost Analysis. All the content presented in this PPT design is completely editable. Download it and make adjustments in color, background, font etc. as per your unique business setting. This slide showcases various metrics to measure business performance for identifying organizational improvement areas. It includes key components such as financial status, customer satisfaction, business growth and internal objectives.
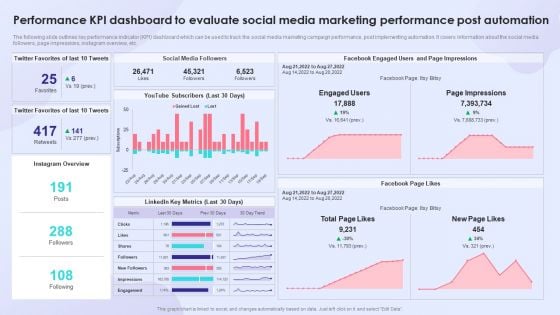
Performance KPI Dashboard To Evaluate Social Media Marketing Performance Post Automation Themes PDF
The following slide outlines key performance indicator KPI dashboard which can be used to track the social media marketing campaign performance, post implementing automation. It covers information about the social media followers, page impressions, instagram overview, etc. Deliver and pitch your topic in the best possible manner with this Performance KPI Dashboard To Evaluate Social Media Marketing Performance Post Automation Themes PDF. Use them to share invaluable insights on Social Media Followers, Linkedin Key Metrics, Performance KPI Dashboard and impress your audience. This template can be altered and modified as per your expectations. So, grab it now.
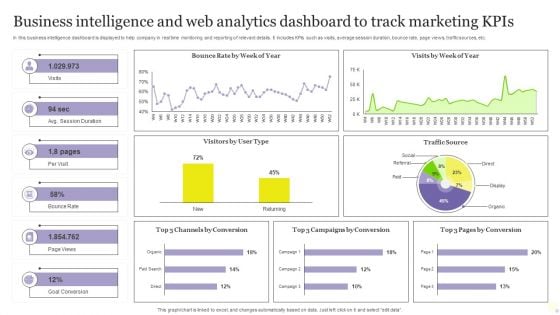
Business Intelligence And Web Analytics Dashboard To Track Marketing Kpis Inspiration PDF
In this business intelligence dashboard is displayed to help company in real time monitoring and reporting of relevant details. It includes KPIs such as visits, average session duration, bounce rate, page views, traffic sources, etc. Showcasing this set of slides titled Business Intelligence And Web Analytics Dashboard To Track Marketing Kpis Inspiration PDF. The topics addressed in these templates are Goal Conversion, Track Marketing Kpis, Web Analytics Dashboard. All the content presented in this PPT design is completely editable. Download it and make adjustments in color, background, font etc. as per your unique business setting.
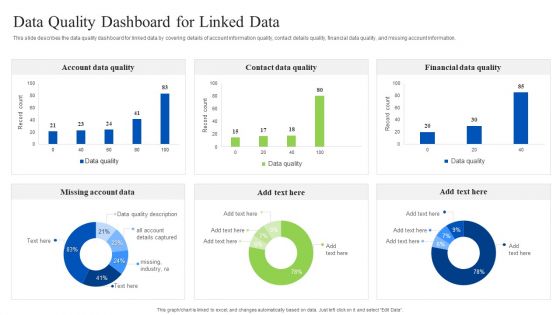
Linked Data Visualization Data Quality Dashboard For Linked Data Pictures PDF
This slide describes the data quality dashboard for linked data by covering details of account information quality, contact details quality, financial data quality, and missing account information. Create an editable Linked Data Visualization Data Quality Dashboard For Linked Data Pictures PDF that communicates your idea and engages your audience. Whether youre presenting a business or an educational presentation, pre-designed presentation templates help save time. Linked Data Visualization Data Quality Dashboard For Linked Data Pictures PDF is highly customizable and very easy to edit, covering many different styles from creative to business presentations. Slidegeeks has creative team members who have crafted amazing templates. So, go and get them without any delay.
Project Resource Levelling And Budget Allocation Dashboard Ppt PowerPoint Presentation Layouts Icons PDF
This slide defines the dashboard for analyzing the resources and allocating the budget. It includes information related to the project budget, budget analysis and levelling resources. Showcasing this set of slides titled Project Resource Levelling And Budget Allocation Dashboard Ppt PowerPoint Presentation Layouts Icons PDF. The topics addressed in these templates are Project Budget, Key Members, Budget Analysis. All the content presented in this PPT design is completely editable. Download it and make adjustments in color, background, font etc. as per your unique business setting.
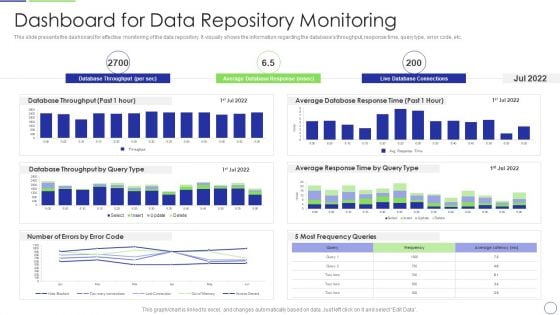
Developing Organization Primary Data Storage Action Plan Dashboard For Data Repository Monitoring Information PDF
This slide presents the dashboard for effective monitoring of the data repository. It visually shows the information regarding the databases throughput, response time, query type, error code, etc. Deliver and pitch your topic in the best possible manner with this developing organization primary data storage action plan dashboard for data repository monitoring information pdf. Use them to share invaluable insights on dashboard for data repository monitoring and impress your audience. This template can be altered and modified as per your expectations. So, grab it now.
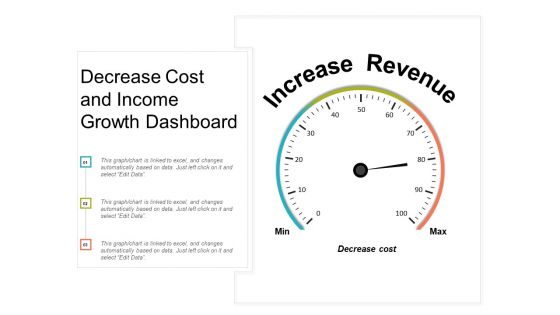
Decrease Cost And Income Growth Dashboard Ppt PowerPoint Presentation Inspiration Guide
This is a decrease cost and income growth dashboard ppt powerpoint presentation inspiration guide. This is a three stage process. The stages in this process are growth, increase sales, increase revenue.
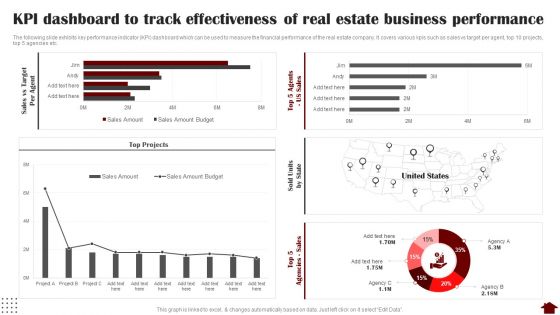
KPI Dashboard To Track Effectiveness Of Real Estate Business Performance Slides PDF
The following slide exhibits key performance indicator KPI dashboard which can be used to measure the financial performance of the real estate company. It covers various kpis such as sales vs target per agent, top 10 projects, top 5 agencies etc. Deliver an awe inspiring pitch with this creative KPI Dashboard To Track Effectiveness Of Real Estate Business Performance Slides PDF bundle. Topics like KPI Dashboard, Track Effectiveness, Real Estate Business Performance can be discussed with this completely editable template. It is available for immediate download depending on the needs and requirements of the user.
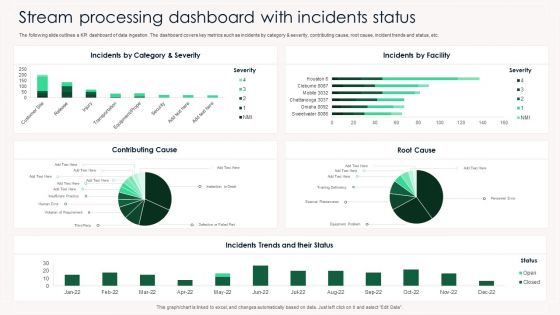
Stream Processing Dashboard With Incidents Status Ppt PowerPoint Presentation Gallery Portrait PDF
The following slide outlines a KPI dashboard of data ingestion. The dashboard covers key metrics such as incidents by category and severity, contributing cause, root cause, incident trends and status, etc. Showcasing this set of slides titled Stream Processing Dashboard With Incidents Status Ppt PowerPoint Presentation Gallery Portrait PDF. The topics addressed in these templates are Incidens, Category And Severity, Incidents By Facility, Contributing Cause. All the content presented in this PPT design is completely editable. Download it and make adjustments in color, background, font etc. as per your unique business setting.
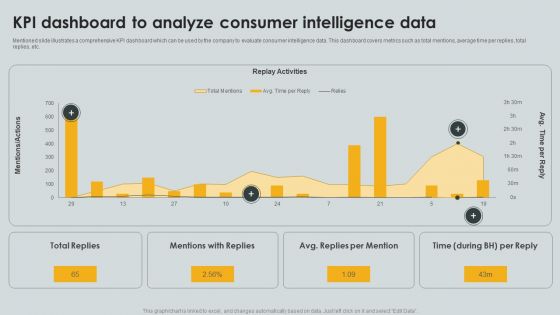
KPI Dashboard To Analyze Consumer Intelligence Data Ppt PowerPoint Presentation File Portfolio PDF
Mentioned slide illustrates a comprehensive KPI dashboard which can be used by the company to evaluate consumer intelligence data. This dashboard covers metrics such as total mentions, average time per replies, total replies, etc. Pitch your topic with ease and precision using this KPI Dashboard To Analyze Consumer Intelligence Data Ppt PowerPoint Presentation File Portfolio PDF. This layout presents information on Replay Activities, Total Replies, Mentions Replies. It is also available for immediate download and adjustment. So, changes can be made in the color, design, graphics or any other component to create a unique layout.
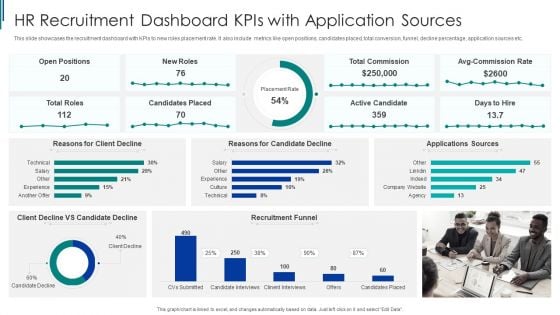
HR Recruitment Dashboard Kpis With Application Sources Ppt Pictures Styles PDF
This slide showcases the recruitment dashboard with KPIs to new roles placement rate. It also include metrics like open positions, candidates placed, total conversion, funnel, decline percentage, application sources etc. Pitch your topic with ease and precision using this HR Recruitment Dashboard Kpis With Application Sources Ppt Pictures Styles PDF. This layout presents information on Recruitment Funnel, HR Recruitment, Dashboard Kpis. It is also available for immediate download and adjustment. So, changes can be made in the color, design, graphics or any other component to create a unique layout.
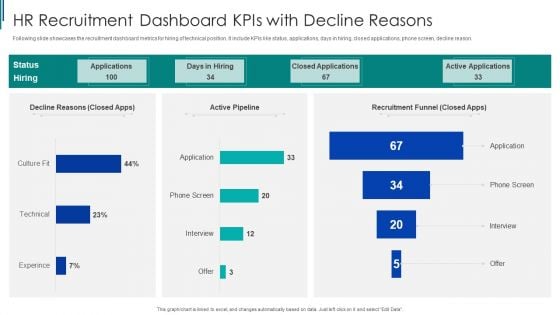
HR Recruitment Dashboard Kpis With Decline Reasons Ppt Pictures Example Introduction PDF
Following slide showcases the recruitment dashboard metrics for hiring of technical position. It include KPIs like status, applications, days in hiring, closed applications, phone screen, decline reason. Showcasing this set of slides titled HR Recruitment Dashboard Kpis With Decline Reasons Ppt Pictures Example Introduction PDF. The topics addressed in these templates are Recruitment Funnel, HR Recruitment, Dashboard Kpis. All the content presented in this PPT design is completely editable. Download it and make adjustments in color, background, font etc. as per your unique business setting.
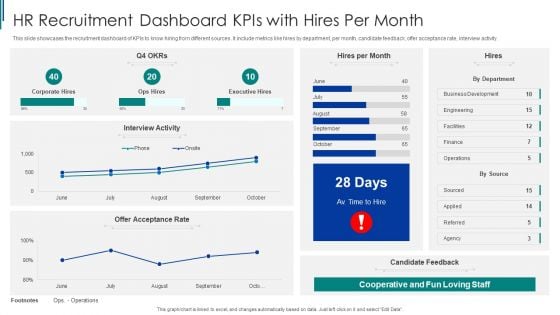
HR Recruitment Dashboard Kpis With Hires Per Month Ppt Slides Portfolio PDF
This slide showcases the recruitment dashboard of KPIs to know hiring from different sources. It include metrics like hires by department, per month, candidate feedback, offer acceptance rate, interview activity. Pitch your topic with ease and precision using this HR Recruitment Dashboard Kpis With Hires Per Month Ppt Slides Portfolio PDF. This layout presents information on HR Recruitment, Dashboard Kpis, Business Development. It is also available for immediate download and adjustment. So, changes can be made in the color, design, graphics or any other component to create a unique layout.
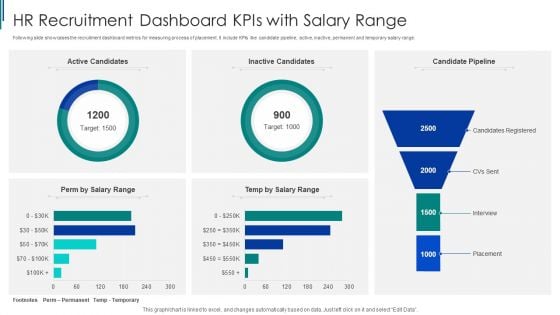
HR Recruitment Dashboard Kpis With Salary Range Ppt Inspiration Rules PDF
Following slide showcases the recruitment dashboard metrics for measuring process of placement. It include KPIs like candidate pipeline, active, inactive, permanent and temporary salary range. Pitch your topic with ease and precision using this HR Recruitment Dashboard Kpis With Salary Range Ppt Inspiration Rules PDF. This layout presents information on HR Recruitment, Dashboard Kpis, Salary Range. It is also available for immediate download and adjustment. So, changes can be made in the color, design, graphics or any other component to create a unique layout.
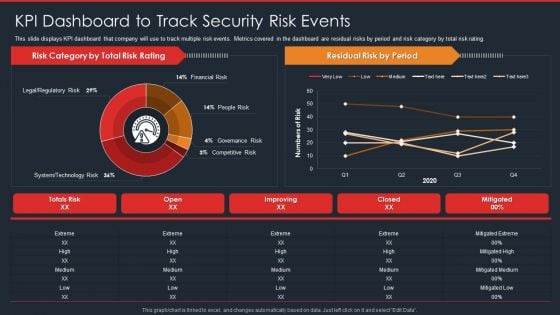
Data Safety Initiatives KPI Dashboard To Track Security Risk Events Portrait PDF
This slide displays KPI dashboard that company will use to track multiple risk events. Metrics covered in the dashboard are residual risks by period and risk category by total risk rating. Deliver and pitch your topic in the best possible manner with this data safety initiatives kpi dashboard to track security risk events portrait pdf. Use them to share invaluable insights on risk category, total risk rating, residual risk by period, technology risk and impress your audience. This template can be altered and modified as per your expectations. So, grab it now.
Youtube Marketing Dashboard Highlighting Traffic Source And Average Views Icons PDF
This slide showcases the youtube marketing dashboard which includes subscriber gained vs loss list which includes traffic sources and lasted uploaded videos data.Create an editable Youtube Marketing Dashboard Highlighting Traffic Source And Average Views Icons PDF that communicates your idea and engages your audience. Whether you are presenting a business or an educational presentation, pre-designed presentation templates help save time. Youtube Marketing Dashboard Highlighting Traffic Source And Average Views Icons PDF is highly customizable and very easy to edit, covering many different styles from creative to business presentations. Slidegeeks has creative team members who have crafted amazing templates. So, go and get them without any delay.
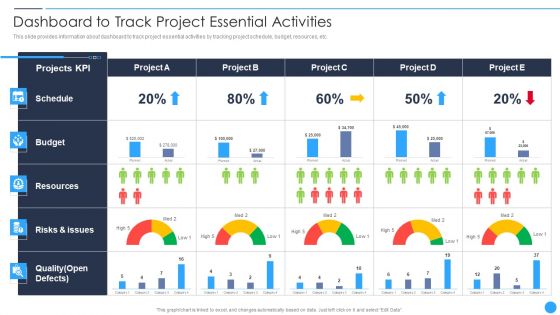
Playbook For Project Product Administration Dashboard To Track Project Essential Activities Pictures PDF
This slide provides information about dashboard to track project essential activities by tracking project schedule, budget, resources, etc. Deliver an awe inspiring pitch with this creative Playbook For Project Product Administration Dashboard To Track Project Essential Activities Pictures PDF bundle. Topics like Resources, Quality Defects, Risks Issues can be discussed with this completely editable template. It is available for immediate download depending on the needs and requirements of the user.
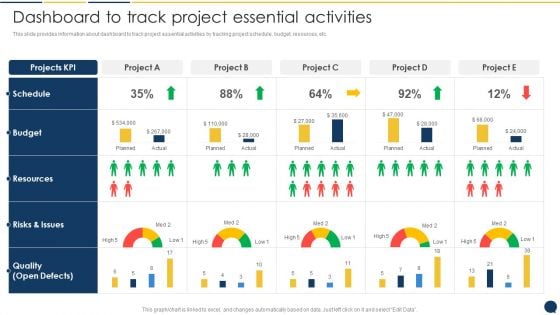
Stakeholder Communication Program Dashboard To Track Project Essential Activities Topics PDF
This slide provides information about dashboard to track project essential activities by tracking project schedule, budget, resources, etc.Deliver an awe inspiring pitch with this creative Stakeholder Communication Program Dashboard To Track Project Essential Activities Topics PDF bundle. Topics like Resources, Risks And Issues, Open Defects can be discussed with this completely editable template. It is available for immediate download depending on the needs and requirements of the user.
Integration Of Digital Technology In Organization Business Transformation Dashboard Icons PDF
This slide covers transformation dashboard covering various stages of a business along with the budget and risks involved at every stage.Deliver and pitch your topic in the best possible manner with this Integration Of Digital Technology In Organization Business Transformation Dashboard Icons PDF Use them to share invaluable insights on Discovery Or Visioning, Resources Availability, Mobilization Of Resources and impress your audience. This template can be altered and modified as per your expectations. So, grab it now.
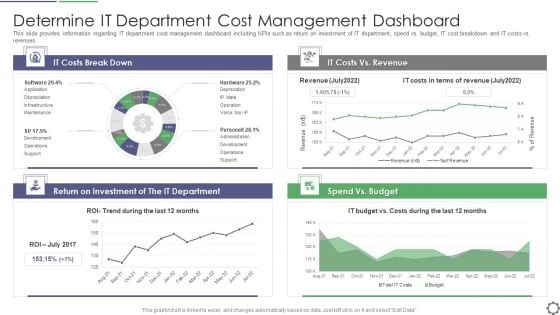
Determine IT Department Cost Management Dashboard Ppt PowerPoint Presentation Gallery Outline PDF
This slide provides information regarding IT department cost management dashboard including KPIs such as return on investment of IT department, spend vs. budget, IT cost breakdown and IT costs vs. revenues. Deliver an awe inspiring pitch with this creative determine it department cost management dashboard ppt powerpoint presentation gallery outline pdf bundle. Topics like it costs break down, it costs vs revenue, spend vs budget, return on investment can be discussed with this completely editable template. It is available for immediate download depending on the needs and requirements of the user.
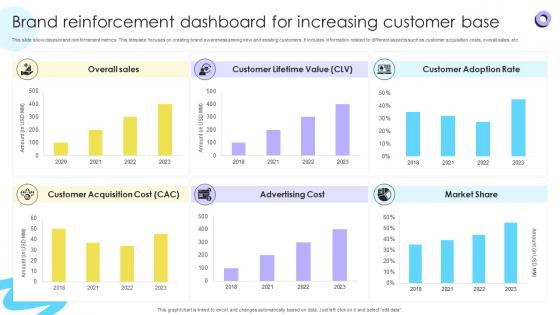
Brand Reinforcement Dashboard For Increasing Encouraging Repetitive Customer Purchase Ppt Presentation
This slide showcases brand reinforcement metrics. This template focuses on creating brand awareness among new and existing customers. It includes information related to different aspects such as customer acquisition costs, overall sales, etc. Slidegeeks is one of the best resources for PowerPoint templates. You can download easily and regulate Brand Reinforcement Dashboard For Increasing Encouraging Repetitive Customer Purchase Ppt Presentation for your personal presentations from our wonderful collection. A few clicks is all it takes to discover and get the most relevant and appropriate templates. Use our Templates to add a unique zing and appeal to your presentation and meetings. All the slides are easy to edit and you can use them even for advertisement purposes. This slide showcases brand reinforcement metrics. This template focuses on creating brand awareness among new and existing customers. It includes information related to different aspects such as customer acquisition costs, overall sales, etc.
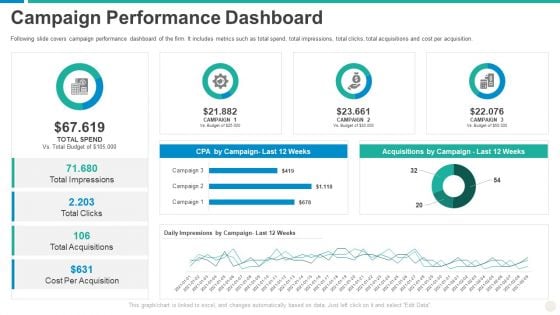
Establishing Successful Brand Strategy To Captivate Consumers Campaign Performance Dashboard Background PDF
Following slide covers campaign performance dashboard of the firm. It includes metrics such as total spend, total impressions, total clicks, total acquisitions and cost per acquisition. Deliver and pitch your topic in the best possible manner with this establishing successful brand strategy to captivate consumers campaign performance dashboard background pdf. Use them to share invaluable insights on campaign, acquisitions, budget, cost and impress your audience. This template can be altered and modified as per your expectations. So, grab it now.
Sales Training Playbook Determine Workforce Training Performance Tracking Dashboard Pictures PDF
This slide provides information regarding workforce training performance tracking dashboard with training cost, number of participants, hours of training, etc. Deliver an awe inspiring pitch with this creative sales training playbook determine workforce training performance tracking dashboard pictures pdf bundle. Topics like budget, cost can be discussed with this completely editable template. It is available for immediate download depending on the needs and requirements of the user.
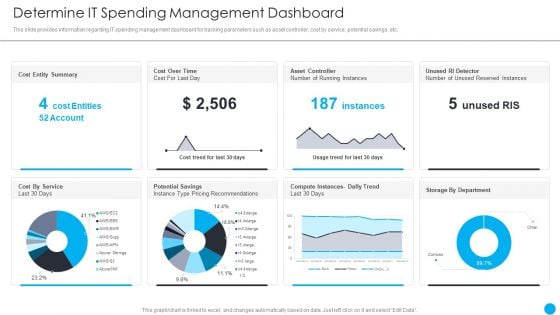
Cios Methodologies To Improve IT Spending Determine It Spending Management Dashboard Professional PDF
This slide provides information regarding IT spending management dashboard for tracking parameters such as asset controller, cost by service, potential savings, etc. Deliver and pitch your topic in the best possible manner with this Cios Methodologies To Improve IT Spending Determine It Spending Management Dashboard Professional PDF Use them to share invaluable insights on Allocated Budget, Across Portfolios, Estimated Cost and impress your audience. This template can be altered and modified as per your expectations. So, grab it now.
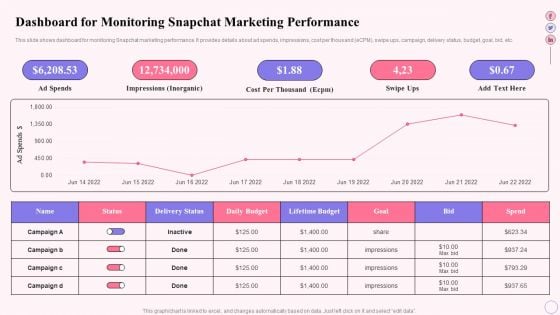
Integrating Social Media Tactics Dashboard For Monitoring Snapchat Marketing Elements PDF
This slide shows dashboard for monitoring Snapchat marketing performance. It provides details about ad spends, impressions, cost per thousand eCPM, swipe ups, campaign, delivery status, budget, goal, bid, etc. Deliver an awe inspiring pitch with this creative Integrating Social Media Tactics Dashboard For Monitoring Snapchat Marketing Elements PDF bundle. Topics like Cost Per Thousand, Swipe Ups, Ad Spends can be discussed with this completely editable template. It is available for immediate download depending on the needs and requirements of the user.
Marketers Guide To Data Analysis Optimization KPI Dashboard For Tracking Email Marketing Campaign Infographics PDF
This slide covers the dashboard for analyzing email marketing metrics such as overall open rate, click-through rate, click-to-open ratio, unsubscribe rate, hard bounce rate, soft rate, monthly open rate, total monthly subscribers, etc. Presenting this PowerPoint presentation, titled Marketers Guide To Data Analysis Optimization KPI Dashboard For Tracking Email Marketing Campaign Infographics PDF, with topics curated by our researchers after extensive research. This editable presentation is available for immediate download and provides attractive features when used. Download now and captivate your audience. Presenting this Marketers Guide To Data Analysis Optimization KPI Dashboard For Tracking Email Marketing Campaign Infographics PDF. Our researchers have carefully researched and created these slides with all aspects taken into consideration. This is a completely customizable Marketers Guide To Data Analysis Optimization KPI Dashboard For Tracking Email Marketing Campaign Infographics PDF that is available for immediate downloading. Download now and make an impact on your audience. Highlight the attractive features available with our PPTs.

KPI Analytics Dashboard With Sourcing Raw Material Cycle Time Inspiration PDF
Following slide shows the key performance indicator KPI dashboard which will assist corporates to effectively monitor procurement process. The metrics are number of suppliers, contract compliance, average procurement cycle time, etc. Showcasing this set of slides titled KPI Analytics Dashboard With Sourcing Raw Material Cycle Time Inspiration PDF. The topics addressed in these templates are Kpi Analytics Dashboard, Sourcing Raw Material, Cycle Time. All the content presented in this PPT design is completely editable. Download it and make adjustments in color, background, font etc. as per your unique business setting.
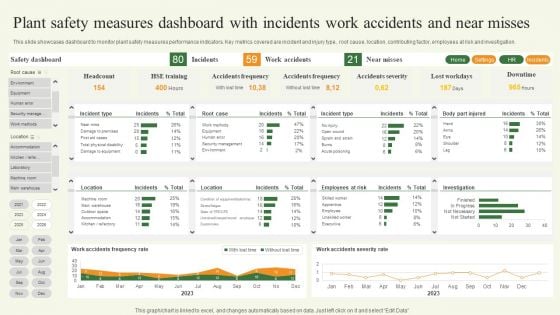
Plant Safety Measures Dashboard With Incidents Work Accidents And Near Misses Template PDF
This slide showcases dashboard to monitor plant safety measures performance indicators. Key metrics covered are incident and injury type, root cause, location, contributing factor, employees at risk and investigation. Pitch your topic with ease and precision using this Plant Safety Measures Dashboard With Incidents Work Accidents And Near Misses Template PDF. This layout presents information on Plant Safety Measures Dashboard, Incidents Work Accidents. It is also available for immediate download and adjustment. So, changes can be made in the color, design, graphics or any other component to create a unique layout.
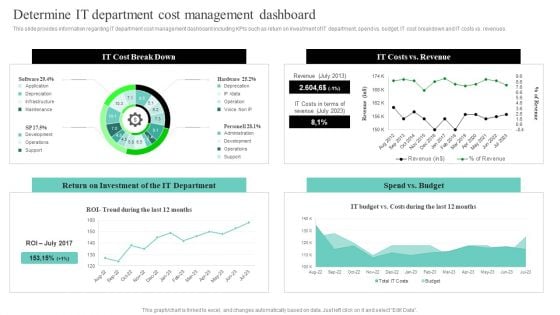
IT Cost Reduction Strategies Determine IT Department Cost Management Dashboard Guidelines PDF
This slide provides information regarding IT department cost management dashboard including KPIs such as return on investment of IT department, spend vs. budget, IT cost breakdown and IT costs vs. revenues. Get a simple yet stunning designed IT Cost Reduction Strategies Determine IT Department Cost Management Dashboard Guidelines PDF. It is the best one to establish the tone in your meetings. It is an excellent way to make your presentations highly effective. So, download this PPT today from Slidegeeks and see the positive impacts. Our easy-to-edit IT Cost Reduction Strategies Determine IT Department Cost Management Dashboard Guidelines PDF can be your go-to option for all upcoming conferences and meetings. So, what are you waiting for Grab this template today.
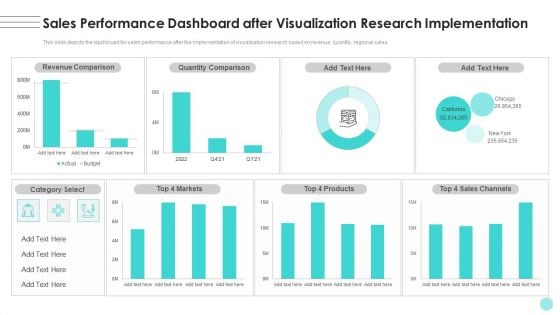
Branches For Visualization Research And Development Sales Performance Dashboard After Infographics PDF
This slide depicts the dashboard for sales performance after the implementation of visualization research based on revenue, quantity, regional sales. Crafting an eye-catching presentation has never been more straightforward. Let your presentation shine with this tasteful yet straightforward Branches For Visualization Research And Development Sales Performance Dashboard After Infographics PDF template. It offers a minimalistic and classy look that is great for making a statement. The colors have been employed intelligently to add a bit of playfulness while still remaining professional. Construct the ideal Branches For Visualization Research And Development Sales Performance Dashboard After Infographics PDF that effortlessly grabs the attention of your audience Begin now and be certain to wow your customers.
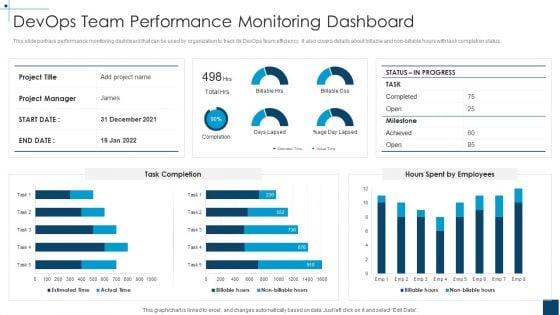
Devops Principles For Hybrid Cloud IT Devops Team Performance Monitoring Dashboard Infographics PDF
This slide portrays performance monitoring dashboard that can be used by organization to track its DevOps team efficiency. It also covers details about billable and non-billable hours with task completion status.Deliver and pitch your topic in the best possible manner with this devops principles for hybrid cloud it devops team performance monitoring dashboard infographics pdf Use them to share invaluable insights on devops team performance monitoring dashboard and impress your audience. This template can be altered and modified as per your expectations. So, grab it now.
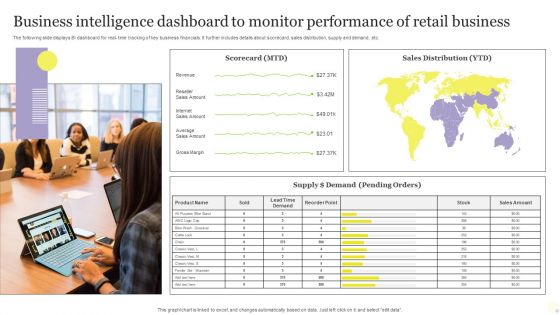
Business Intelligence Dashboard To Monitor Performance Of Retail Business Infographics PDF
The following slide displays BI dashboard for real time tracking of key business financials. It further includes details about scorecard, sales distribution, supply and demand, etc. Pitch your topic with ease and precision using this Business Intelligence Dashboard To Monitor Performance Of Retail Business Infographics PDF. This layout presents information on Business Intelligence Dashboard, Monitor Performance, Retail Business. It is also available for immediate download and adjustment. So, changes can be made in the color, design, graphics or any other component to create a unique layout.
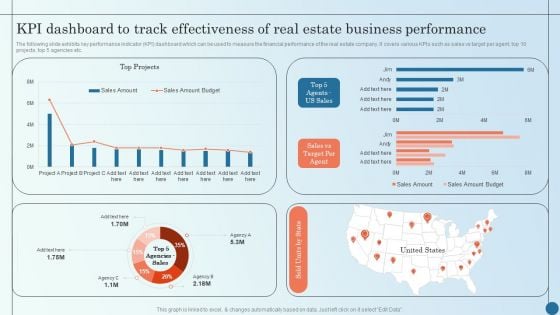
KPI Dashboard To Track Effectiveness Of Real Estate Business Managing Commercial Property Risks Demonstration PDF
The following slide exhibits key performance indicator KPI dashboard which can be used to measure the financial performance of the real estate company. It covers various KPIs such as sales vs target per agent, top 10 projects, top 5 agencies etc.Deliver an awe inspiring pitch with this creative KPI Dashboard To Track Effectiveness Of Real Estate Business Managing Commercial Property Risks Demonstration PDF bundle. Topics like Kpi Dashboard, Track Effectiveness, Estate Business can be discussed with this completely editable template. It is available for immediate download depending on the needs and requirements of the user.
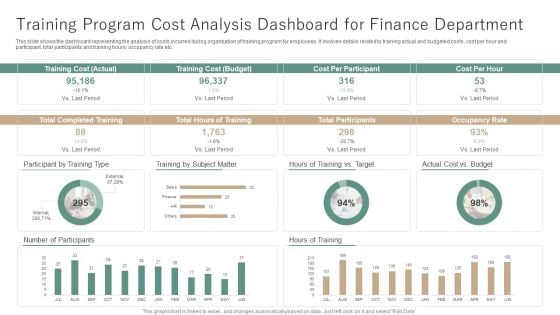
Training Program Cost Analysis Dashboard For Finance Department Ppt Example PDF
This slide shows the dashboard representing the analysis of costs incurred during organization of training program for employees. It involves details related to training actual and budgeted costs, cost per hour and participant, total participants and training hours, occupancy rate etc. Pitch your topic with ease and precision using this Training Program Cost Analysis Dashboard For Finance Department Ppt Example PDF. This layout presents information on Training Cost, Number Participants, Hours Of Training. It is also available for immediate download and adjustment. So, changes can be made in the color, design, graphics or any other component to create a unique layout.
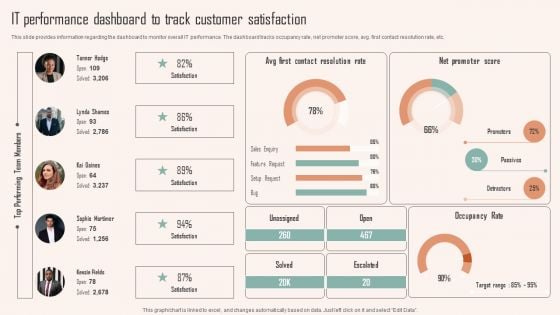
IT Performance Dashboard To Track Customer Satisfaction Ppt PowerPoint Presentation File Styles PDF
This slide provides information regarding the dashboard to monitor overall IT performance. The dashboard tracks occupancy rate, net promoter score, avg. first contact resolution rate, etc. The IT Performance Dashboard To Track Customer Satisfaction Ppt PowerPoint Presentation File Styles PDF is a compilation of the most recent design trends as a series of slides. It is suitable for any subject or industry presentation, containing attractive visuals and photo spots for businesses to clearly express their messages. This template contains a variety of slides for the user to input data, such as structures to contrast two elements, bullet points, and slides for written information. Slidegeeks is prepared to create an impression.
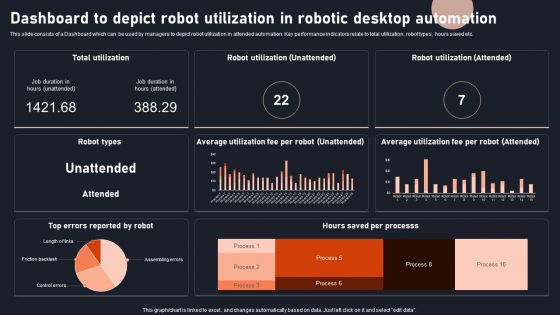
Dashboard To Depict Robot Utilization In Robotic Desktop Automation Download PDF
This slide consists of a Dashboard which can be used by managers to depict robot utilization in attended automation. Key performance indicators relate to total utilization, robot types, hours saved etc. Pitch your topic with ease and precision using this Dashboard To Depict Robot Utilization In Robotic Desktop Automation Download PDF. This layout presents information on Dashboard, Depict Robot Utilization, Robotic Desktop Automation. It is also available for immediate download and adjustment. So, changes can be made in the color, design, graphics or any other component to create a unique layout.
Buzz Marketing Strategies For Brand Promotion Dashboard For Tracking Marketing Activities At Designs PDF
This slide covers information regarding the dashboard for tracking essential marketing activities at social media platform in terms of social traffic and conversion, referral traffic by site, key social media metrics. Deliver an awe inspiring pitch with this creative buzz marketing strategies for brand promotion dashboard for tracking marketing activities at designs pdf bundle. Topics like dashboard for tracking marketing activities at social media platform can be discussed with this completely editable template. It is available for immediate download depending on the needs and requirements of the user.


 Continue with Email

 Home
Home


