Bank Presentation
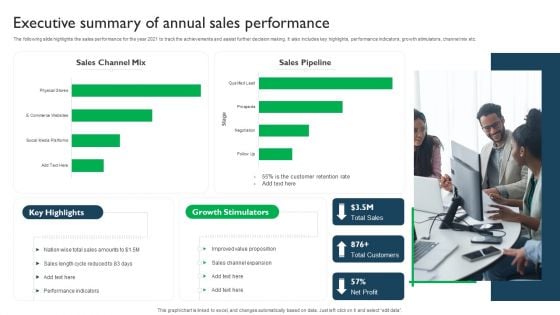
Executive Summary Of Annual Sales Performance Topics PDF
The following slide highlights the sales performance for the year 2021 to track the achievements and assist further decision making. It also includes key highlights, performance indicators, growth stimulators, channel mix etc. Pitch your topic with ease and precision using this Executive Summary Of Annual Sales Performance Topics PDF. This layout presents information on Growth Stimulators, Sales, Value Proposition. It is also available for immediate download and adjustment. So, changes can be made in the color, design, graphics or any other component to create a unique layout.
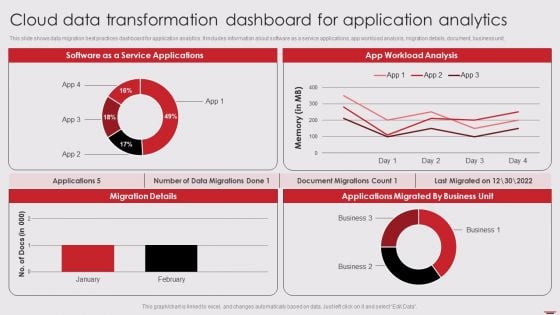
Cloud Data Transformation Dashboard For Application Analytics Information PDF
This slide shows data migration best practices dashboard for application analytics. It includes information about software as a service applications, app workload analysis, migration details, document, business unit. Pitch your topic with ease and precision using this Cloud Data Transformation Dashboard For Application Analytics Information PDF. This layout presents information on Software Service Applications, App Workload Analysis, Migration Details. It is also available for immediate download and adjustment. So, changes can be made in the color, design, graphics or any other component to create a unique layout.
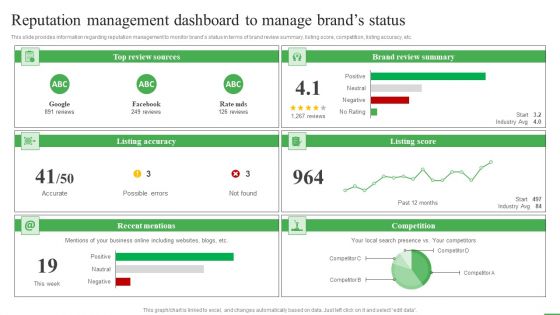
How To Boost Brand Recognition Reputation Management Dashboard To Manage Brands Rules PDF
This slide provides information regarding reputation management to monitor brands status in terms of brand review summary, listing score, competition, listing accuracy, etc. Get a simple yet stunning designed How To Boost Brand Recognition Reputation Management Dashboard To Manage Brands Rules PDF. It is the best one to establish the tone in your meetings. It is an excellent way to make your presentations highly effective. So, download this PPT today from Slidegeeks and see the positive impacts. Our easy-to-edit How To Boost Brand Recognition Reputation Management Dashboard To Manage Brands Rules PDF can be your go-to option for all upcoming conferences and meetings. So, what are you waiting for Grab this template today.
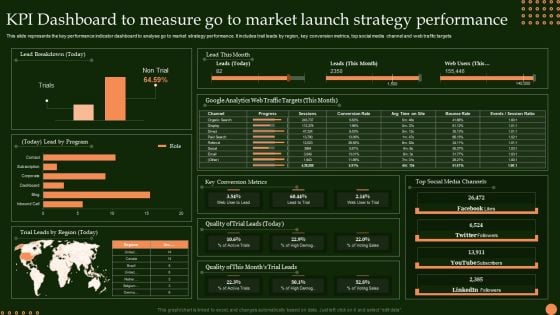
KPI Dashboard To Measure Go To Market Launch Strategy Performance Sample PDF
This slide represents the key performance indicator dashboard to analyse go to market strategy performance. It includes trail leads by region, key conversion metrics, top social media channel and web traffic targets Pitch your topic with ease and precision using this KPI Dashboard To Measure Go To Market Launch Strategy Performance Sample PDF. This layout presents information on Lead Breakdown, Lead By Program, Trial Leads Region. It is also available for immediate download and adjustment. So, changes can be made in the color, design, graphics or any other component to create a unique layout.
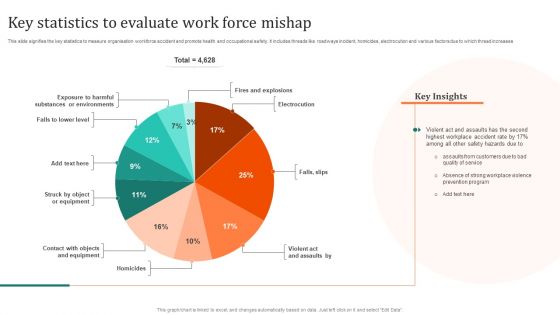
Key Statistics To Evaluate Work Force Mishap Brochure PDF
This slide signifies the key statistics to measure organisation workforce accident and promote health and occupational safety. It includes threads like roadways incident, homicides, electrocution and various factors due to which thread increases Showcasing this set of slides titled Key Statistics To Evaluate Work Force Mishap Brochure PDF. The topics addressed in these templates are Fires Explosions, Electrocution, Work Force Mishap. All the content presented in this PPT design is completely editable. Download it and make adjustments in color, background, font etc. as per your unique business setting.
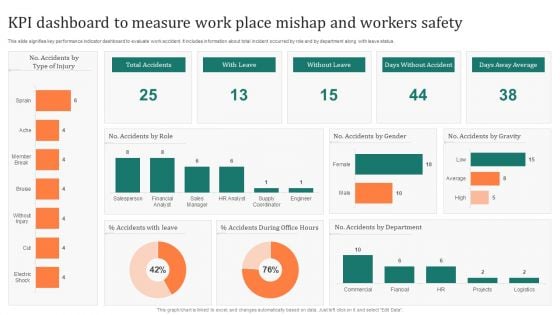
KPI Dashboard To Measure Work Place Mishap And Workers Safety Inspiration PDF
This slide signifies key performance indicator dashboard to evaluate work accident. It includes information about total incident occurred by role and by department along with leave status. Pitch your topic with ease and precision using this KPI Dashboard To Measure Work Place Mishap And Workers Safety Inspiration PDF. This layout presents information on Accidents Role, Accidents Leave, Accidents Department. It is also available for immediate download and adjustment. So, changes can be made in the color, design, graphics or any other component to create a unique layout.
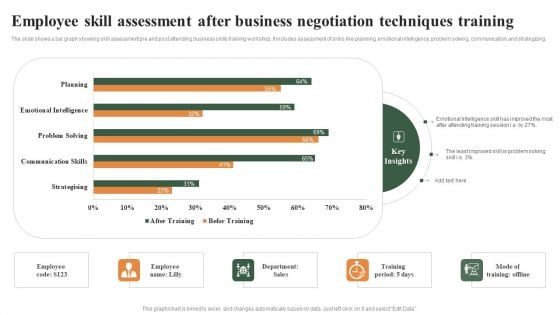
Employee Skill Assessment After Business Negotiation Techniques Training Elements PDF
The slide shows a bar graph showing skill assessment pre and post attending business skills training workshop. It includes assessment of skills like planning, emotional intelligence, problem solving, communication and strategizing. Showcasing this set of slides titled Employee Skill Assessment After Business Negotiation Techniques Training Elements PDF. The topics addressed in these templates are Employee, Emotional Intelligence, Attending Training Session. All the content presented in this PPT design is completely editable. Download it and make adjustments in color, background, font etc. as per your unique business setting.
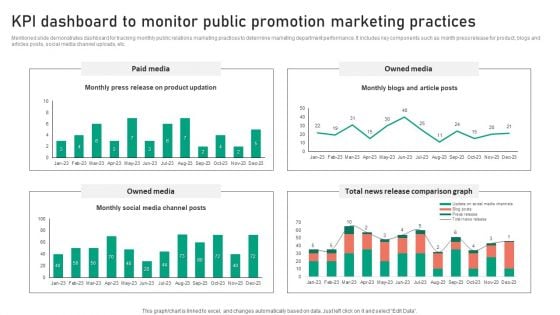
KPI Dashboard To Monitor Public Promotion Marketing Practices Template PDF
Mentioned slide demonstrates dashboard for tracking monthly public relations marketing practices to determine marketing department performance. It includes key components such as month press release for product, blogs and articles posts, social media channel uploads, etc. Pitch your topic with ease and precision using this KPI Dashboard To Monitor Public Promotion Marketing Practices Template PDF. This layout presents information on Paid Media, Owned Media, Total News Release, Comparison Graph. It is also available for immediate download and adjustment. So, changes can be made in the color, design, graphics or any other component to create a unique layout.
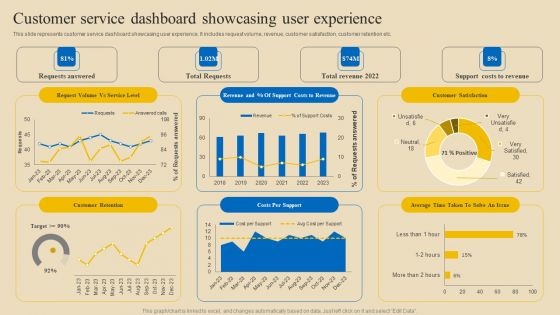
Implementing Digital Customer Service Customer Service Dashboard Showcasing User Portrait PDF
This slide represents customer service dashboard showcasing user experience. It includes request volume, revenue, customer satisfaction, customer retention etc. Get a simple yet stunning designed Implementing Digital Customer Service Customer Service Dashboard Showcasing User Portrait PDF. It is the best one to establish the tone in your meetings. It is an excellent way to make your presentations highly effective. So, download this PPT today from Slidegeeks and see the positive impacts. Our easy-to-edit Implementing Digital Customer Service Customer Service Dashboard Showcasing User Portrait PDF can be your go-to option for all upcoming conferences and meetings. So, what are you waiting for Grab this template today.
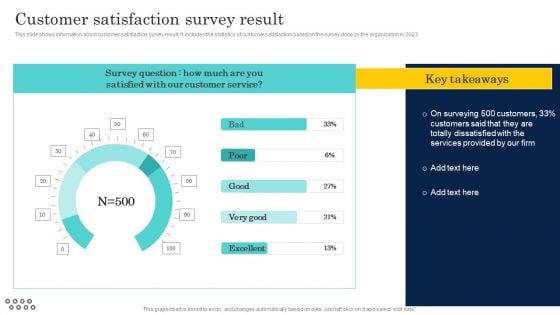
Optimizing And Managing Retail Customer Satisfaction Survey Result Introduction PDF
This slide shows information about customer satisfaction survey result. It includes the statistics of customer satisfaction based on the survey done by the organization in 2023.. Get a simple yet stunning designed Optimizing And Managing Retail Customer Satisfaction Survey Result Introduction PDF. It is the best one to establish the tone in your meetings. It is an excellent way to make your presentations highly effective. So, download this PPT today from Slidegeeks and see the positive impacts. Our easy-to-edit Optimizing And Managing Retail Customer Satisfaction Survey Result Introduction PDF can be your go-to option for all upcoming conferences and meetings. So, what are you waiting for Grab this template today.
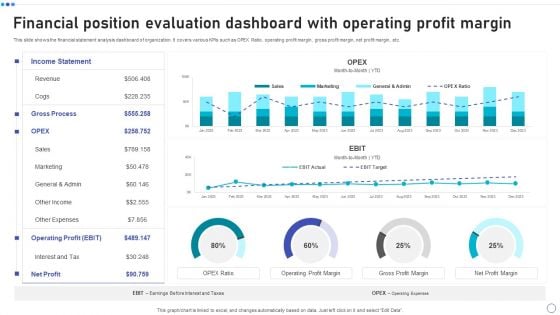
Financial Position Evaluation Dashboard With Operating Profit Margin Elements PDF
This slide shows the financial statement analysis dashboard of organization. It covers various KPIs such as OPEX Ratio, operating profit margin, gross profit margin, net profit margin, etc. Pitch your topic with ease and precision using this Financial Position Evaluation Dashboard With Operating Profit Margin Elements PDF. This layout presents information on Income Statement, Revenue, Operating Profit, Net Profit. It is also available for immediate download and adjustment. So, changes can be made in the color, design, graphics or any other component to create a unique layout.
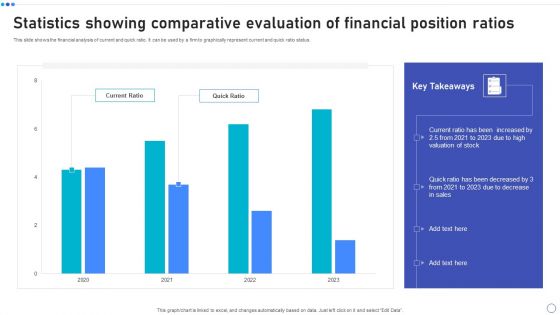
Statistics Showing Comparative Evaluation Of Financial Position Ratios Download PDF
This slide shows the financial analysis of current and quick ratio. It can be used by a firm to graphically represent current and quick ratio status. Pitch your topic with ease and precision using this Statistics Showing Comparative Evaluation Of Financial Position Ratios Download PDF. This layout presents information on Current Ratio, Quick Ratio, 2021 To 2023. It is also available for immediate download and adjustment. So, changes can be made in the color, design, graphics or any other component to create a unique layout.
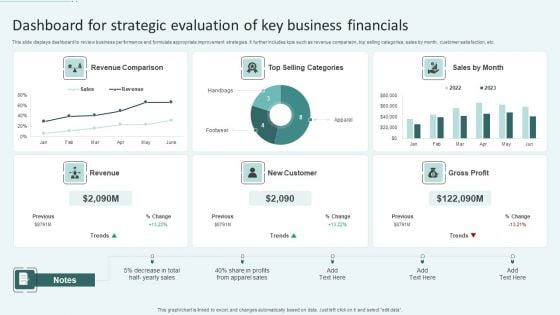
Dashboard For Strategic Evaluation Of Key Business Financials Ppt Gallery Aids PDF
This slide displays dashboard to review business performance and formulate appropriate improvement strategies. It further includes kpis such as revenue comparison, top selling categories, sales by month, customer satisfaction, etc. Showcasing this set of slides titled Dashboard For Strategic Evaluation Of Key Business Financials Ppt Gallery Aids PDF. The topics addressed in these templates are Revenue Comparison, Top Selling Categories, New Customer. All the content presented in this PPT design is completely editable. Download it and make adjustments in color, background, font etc. as per your unique business setting.
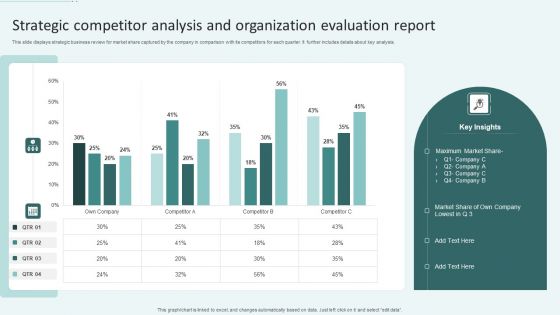
Strategic Competitor Analysis And Organization Evaluation Report Ppt Ideas Clipart Images PDF
This slide displays strategic business review for market share captured by the company in comparison with its competitors for each quarter. It further includes details about key analysis. Pitch your topic with ease and precision using this Strategic Competitor Analysis And Organization Evaluation Report Ppt Ideas Clipart Images PDF. This layout presents information on Maximum Market Share, Key Insights. It is also available for immediate download and adjustment. So, changes can be made in the color, design, graphics or any other component to create a unique layout.
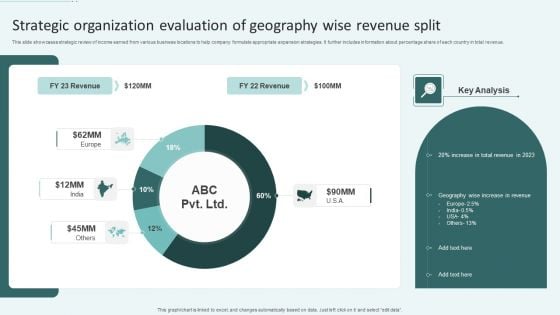
Strategic Organization Evaluation Of Geography Wise Revenue Split Ppt File Graphics Download PDF
This slide showcases strategic review of income earned from various business locations to help company formulate appropriate expansion strategies. It further includes information about percentage share of each country in total revenue. Showcasing this set of slides titled Strategic Organization Evaluation Of Geography Wise Revenue Split Ppt File Graphics Download PDF. The topics addressed in these templates are Total Revenue 2023, Key Analysis, FY 22 Revenue, FY 23 Revenue. All the content presented in this PPT design is completely editable. Download it and make adjustments in color, background, font etc. as per your unique business setting.
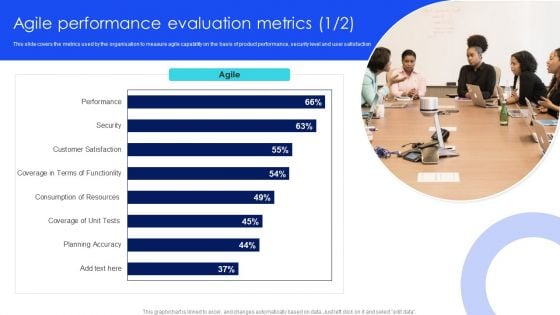
IT Agile Framework Agile Performance Evaluation Metrics Brochure PDF
This slide covers the metrics used by the organisation to measure agile capability on the basis of product performance, security level and user satisfaction Get a simple yet stunning designed IT Agile Framework Agile Performance Evaluation Metrics Brochure PDF. It is the best one to establish the tone in your meetings. It is an excellent way to make your presentations highly effective. So, download this PPT today from Slidegeeks and see the positive impacts. Our easy-to-edit IT Agile Framework Agile Performance Evaluation Metrics Brochure PDF can be your go-to option for all upcoming conferences and meetings. So, what are you waiting for Grab this template today.

KPI Dashboard Of Managing Innovative Business Project Ppt Pictures Show PDF
This slide shows the KPI dashboard of innovation project management. It covers the following KPIs such as innovation success rate, value in project, total revenue, active projects, etc. Pitch your topic with ease and precision using this KPI Dashboard Of Managing Innovative Business Project Ppt Pictures Show PDF. This layout presents information on Innovation Success Rate, Total Active Projects, Amount Mission. It is also available for immediate download and adjustment. So, changes can be made in the color, design, graphics or any other component to create a unique layout.
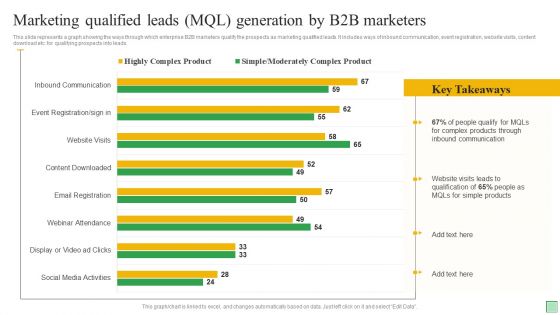
Marketing Qualified Leads MQL Generation By B2B Marketers Ppt Infographic Template Design Ideas PDF
This slide represents a graph showing the ways through which enterprise B2B marketers qualify the prospects as marketing qualified leads. It includes ways of inbound communication, event registration, website visits, content download etc. for qualifying prospects into leads. Showcasing this set of slides titled Marketing Qualified Leads MQL Generation By B2B Marketers Ppt Infographic Template Design Ideas PDF. The topics addressed in these templates are People Qualify, Inbound Communication, Complex Products. All the content presented in this PPT design is completely editable. Download it and make adjustments in color, background, font etc. as per your unique business setting.
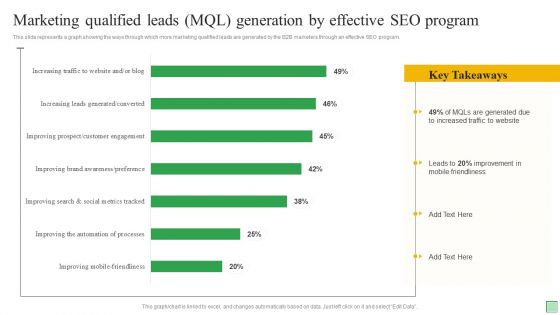
Marketing Qualified Leads MQL Generation By Effective SEO Program Ppt Slides Example Topics PDF
This slide represents a graph showing the ways through which more marketing qualified leads are generated by the B2B marketers through an effective SEO program. Pitch your topic with ease and precision using this Marketing Qualified Leads MQL Generation By Effective SEO Program Ppt Slides Example Topics PDF. This layout presents information on Mobile Friendliness, Due To Increased, Traffic To Website. It is also available for immediate download and adjustment. So, changes can be made in the color, design, graphics or any other component to create a unique layout.
Marketing Qualified Leads MQL Generation Report Summary Ppt Icon Pictures PDF
This slide represents dashboard showing the report of generated marketing qualified leads. It shows details related to MQLs by month, status, reasons for MQLs and recycle etc. Showcasing this set of slides titled Marketing Qualified Leads MQL Generation Report Summary Ppt Icon Pictures PDF. The topics addressed in these templates are MQLs By Status, MQLs By Month, MQLs Converted. All the content presented in this PPT design is completely editable. Download it and make adjustments in color, background, font etc. as per your unique business setting.
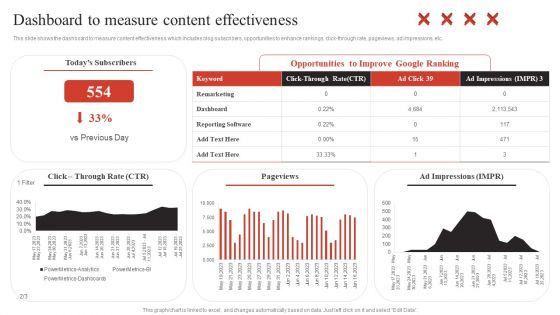
Developing Content Marketing Dashboard To Measure Content Effectiveness Brochure PDF
This slide shows the dashboard to measure content effectiveness which includes blog subscribers, opportunities to enhance rankings, click-through rate, pageviews, ad impressions, etc. Get a simple yet stunning designed Developing Content Marketing Dashboard To Measure Content Effectiveness Brochure PDF. It is the best one to establish the tone in your meetings. It is an excellent way to make your presentations highly effective. So, download this PPT today from Slidegeeks and see the positive impacts. Our easy-to-edit Developing Content Marketing Dashboard To Measure Content Effectiveness Brochure PDF can be your go-to option for all upcoming conferences and meetings. So, what are you waiting for Grab this template today.
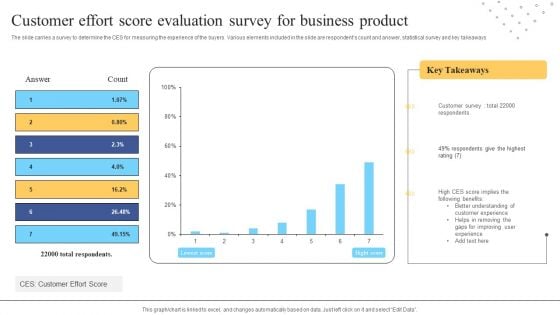
Customer Effort Score Evaluation Survey For Business Product Ppt Gallery Visuals PDF
The slide carries a survey to determine the CES for measuring the experience of the buyers. Various elements included in the slide are respondents count and answer, statistical survey and key takeaways. Showcasing this set of slides titled Customer Effort Score Evaluation Survey For Business Product Ppt Gallery Visuals PDF. The topics addressed in these templates are Customer Effort Score, Customer Survey, Highest Rating. All the content presented in this PPT design is completely editable. Download it and make adjustments in color, background, font etc. as per your unique business setting.
Customer Satisfaction Metrics With NPR And Customer Effort Score Ppt Icon Graphics Tutorials PDF
The slide carries a dashboard to evaluate customer experience for bringing advancement in existing products. Various KPIs used to measure customer experience are NPS Net Promoter Score and CES Customer Effort Score. Showcasing this set of slides titled Customer Satisfaction Metrics With NPR And Customer Effort Score Ppt Icon Graphics Tutorials PDF. The topics addressed in these templates are Net Promoter Score, Customer Effort Score, Product Service Reviews. All the content presented in this PPT design is completely editable. Download it and make adjustments in color, background, font etc. as per your unique business setting.
Yearly Status Report For Average Customer Effort Score Assessment Ppt Icon Layout Ideas PDF
The slide carries a summary report to assess average CES for predicting the customer behaviour and purchasing habits. Various elements included are average rating, yearly graphs and key takeaways. Pitch your topic with ease and precision using this Yearly Status Report For Average Customer Effort Score Assessment Ppt Icon Layout Ideas PDF. This layout presents information on Good Customer Experience, Easy To Purchase, Processes, Increase Churn Rate. It is also available for immediate download and adjustment. So, changes can be made in the color, design, graphics or any other component to create a unique layout.
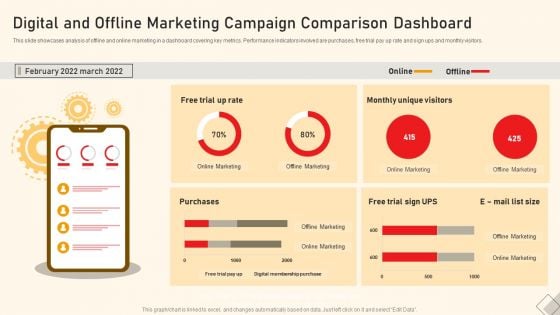
Digital And Offline Marketing Campaign Comparison Dashboard Ppt Inspiration Microsoft PDF
This slide showcases analysis of offline and online marketing in a dashboard covering key metrics. Performance indicators involved are purchases, free trial pay up rate and sign ups and monthly visitors. Pitch your topic with ease and precision using this Digital And Offline Marketing Campaign Comparison Dashboard Ppt Inspiration Microsoft PDF. This layout presents information on Online Marketing, Offline Marketing, Free Trial Sign, UPS. It is also available for immediate download and adjustment. So, changes can be made in the color, design, graphics or any other component to create a unique layout.

Expense Incurred On Digital And Offline Marketing Promotion Ppt Slides Infographics PDF
This slide showcases analysis of amount spent on online and offline marketing over the years. The following bar graph shows expense spent on advertising through online channels increased as it has proved more to be more effective. Showcasing this set of slides titled Expense Incurred On Digital And Offline Marketing Promotion Ppt Slides Infographics PDF. The topics addressed in these templates are Growth, Online Product Promotion, 2018 To 2023. All the content presented in this PPT design is completely editable. Download it and make adjustments in color, background, font etc. as per your unique business setting.
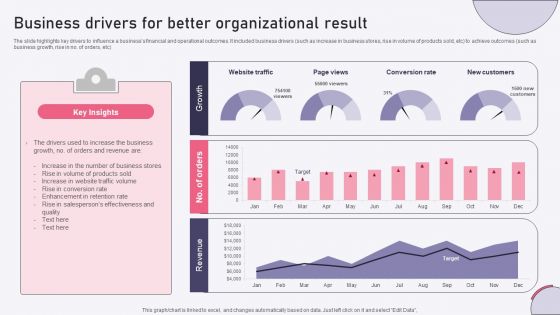
Business Drivers For Better Organizational Result Ppt Summary Templates PDF
The slide highlights key drivers to influence a businesss financial and operational outcomes. It included business drivers such as increase in business stores, rise in volume of products sold, etc to achieve outcomes such as business growth, rise in no. of orders, etc. Showcasing this set of slides titled Business Drivers For Better Organizational Result Ppt Summary Templates PDF. The topics addressed in these templates are Website Traffic, Page Views, Conversion Rate, New Customers. All the content presented in this PPT design is completely editable. Download it and make adjustments in color, background, font etc. as per your unique business setting.

Global Healthcare Business Process Outsourcing Industry Outlook Guidelines PDF
This slide brings forth the market projection of business process outsourcing companies with major reference to healthcare industry. The key elements are market size, key drivers, market size projection, incremental growth, largest market, by geography, service provider and life science service Showcasing this set of slides titled Global Healthcare Business Process Outsourcing Industry Outlook Guidelines PDF. The topics addressed in these templates are Market Size, Market Size Projection, Largest Market. All the content presented in this PPT design is completely editable. Download it and make adjustments in color, background, font etc. as per your unique business setting.
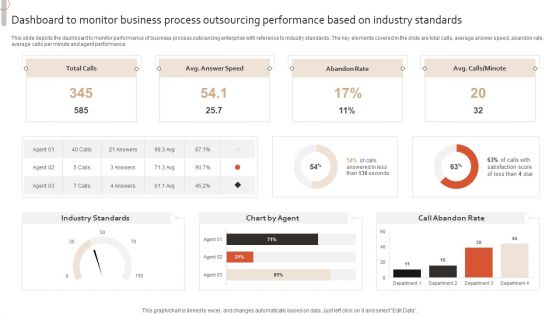
Dashboard To Monitor Business Process Outsourcing Performance Based On Industry Standards Infographics PDF
This slide depicts the dashboard to monitor performance of business process outsourcing enterprise with reference to industry standards. The key elements covered in the slide are total calls, average answer speed, abandon rate, average calls per minute and agent performanc. Showcasing this set of slides titled Dashboard To Monitor Business Process Outsourcing Performance Based On Industry Standards Infographics PDF. The topics addressed in these templates are Industry Standards, Chart By Agent, Call Abandon Rate, Total Calls. All the content presented in this PPT design is completely editable. Download it and make adjustments in color, background, font etc. as per your unique business setting.
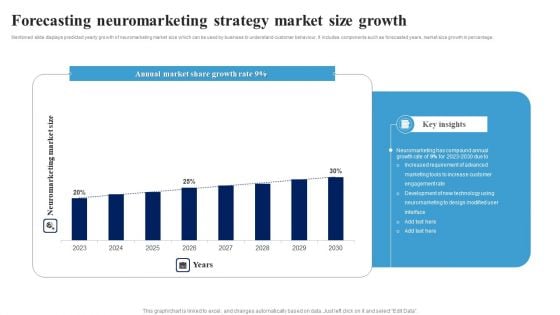
Forecasting Neuromarketing Strategy Market Size Growth Ppt Ideas Slideshow PDF
Mentioned slide displays predicted yearly growth of neuromarketing market size which can be used by business to understand customer behaviour. It includes components such as forecasted years, market size growth in percentage. Showcasing this set of slides titled Forecasting Neuromarketing Strategy Market Size Growth Ppt Ideas Slideshow PDF. The topics addressed in these templates are Annual Market Share, Growth Rate, Neuromarketing Compound, Annual Growth Rate. All the content presented in this PPT design is completely editable. Download it and make adjustments in color, background, font etc. as per your unique business setting.
Neuromarketing Strategy Technology Market Share By Different Regions Ppt Icon Deck PDF
This slide showcases forecasted neuromarketing technology growth by different regions to identify future business opportunities. It includes regions such as North America, Europe, Asia Pacific and Rest of the World. Showcasing this set of slides titled Neuromarketing Strategy Technology Market Share By Different Regions Ppt Icon Deck PDF. The topics addressed in these templates are Marketing Campaigns, Improved Brand Awareness, Develop Packaging Strategy. All the content presented in this PPT design is completely editable. Download it and make adjustments in color, background, font etc. as per your unique business setting.
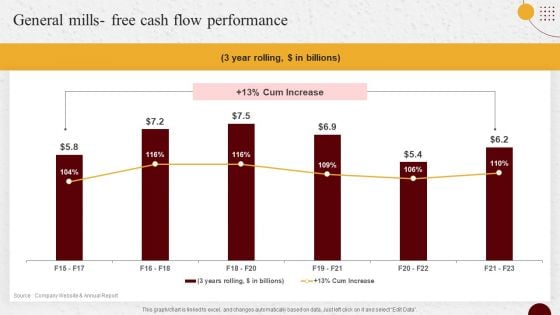
Industry Report Of Packaged Food Products Part 2 General Mills Free Cash Flow Performance Sample PDF
Get a simple yet stunning designed Industry Report Of Packaged Food Products Part 2 General Mills Free Cash Flow Performance Sample PDF. It is the best one to establish the tone in your meetings. It is an excellent way to make your presentations highly effective. So, download this PPT today from Slidegeeks and see the positive impacts. Our easy to edit Industry Report Of Packaged Food Products Part 2 General Mills Free Cash Flow Performance Sample PDF can be your go to option for all upcoming conferences and meetings. So, what are you waiting for Grab this template today.
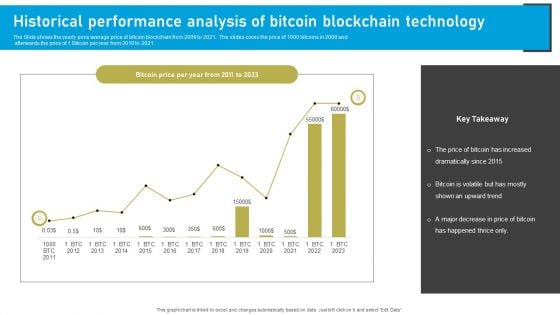
Historical Performance Analysis Of Bitcoin Blockchain Technology Inspiration PDF
The Slide shows the yearly price average price of bitcoin blockchain from 2009 to 2021. The slides coves the price of 1000 bitcoins in 2009 and afterwards the price of 1 Bitcoin per year from 2010 to 2021. Showcasing this set of slides titled Historical Performance Analysis Of Bitcoin Blockchain Technology Inspiration PDF. The topics addressed in these templates are Historical Performance Analysis, Bitcoin Blockchain Technology. All the content presented in this PPT design is completely editable. Download it and make adjustments in color, background, font etc. as per your unique business setting.
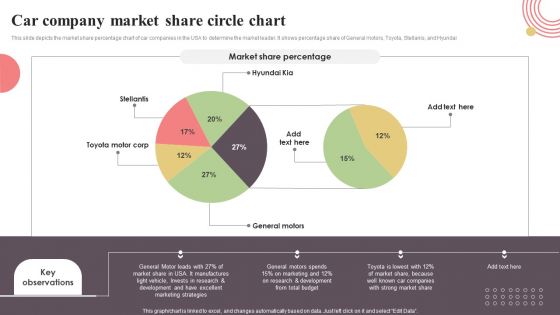
Car Company Market Share Circle Chart Slides PDF
This slide depicts the market share percentage chart of car companies in the USA to determine the market leader. It shows percentage share of General motors, Toyota, Stellanis, and Hyundai. Showcasing this set of slides titled Car Company Market Share Circle Chart Slides PDF. The topics addressed in these templates are Car Company Market, Share Circle Chart. All the content presented in this PPT design is completely editable. Download it and make adjustments in color, background, font etc. as per your unique business setting.
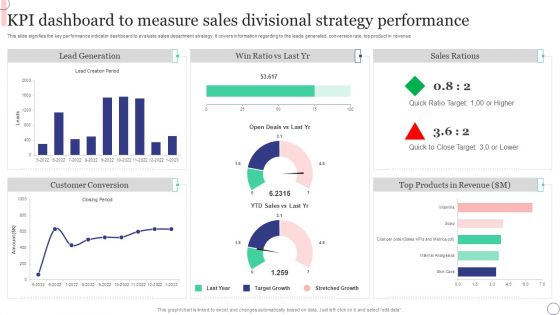
KPI Dashboard To Measure Sales Divisional Strategy Performance Microsoft PDF
This slide signifies the key performance indicator dashboard to evaluate sales department strategy. It covers information regarding to the leads generated, conversion rate, top product in revenue. Pitch your topic with ease and precision using this KPI Dashboard To Measure Sales Divisional Strategy Performance Microsoft PDF. This layout presents information on Sales Rations, Lead Generation, Customer Conversion. It is also available for immediate download and adjustment. So, changes can be made in the color, design, graphics or any other component to create a unique layout.
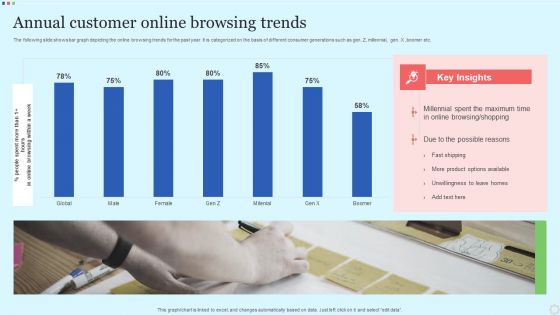
Annual Customer Online Browsing Trends Ideas PDF
The following slide shows bar graph depicting the online browsing trends for the past year. It is categorized on the basis of different consumer generations such as gen. Z, millennial, gen. X ,boomer etc. Showcasing this set of slides titled Annual Customer Online Browsing Trends Ideas PDF. The topics addressed in these templates are Online Browsing, Millennial Spent, Possible Reasons. All the content presented in this PPT design is completely editable. Download it and make adjustments in color, background, font etc. as per your unique business setting.
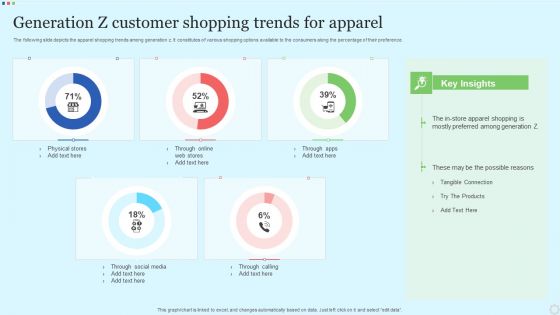
Generation Z Customer Shopping Trends For Apparel Designs PDF
The following slide depicts the apparel shopping trends among generation z. It constitutes of various shopping options available to the consumers along the percentage of their preference. Pitch your topic with ease and precision using this Generation Z Customer Shopping Trends For Apparel Designs PDF. This layout presents information on Physical Stores, Through Social Media, Through Calling. It is also available for immediate download and adjustment. So, changes can be made in the color, design, graphics or any other component to create a unique layout.
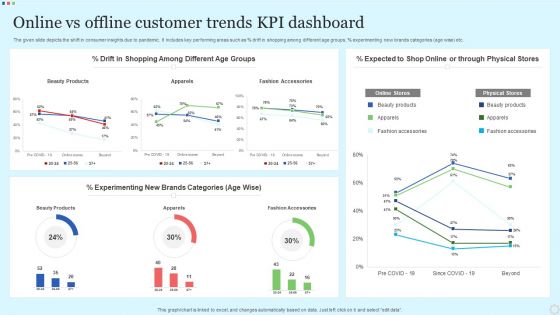
Online Vs Offline Customer Trends Kpi Dashboard Rules PDF
The given slide depicts the shift in consumer insights due to pandemic. It includes key performing areas such as percent drift in shopping among different age groups, percent experimenting new brands categories age wise etc. Showcasing this set of slides titled Online Vs Offline Customer Trends Kpi Dashboard Rules PDF. The topics addressed in these templates are Beauty Products, Apparels, Fashion Accessories. All the content presented in this PPT design is completely editable. Download it and make adjustments in color, background, font etc. as per your unique business setting.
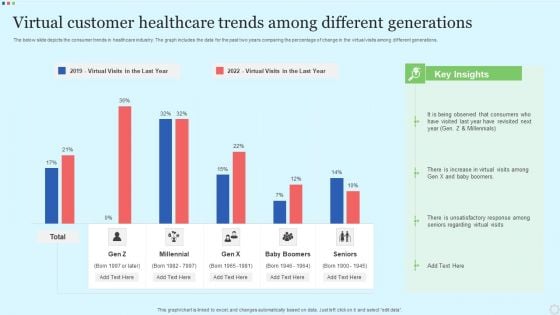
Virtual Customer Healthcare Trends Among Different Generations Professional PDF
The below slide depicts the consumer trends in healthcare industry. The graph includes the data for the past two years comparing the percentage of change in the virtual visits among different generations. Pitch your topic with ease and precision using this Virtual Customer Healthcare Trends Among Different Generations Professional PDF. This layout presents information on Millennial, Baby Boomers, Seniors. It is also available for immediate download and adjustment. So, changes can be made in the color, design, graphics or any other component to create a unique layout.
Digital Marketing Dashboard For Tracking Lead Generation Guidelines PDF
This slide showcases dashboard for digital marketing that can help organization track the monthly leads generated and performance of online marketing campaigns. Its key components are lead breakdown, total lead by program, web traffic targets, key conversion metrics, trial leads by region, total social media channels and key conversion metrics. Showcasing this set of slides titled Digital Marketing Dashboard For Tracking Lead Generation Guidelines PDF. The topics addressed in these templates are Lead By Program, Lead Breakdown, Key Conversion Metrics. All the content presented in this PPT design is completely editable. Download it and make adjustments in color, background, font etc. as per your unique business setting.
Lead Tracking Dashboard With Metric Comparison Brochure PDF
This slide showcases dashboard of lead pipeline that can help to identify total number of leads generated and expenses incurred to acquire the audience. It also showcases other key performance metrics like lead breakdown by status and number of leads per month. Pitch your topic with ease and precision using this Lead Tracking Dashboard With Metric Comparison Brochure PDF. This layout presents information on Metric Comparison, Lead Pipeline, Lead Breakdown Status. It is also available for immediate download and adjustment. So, changes can be made in the color, design, graphics or any other component to create a unique layout.
Lead Tracking Metrics Dashboard With User Responses Diagrams PDF
This slide showcases dashboard for lead conversion metrics that can help organization to filter out total leads interested from the leads who have responded to the phone calls by organization. It also showcases key metrics such as leads busiest hours, leads busiest days, phone number types and lead types. Showcasing this set of slides titled Lead Tracking Metrics Dashboard With User Responses Diagrams PDF. The topics addressed in these templates are Busiest Hours Leads, Conversion Metrics, Lead Types. All the content presented in this PPT design is completely editable. Download it and make adjustments in color, background, font etc. as per your unique business setting.
Monthly Comparison Dashboard For Lead Tracking Sample PDF
This slide showcases dashboard that can help organization to compare the leads converted in different months and make changes in sales and marketing campaigns . Its key components lead generated by country, by industry type and lead sources by month. Showcasing this set of slides titled Monthly Comparison Dashboard For Lead Tracking Sample PDF. The topics addressed in these templates are Leads Received, Industry Type, Lead Generated. All the content presented in this PPT design is completely editable. Download it and make adjustments in color, background, font etc. as per your unique business setting.
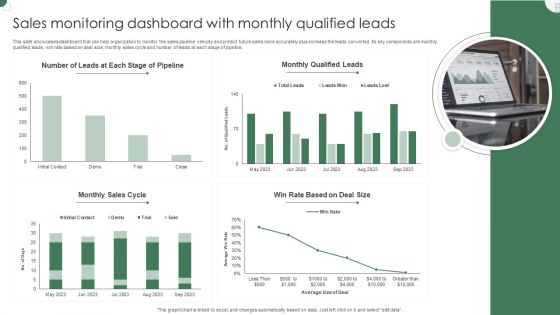
Sales Monitoring Dashboard With Monthly Qualified Leads Guidelines PDF
This slide showcases dashboard that can help organization to monitor the sales pipeline velocity and predict future sales more accurately plus increase the leads converted. Its key components are monthly qualified leads, win rate based on deal size, monthly sales cycle and number of leads at each stage of pipeline. Pitch your topic with ease and precision using this Sales Monitoring Dashboard With Monthly Qualified Leads Guidelines PDF. This layout presents information on Monthly Qualified, Monthly Sales Cycle, Deal Size. It is also available for immediate download and adjustment. So, changes can be made in the color, design, graphics or any other component to create a unique layout.
Sales Performance Dashboard With Average Lead Tracking Time Background PDF
This slide showcases dashboard for sales performance that can help organization to analyze the effectiveness of sales campaigns and average response time of lead. Its key components are average contract value, average sales cycle length, follow up contract rate and sales activity. Showcasing this set of slides titled Sales Performance Dashboard With Average Lead Tracking Time Background PDF. The topics addressed in these templates are Avg Contract Value, Sales Activity, Contract Rate. All the content presented in this PPT design is completely editable. Download it and make adjustments in color, background, font etc. as per your unique business setting.
Website Leads Tracking Dashboard With Traffic Sources Infographics PDF
This slide showcases dashboard for lead generation that can help organziation to identify the traffic sources plus visitors and make changes in SEO of website. It also showcases key metrics that are bounce rate by week, visitors by user type, top channels by conversion, top campaign by conversion and top pages by conversion. Pitch your topic with ease and precision using this Website Leads Tracking Dashboard With Traffic Sources Infographics PDF. This layout presents information on Visitors User Type, Traffic Sources, Bounce Rate Week. It is also available for immediate download and adjustment. So, changes can be made in the color, design, graphics or any other component to create a unique layout.
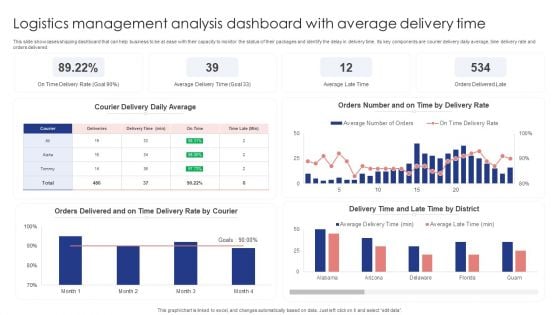
Logistics Management Analysis Dashboard With Average Delivery Time Themes PDF
This slide showcases shipping dashboard that can help business to be at ease with their capacity to monitor the status of their packages and identify the delay in delivery time. Its key components are courier delivery daily average, time delivery rate and orders delivered. Showcasing this set of slides titled Logistics Management Analysis Dashboard With Average Delivery Time Themes PDF. The topics addressed in these templates are Courier Delivery Daily Average, Delivery Rate, Orders Delivered. All the content presented in this PPT design is completely editable. Download it and make adjustments in color, background, font etc. as per your unique business setting.
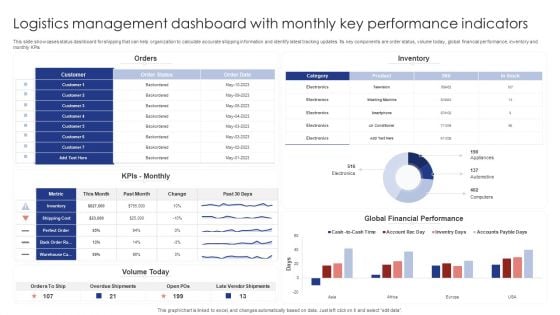
Logistics Management Dashboard With Monthly Key Performance Indicators Rules PDF
This slide showcases status dashboard for shipping that can help organization to calculate accurate shipping information and identify latest tracking updates. Its key components are order status, volume today, global financial performance, inventory and monthly KPIs. Pitch your topic with ease and precision using this Logistics Management Dashboard With Monthly Key Performance Indicators Rules PDF. This layout presents information on Orders, Inventory, Kpis Monthly. It is also available for immediate download and adjustment. So, changes can be made in the color, design, graphics or any other component to create a unique layout.
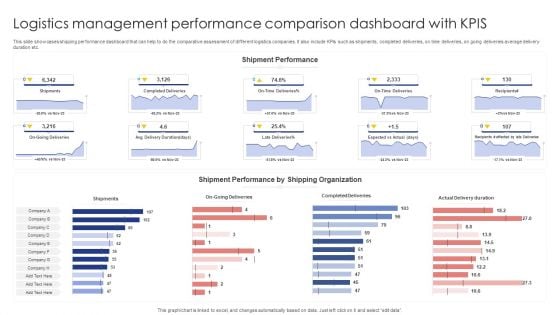
Logistics Management Performance Comparison Dashboard With Kpis Sample PDF
This slide showcases shipping performance dashboard that can help to do the comparative assessment of different logistics companies. It also include KPIs such as shipments, completed deliveries, on time deliveries, on going deliveries average delivery duration etc. Pitch your topic with ease and precision using this Logistics Management Performance Comparison Dashboard With Kpis Sample PDF. This layout presents information on Shipments, Completed Deliveries, Actual Delivery Duration. It is also available for immediate download and adjustment. So, changes can be made in the color, design, graphics or any other component to create a unique layout.
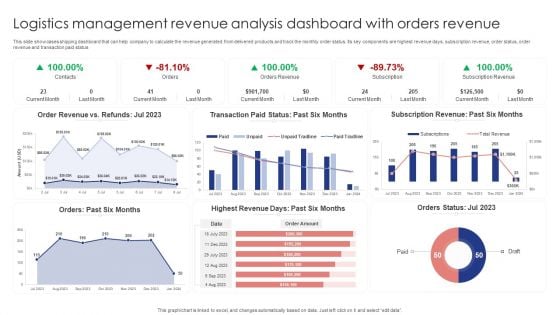
Logistics Management Revenue Analysis Dashboard With Orders Revenue Brochure PDF
This slide showcases shipping dashboard that can help company to calculate the revenue generated from delivered products and track the monthly order status. Its key components are highest revenue days, subscription revenue, order status, order revenue and transaction paid status. Showcasing this set of slides titled Logistics Management Revenue Analysis Dashboard With Orders Revenue Brochure PDF. The topics addressed in these templates are Order Revenue, Transaction Paid, Subscription Revenue. All the content presented in this PPT design is completely editable. Download it and make adjustments in color, background, font etc. as per your unique business setting.
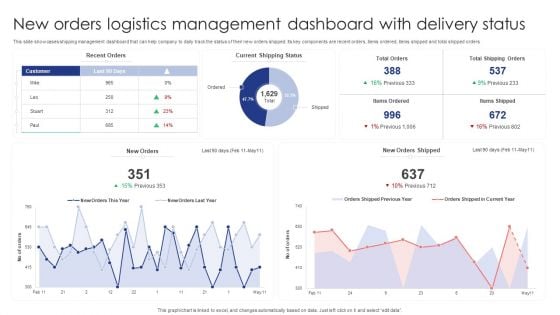
New Orders Logistics Management Dashboard With Delivery Status Designs PDF
This slide showcases shipping management dashboard that can help company to daily track the status of their new orders shipped. Its key components are recent orders, items ordered, items shipped and total shipped orders. Pitch your topic with ease and precision using this New Orders Logistics Management Dashboard With Delivery Status Designs PDF. This layout presents information on Recent Orders, Current Shipping Status, New Orders. It is also available for immediate download and adjustment. So, changes can be made in the color, design, graphics or any other component to create a unique layout.
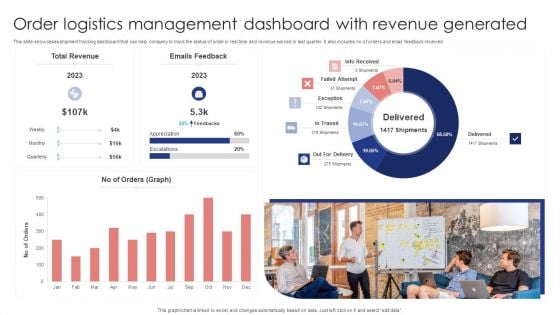
Order Logistics Management Dashboard With Revenue Generated Slides PDF
This slide showcases shipment tracking dashboard that can help company to track the status of order in real time and revenue earned in last quarter. It also includes no of orders and email feedback received. Showcasing this set of slides titled Order Logistics Management Dashboard With Revenue Generated Slides PDF. The topics addressed in these templates are Total Revenue, Emails Feedback, Orders Graph. All the content presented in this PPT design is completely editable. Download it and make adjustments in color, background, font etc. as per your unique business setting.
Dashboard For Tracking Global Share Market Indices Formats PDF
Following slide represent a comprehensive dashboard to track stock market indices of different countries. The indices mentioned in the slide are DOW jones, NASDAQ, S and P along with the highest and lowest price of indices on a particular day. Showcasing this set of slides titled Dashboard For Tracking Global Share Market Indices Formats PDF. The topics addressed in these templates are Global Share, Market Indices, Abbreviations. All the content presented in this PPT design is completely editable. Download it and make adjustments in color, background, font etc. as per your unique business setting.
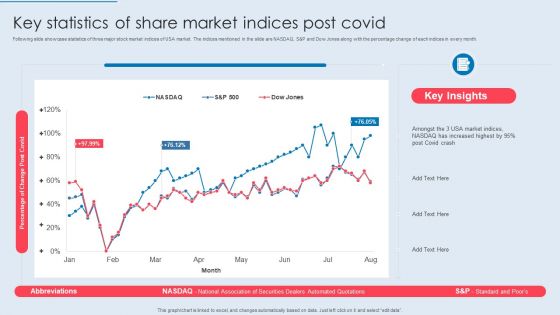
Key Statistics Of Share Market Indices Post Covid Sample PDF
Following slide showcase statistics of three major stock market indices of USA market. The indices mentioned in the slide are NASDAQ, S and P and Dow Jones along with the percentage change of each indices in every month. Showcasing this set of slides titled Key Statistics Of Share Market Indices Post Covid Sample PDF. The topics addressed in these templates are Percentage Change Post Covid, Increased Highest, Indices Post Covid. All the content presented in this PPT design is completely editable. Download it and make adjustments in color, background, font etc. as per your unique business setting.
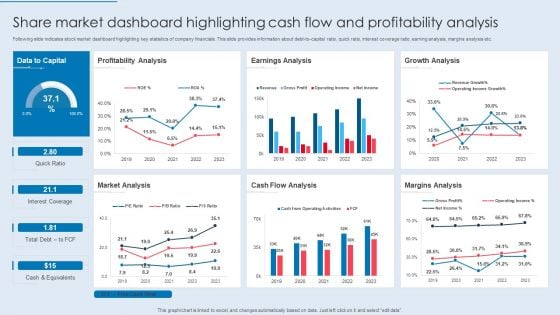
Share Market Dashboard Highlighting Cash Flow And Profitability Analysis Information PDF
Following slide indicates stock market dashboard highlighting key statistics of company financials. This slide provides information about debt-to-capital ratio, quick ratio, interest coverage ratio, earning analysis, margins analysis etc. Showcasing this set of slides titled Share Market Dashboard Highlighting Cash Flow And Profitability Analysis Information PDF. The topics addressed in these templates are Profitability Analysis, Earnings Analysis, Growth Analysis. All the content presented in this PPT design is completely editable. Download it and make adjustments in color, background, font etc. as per your unique business setting.
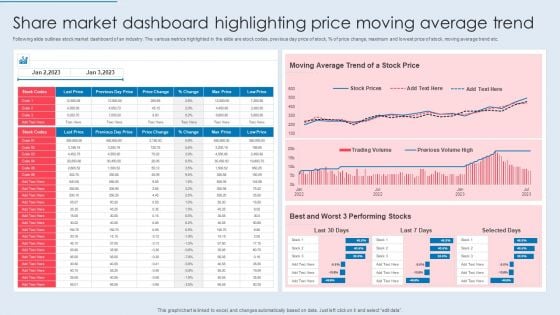
Share Market Dashboard Highlighting Price Moving Average Trend Themes PDF
Following slide outlines stock market dashboard of an industry. The various metrics highlighted in the slide are stock codes, previous day price of stock, percent of price change, maximum and lowest price of stock, moving average trend etc. Pitch your topic with ease and precision using this Share Market Dashboard Highlighting Price Moving Average Trend Themes PDF. This layout presents information on Moving Average, Stock Price, Performing Stocks. It is also available for immediate download and adjustment. So, changes can be made in the color, design, graphics or any other component to create a unique layout.
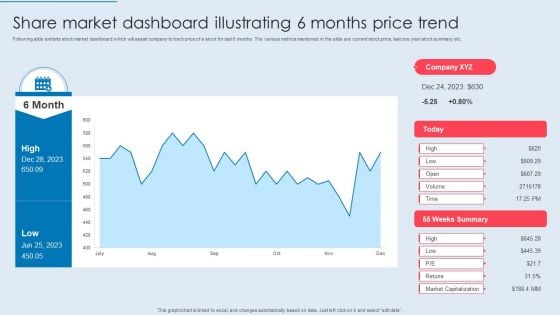
Share Market Dashboard Illustrating 6 Months Price Trend Ideas PDF
Following slide exhibits stock market dashboard which will assist company to track price of a stock for last 6 months. The various metrics mentioned in the slide are current stock price, last one year stock summary etc. Showcasing this set of slides titled Share Market Dashboard Illustrating 6 Months Price Trend Ideas PDF. The topics addressed in these templates are Share Market, Dashboard Illustrating, Months Price Trend. All the content presented in this PPT design is completely editable. Download it and make adjustments in color, background, font etc. as per your unique business setting.
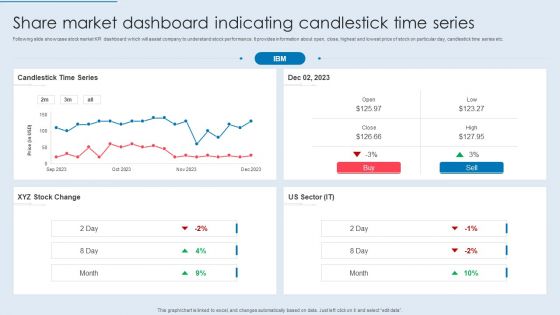
Share Market Dashboard Indicating Candlestick Time Series Formats PDF
Following slide showcase stock market KPI dashboard which will assist company to understand stock performance. It provides information about open, close, highest and lowest price of stock on particular day, candlestick time series etc. Pitch your topic with ease and precision using this Share Market Dashboard Indicating Candlestick Time Series Formats PDF. This layout presents information on Candlestick Time Series, Stock Change, US Sector. It is also available for immediate download and adjustment. So, changes can be made in the color, design, graphics or any other component to create a unique layout.
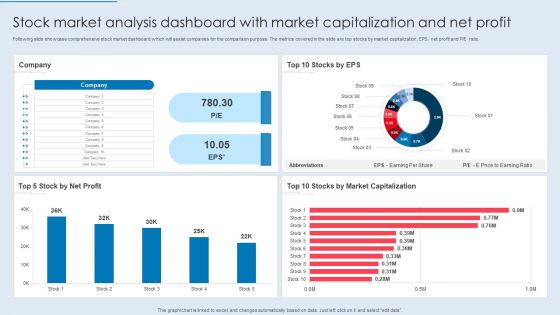
Stock Market Analysis Dashboard With Market Capitalization And Net Profit Elements PDF
Following slide showcase comprehensive stock market dashboard which will assist companies for the comparison purpose. The metrics covered in the slide are top stocks by market capitalization, EPS, net profit and PE ratio. Pitch your topic with ease and precision using this Stock Market Analysis Dashboard With Market Capitalization And Net Profit Elements PDF. This layout presents information on Company, Net Profit, Market Capitalization. It is also available for immediate download and adjustment. So, changes can be made in the color, design, graphics or any other component to create a unique layout.

Virtual Performance Management And Monitoring Dashboard Pictures PDF
Following slide illustrates remote performance dashboard utilized by organizations to monitor active issues and stay ahead of problems. This slide provides data regarding issues, problematic servers, unmonitored devices, server status, reboot time, etc. Pitch your topic with ease and precision using this Virtual Performance Management And Monitoring Dashboard Pictures PDF. This layout presents information on Total Devices, Devices With Problem, Regular Safety Check Problems. It is also available for immediate download and adjustment. So, changes can be made in the color, design, graphics or any other component to create a unique layout.


 Continue with Email

 Home
Home


