Bank Presentation
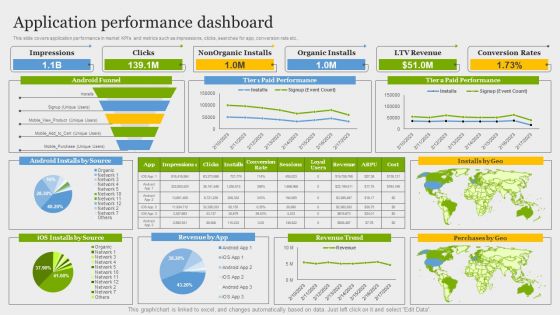
Online Application Development Application Performance Dashboard Information PDF
This slide covers application performance in market KPIs and metrics such as impressions, clicks, searches for app, conversion rate etc. Get a simple yet stunning designed Online Application Development Application Performance Dashboard Information PDF. It is the best one to establish the tone in your meetings. It is an excellent way to make your presentations highly effective. So, download this PPT today from Slidegeeks and see the positive impacts. Our easy to edit Online Application Development Application Performance Dashboard Information PDF can be your go to option for all upcoming conferences and meetings. So, what are you waiting for Grab this template today.
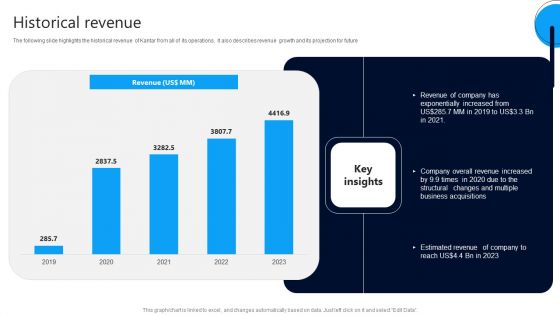
Market Research Evaluation Company Outline Historical Revenue Graphics PDF
The following slide highlights the historical revenue of Kantar from all of its operations. It also describes revenue growth and its projection for future Get a simple yet stunning designed Market Research Evaluation Company Outline Historical Revenue Graphics PDF. It is the best one to establish the tone in your meetings. It is an excellent way to make your presentations highly effective. So, download this PPT today from Slidegeeks and see the positive impacts. Our easy to edit Market Research Evaluation Company Outline Historical Revenue Graphics PDF can be your go to option for all upcoming conferences and meetings. So, what are you waiting for Grab this template today.
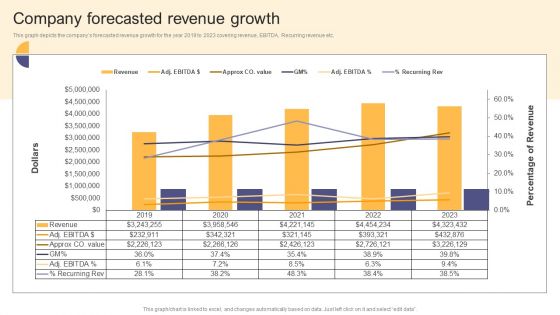
Per Device Pricing Strategy For Managed Solutions Company Forecasted Revenue Growth Themes PDF
This graph depicts the companys forecasted revenue growth for the year 2019 to 2023 covering revenue, EBITDA, Recurring revenue etc. Get a simple yet stunning designed Per Device Pricing Strategy For Managed Solutions Company Forecasted Revenue Growth Themes PDF. It is the best one to establish the tone in your meetings. It is an excellent way to make your presentations highly effective. So, download this PPT today from Slidegeeks and see the positive impacts. Our easy to edit Per Device Pricing Strategy For Managed Solutions Company Forecasted Revenue Growth Themes PDF can be your go to option for all upcoming conferences and meetings. So, what are you waiting for Grab this template today.
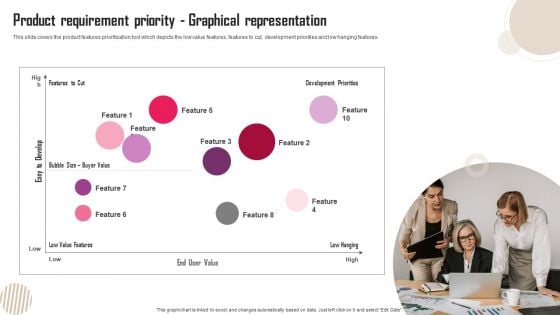
Product Requirement Priority Graphical Representation Template PDF
This slide covers the product features prioritization tool which depicts the low value features, features to cut, development priorities and low hanging features. Get a simple yet stunning designed Product Requirement Priority Graphical Representation Template PDF. It is the best one to establish the tone in your meetings. It is an excellent way to make your presentations highly effective. So, download this PPT today from Slidegeeks and see the positive impacts. Our easy to edit Product Requirement Priority Graphical Representation Template PDF can be your go to option for all upcoming conferences and meetings. So, what are you waiting for Grab this template today.
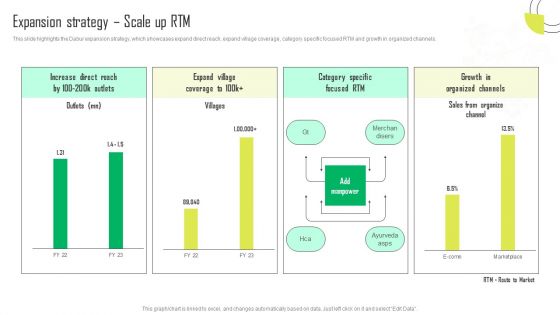
Herbal Products Company Profile Expansion Strategy Scale Up RTM Download PDF
This slide highlights the Dabur expansion strategy, which showcases expand direct reach, expand village coverage, category specific focused RTM and growth in organized channels. Get a simple yet stunning designed Herbal Products Company Profile Expansion Strategy Scale Up RTM Download PDF. It is the best one to establish the tone in your meetings. It is an excellent way to make your presentations highly effective. So, download this PPT today from Slidegeeks and see the positive impacts. Our easy to edit Herbal Products Company Profile Expansion Strategy Scale Up RTM Download PDF can be your go to option for all upcoming conferences and meetings. So, what are you waiting for Grab this template today.
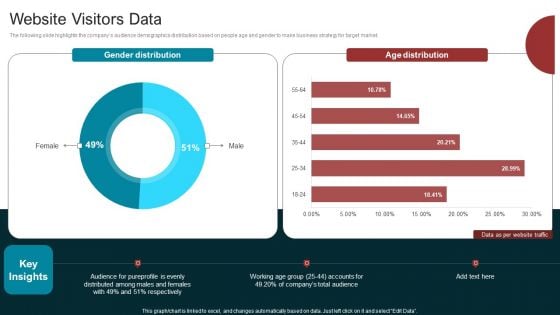
Marketing Agency Company Outline Website Visitors Data Background PDF
The following slide highlights the companys audience demographics distribution based on people age and gender to make business strategy for target market. Get a simple yet stunning designed Marketing Agency Company Outline Website Visitors Data Background PDF. It is the best one to establish the tone in your meetings. It is an excellent way to make your presentations highly effective. So, download this PPT today from Slidegeeks and see the positive impacts. Our easy to edit Marketing Agency Company Outline Website Visitors Data Background PDF can be your go to option for all upcoming conferences and meetings. So, what are you waiting for Grab this template today.
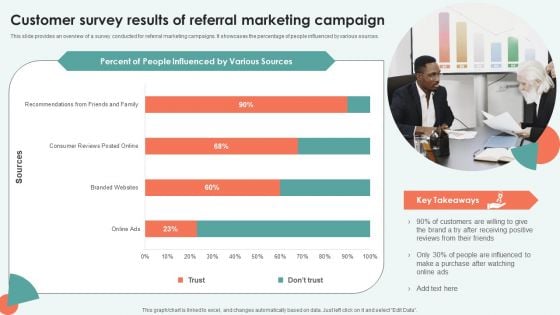
Customer Survey Results Of Referral Marketing Campaign Clipart PDF
This slide provides an overview of a survey conducted for referral marketing campaigns. It showcases the percentage of people influenced by various sources. Get a simple yet stunning designed Customer Survey Results Of Referral Marketing Campaign Clipart PDF. It is the best one to establish the tone in your meetings. It is an excellent way to make your presentations highly effective. So, download this PPT today from Slidegeeks and see the positive impacts. Our easy to edit Customer Survey Results Of Referral Marketing Campaign Clipart PDF can be your go to option for all upcoming conferences and meetings. So, what are you waiting for Grab this template today.
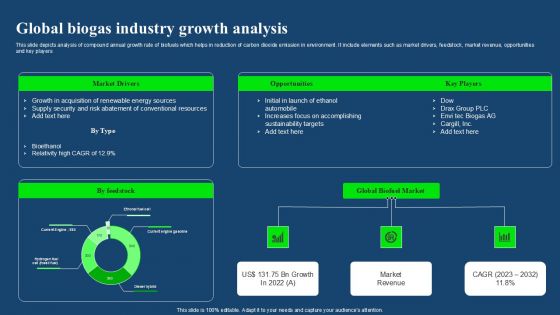
Global Biogas Industry Growth Analysis Download PDF
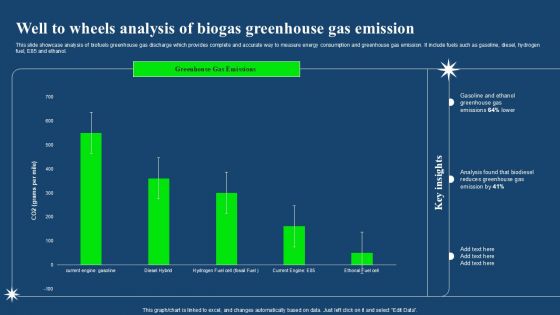
Well To Wheels Analysis Of Biogas Greenhouse Gas Emission Clipart PDF
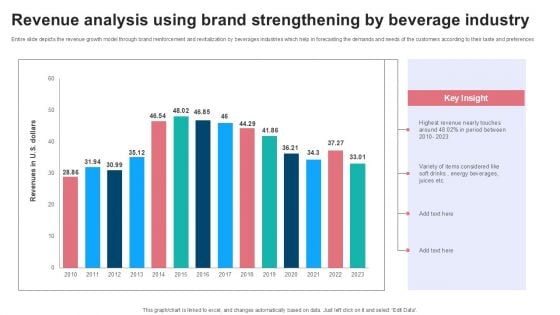
Revenue Analysis Using Brand Strengthening By Beverage Industry Microsoft PDF
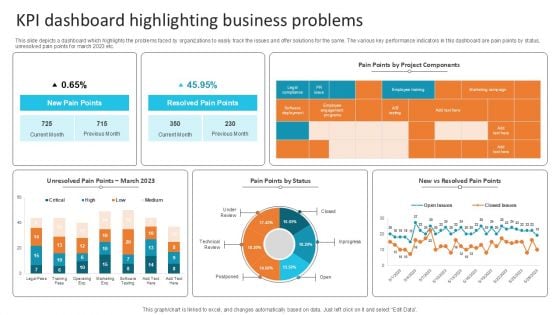
KPI Dashboard Highlighting Business Problems Microsoft PDF
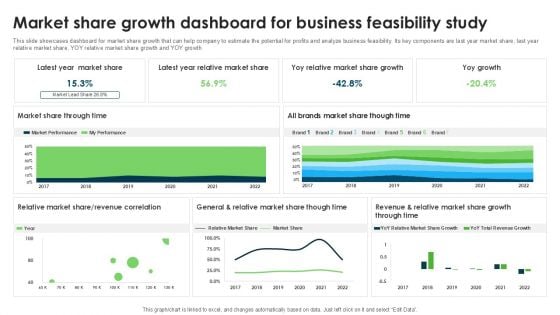
Market Share Growth Dashboard For Business Feasibility Study Demonstration PDF
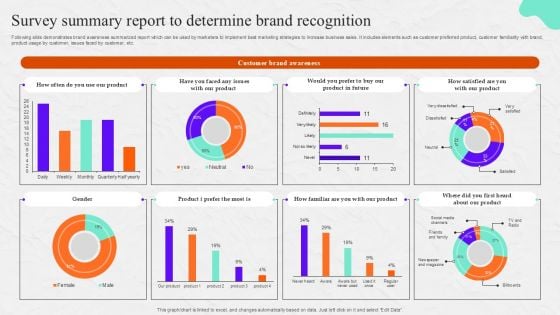
Survey Summary Report To Determine Brand Recognition Survey SS
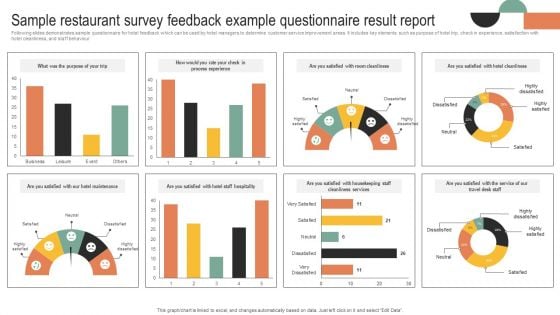
Sample Restaurant Survey Feedback Example Questionnaire Result Report Survey SS
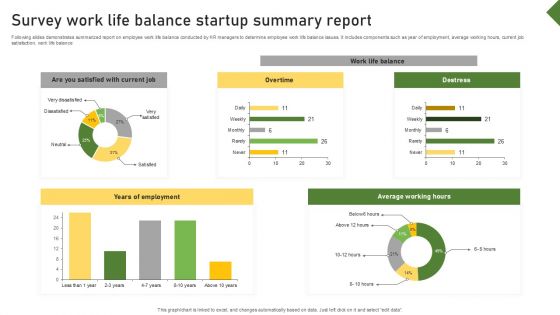
Survey Work Life Balance Startup Summary Report Survey SS
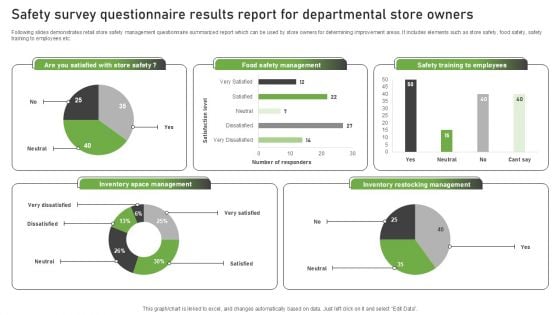
Safety Survey Questionnaire Results Report For Departmental Store Owners Survey SS
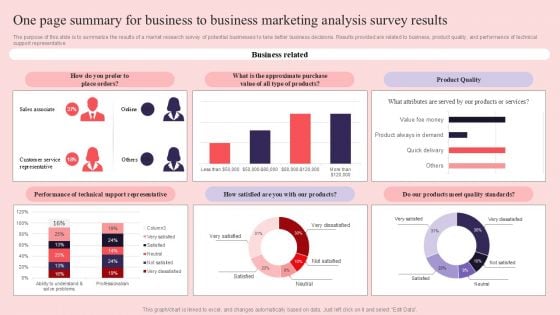
One Page Summary For Business To Business Marketing Analysis Survey Results Survey SS
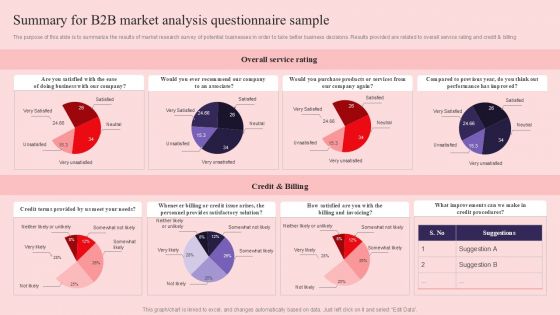
Summary For B2B Market Analysis Questionnaire Sample Survey SS
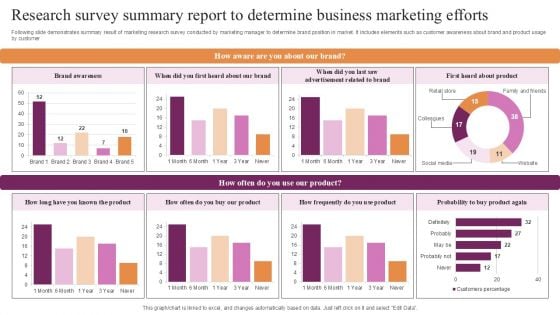
Research Survey Summary Report To Determine Business Marketing Efforts Survey SS
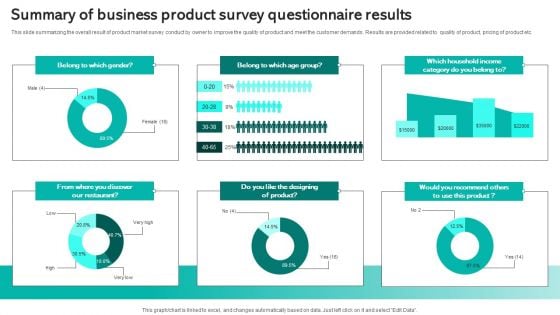
Summary Of Business Product Survey Questionnaire Results Survey SS
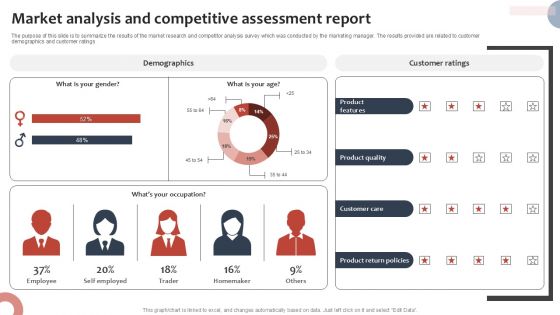
Market Analysis And Competitive Assessment Report Survey SS
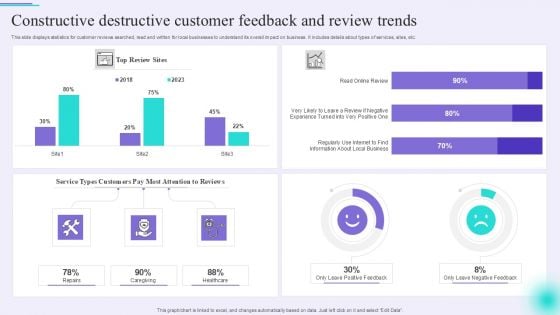
Constructive Destructive Customer Feedback And Review Trends Designs PDF
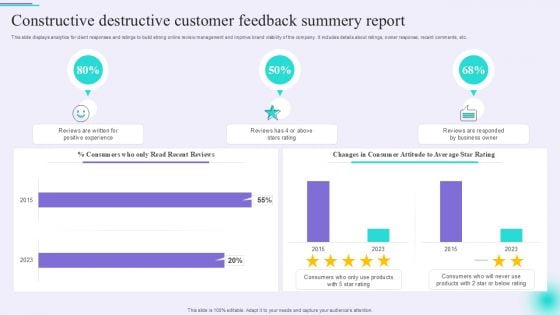
Constructive Destructive Customer Feedback Summery Report Inspiration PDF
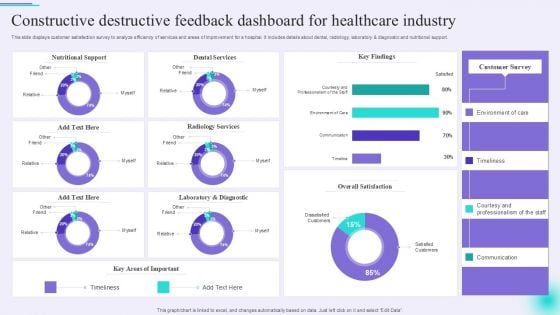
Constructive Destructive Feedback Dashboard For Healthcare Industry Guidelines PDF
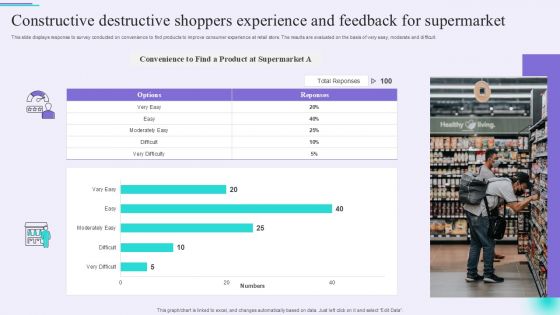
Constructive Destructive Shoppers Experience And Feedback For Supermarket Clipart PDF
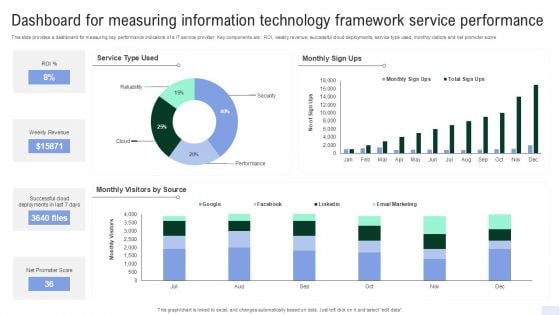
Dashboard For Measuring Information Technology Framework Service Performance Ideas PDF
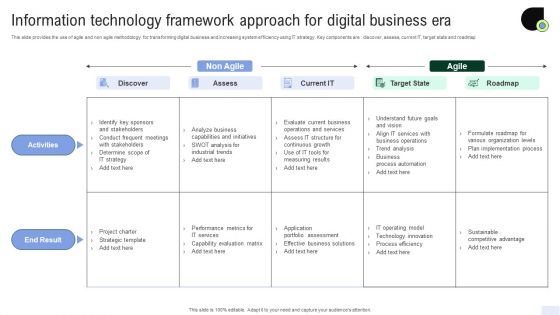
Information Technology Framework Approach For Digital Business Era Structure PDF
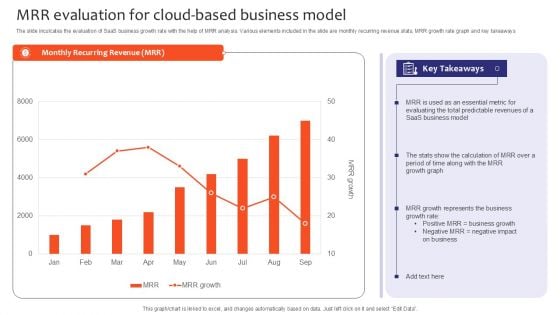
MRR Evaluation For Cloud Based Business Model Slides PDF
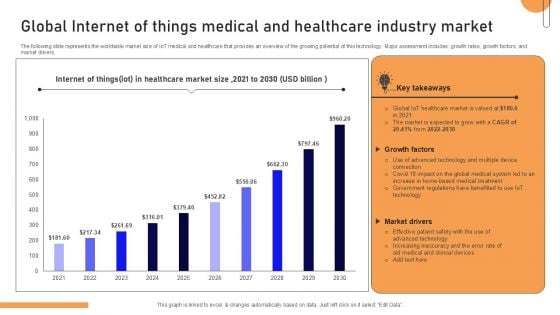
Global Internet Of Things Medical And Healthcare Industry Market Summary PDF
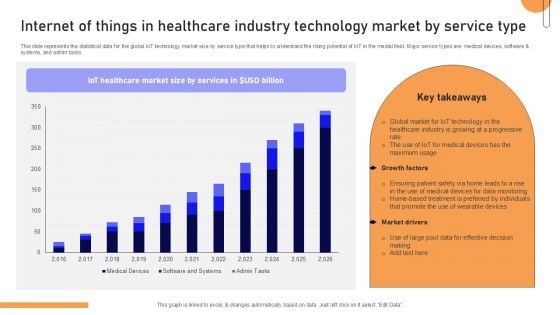
Internet Of Things In Healthcare Industry Technology Market By Service Type Background PDF
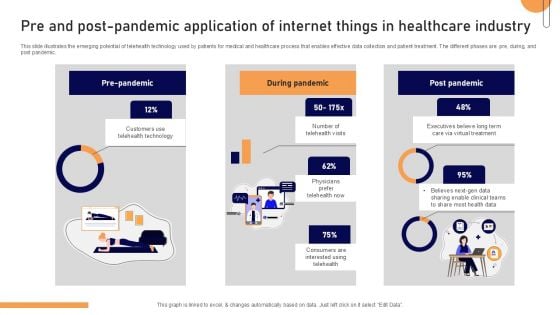
Pre And Post Pandemic Application Of Internet Things In Healthcare Industry Ideas PDF
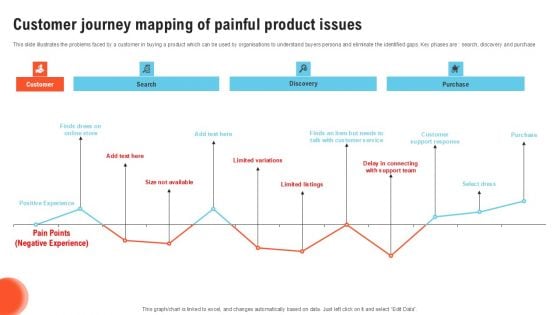
Customer Journey Mapping Of Painful Product Issues Portrait PDF
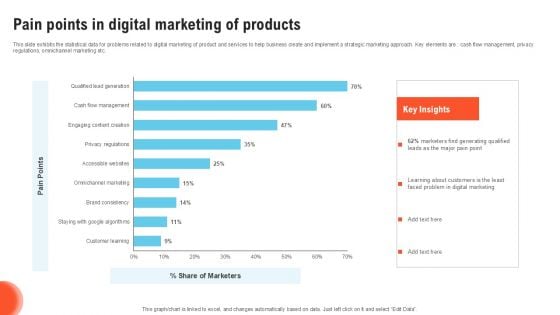
Pain Points In Digital Marketing Of Products Graphics PDF
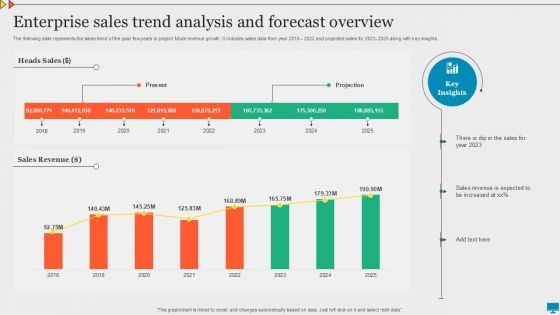
Enterprise Sales Trend Analysis And Forecast Overview Summary PDF
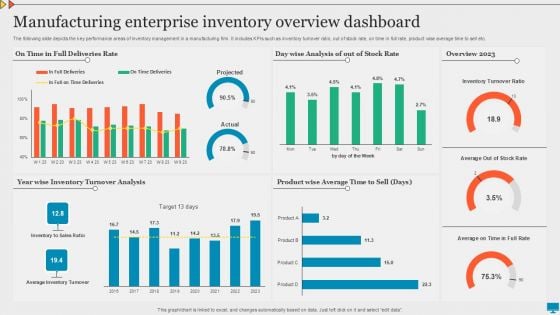
Manufacturing Enterprise Inventory Overview Dashboard Graphics PDF
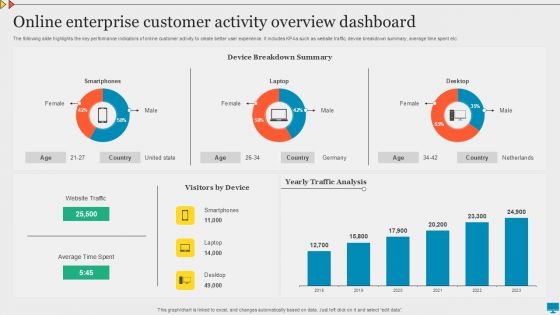
Online Enterprise Customer Activity Overview Dashboard Download PDF
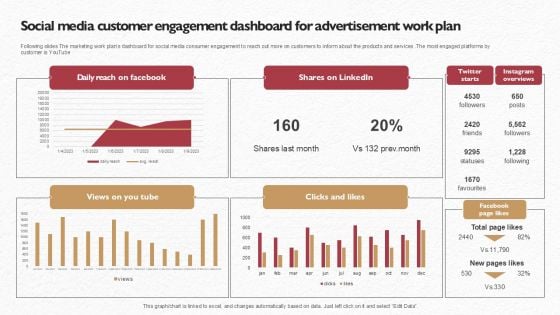
Social Media Customer Engagement Dashboard For Advertisement Work Plan Clipart PDF
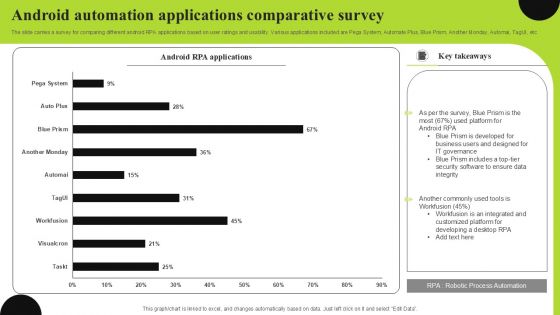
Android Automation Applications Comparative Survey Pictures PDF
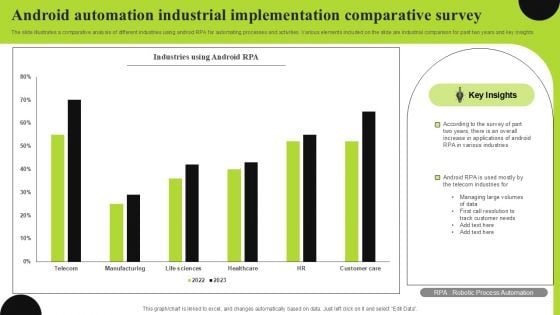
Android Automation Industrial Implementation Comparative Survey Formats PDF
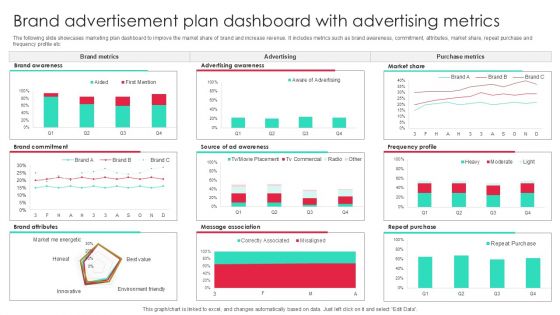
Brand Advertisement Plan Dashboard With Advertising Metrics Inspiration PDF
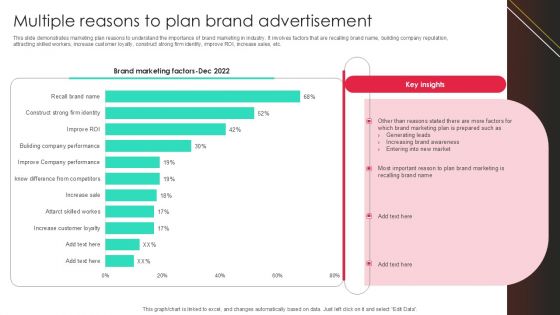
Multiple Reasons To Plan Brand Advertisement Clipart PDF
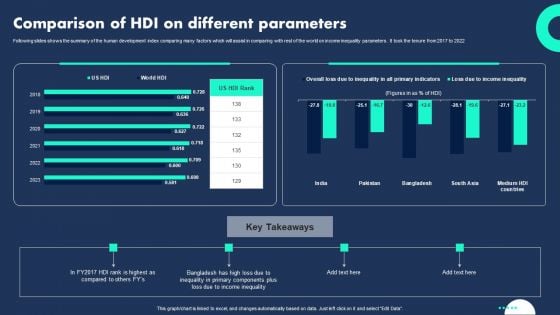
Comparison Of HDI On Different Parameters Diagrams PDF
Following slides shows the summary of the human development index comparing many factors which will assist in comparing with rest of the world on income inequality parameters . It took the tenure from 2017 to 2022. Showcasing this set of slides titled Comparison Of HDI On Different Parameters Diagrams PDF. The topics addressed in these templates are Inequality Primary Components, Plus Loss Income Inequality, Different Parameters . All the content presented in this PPT design is completely editable. Download it and make adjustments in color, background, font etc. as per your unique business setting.
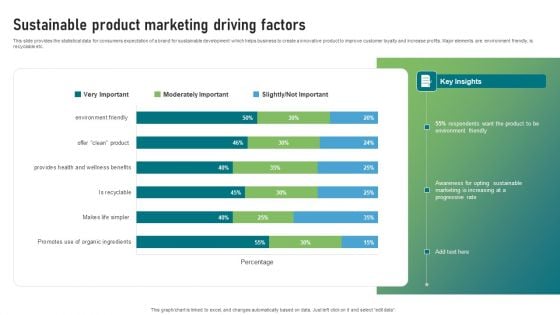
Sustainable Product Marketing Driving Factors Clipart PDF
This slide provides the statistical data for consumers expectation of a brand for sustainable development which helps business to create a innovative product to improve customer loyalty and increase profits. Major elements are environment friendly, is recyclable etc. Showcasing this set of slides titled Sustainable Product Marketing Driving Factors Clipart PDF. The topics addressed in these templates are Respondents, Environment Friendly, Awareness For Opting Sustainable. All the content presented in this PPT design is completely editable. Download it and make adjustments in color, background, font etc. as per your unique business setting.
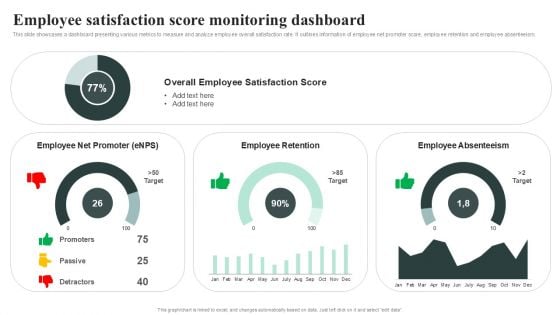
Employee Satisfaction Score Monitoring Dashboard Topics PDF
Dashboard For Enterprise Recruitment With Time To Hire And Fill Icons PDF
In this slide corporate staffing dashboard highlights important recruitment KPIs to review application trends and candidate response to job vacancy. It further includes details about application, review, assessment, interview, etc. Showcasing this set of slides titled Dashboard For Enterprise Recruitment With Time To Hire And Fill Icons PDF. The topics addressed in these templates are Key Metrics, Experienced Ratio, Applicants. All the content presented in this PPT design is completely editable. Download it and make adjustments in color, background, font etc. as per your unique business setting.
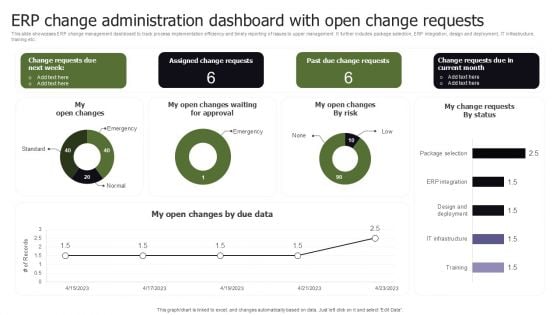
ERP Change Administration Dashboard With Open Change Requests Wd Topics PDF
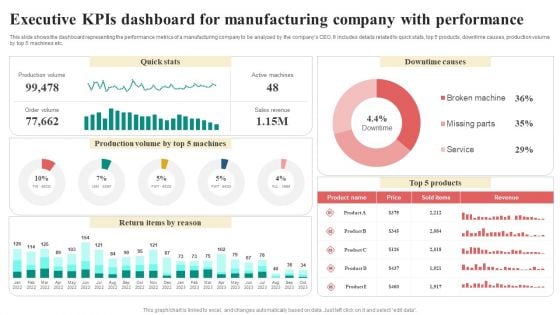
Executive Kpis Dashboard For Manufacturing Company With Performance Infographics PDF
This slide shows the dashboard representing the performance metrics of a manufacturing company to be analyzed by the companys CEO. It includes details related to quick stats, top 5 products, downtime causes, production volume by top 5 machines etc. Showcasing this set of slides titled Executive Kpis Dashboard For Manufacturing Company With Performance Infographics PDF. The topics addressed in these templates are Return Items By Reason, Quick Stats, Downtime Causes, Revenue. All the content presented in this PPT design is completely editable. Download it and make adjustments in color, background, font etc. as per your unique business setting.
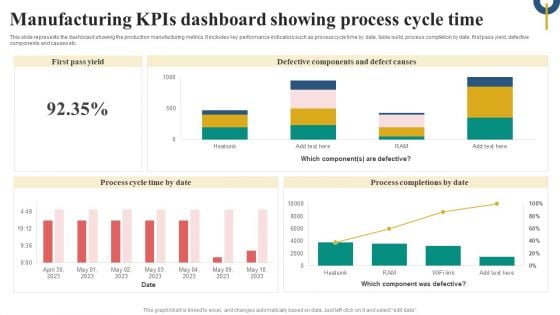
Manufacturing Kpis Dashboard Showing Process Cycle Time Microsoft PDF
This slide represents the dashboard showing the production manufacturing metrics. It includes key performance indicators such as process cycle time by date, table build, process completion by date, first pass yield, defective components and causes etc. Pitch your topic with ease and precision using this Manufacturing Kpis Dashboard Showing Process Cycle Time Microsoft PDF. This layout presents information on Defective Components Defect Causes, Process Cycle, Time By Date, Process Completions By Date. It is also available for immediate download and adjustment. So, changes can be made in the color, design, graphics or any other component to create a unique layout.
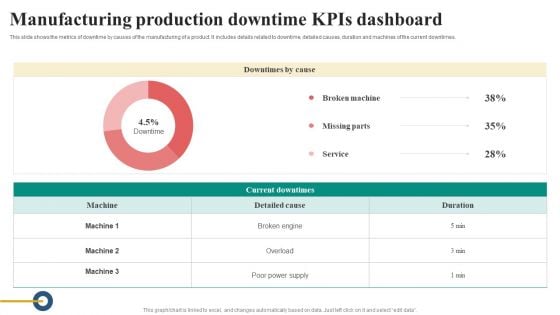
Manufacturing Production Downtime Kpis Dashboard Diagrams PDF
This slide shows the metrics of downtime by causes of the manufacturing of a product. It includes details related to downtime, detailed causes, duration and machines of the current downtimes. Pitch your topic with ease and precision using this Manufacturing Production Downtime Kpis Dashboard Diagrams PDF. This layout presents information on Details Related To Downtime, Detailed Causes, Duration And Machines, Current Downtimes. It is also available for immediate download and adjustment. So, changes can be made in the color, design, graphics or any other component to create a unique layout.
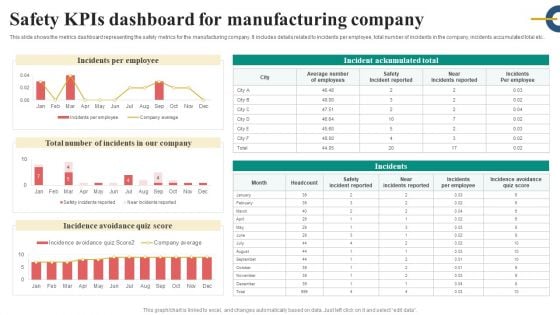
Safety Kpis Dashboard For Manufacturing Company Slides PDF
This slide shows the metrics dashboard representing the safety metrics for the manufacturing company. It includes details related to incidents per employee, total number of incidents in the company, incidents accumulated total etc.. Pitch your topic with ease and precision using this Safety Kpis Dashboard For Manufacturing Company Slides PDF. This layout presents information on Incidents Per Employee, Safety Incident Reported, Incidence Avoidance Quiz Score. It is also available for immediate download and adjustment. So, changes can be made in the color, design, graphics or any other component to create a unique layout.
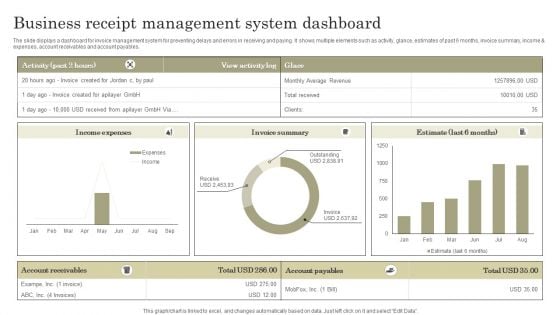
Business Receipt Management System Dashboard Portrait PDF
The slide displays a dashboard for invoice management system for preventing delays and errors in receiving and paying. It shows multiple elements such as activity, glance, estimates of past 6 months, invoice summary, income and expenses, account receivables and account payables. Showcasing this set of slides titled Business Receipt Management System Dashboard Portrait PDF. The topics addressed in these templates are Income expenses, Invoice summary, Estimate. All the content presented in this PPT design is completely editable. Download it and make adjustments in color, background, font etc. as per your unique business setting.
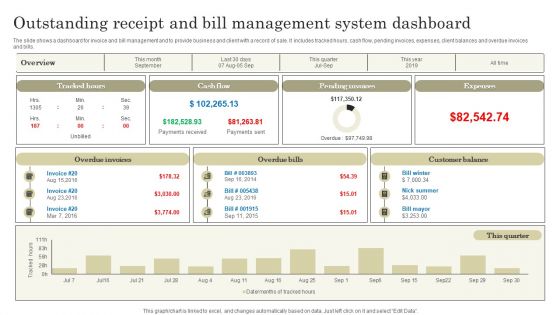
Outstanding Receipt And Bill Management System Dashboard Pictures PDF
The slide shows a dashboard for invoice and bill management and to provide business and client with a record of sale. It includes tracked hours, cash flow, pending invoices, expenses, client balances and overdue invoices and bills. Showcasing this set of slides titled Outstanding Receipt And Bill Management System Dashboard Pictures PDF. The topics addressed in these templates are Tracked hours, Cash flow, Pending invoices, Expenses. All the content presented in this PPT design is completely editable. Download it and make adjustments in color, background, font etc. as per your unique business setting.
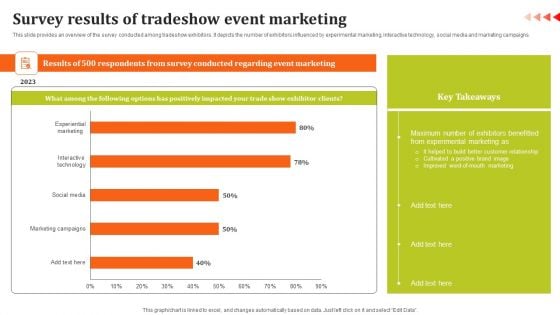
Survey Results Of Tradeshow Event Marketing Diagrams PDF
This slide provides an overview of the survey conducted among tradeshow exhibitors. It depicts the number of exhibitors influenced by experimental marketing, interactive technology, social media and marketing campaigns. Get a simple yet stunning designed Survey Results Of Tradeshow Event Marketing Diagrams PDF. It is the best one to establish the tone in your meetings. It is an excellent way to make your presentations highly effective. So, download this PPT today from Slidegeeks and see the positive impacts. Our easy to edit Survey Results Of Tradeshow Event Marketing Diagrams PDF can be your go to option for all upcoming conferences and meetings. So, what are you waiting for Grab this template today.
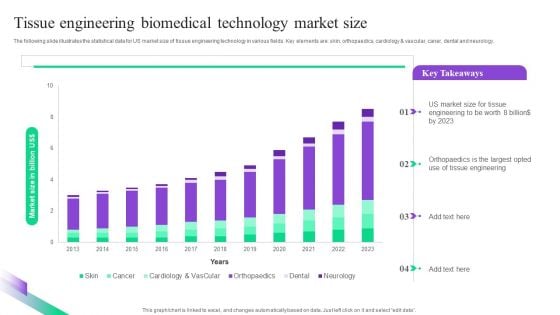
Tissue Engineering Biomedical Technology Market Size Summary PDF
The following slide illustrates the statistical data for US market size of tissue engineering technology in various fields. Key elements are skin, orthopaedics, cardiology and vascular, caner, dental and neurology. Pitch your topic with ease and precision using this Tissue Engineering Biomedical Technology Market Size Summary PDF. This layout presents information on Tissue, Engineering, Market Size. It is also available for immediate download and adjustment. So, changes can be made in the color, design, graphics or any other component to create a unique layout.

Call Center Kpis Agent Performance Dashboard Clipart PDF
This slide covers contact center agent performance metrics KPI dashboard. It involves metrics such as number of calls, average response time, average hold time, daily average transfer rate and agents with most hold time and transfer rate. Showcasing this set of slides titled Call Center Kpis Agent Performance Dashboard Clipart PDF. The topics addressed in these templates are Transfer Rate, Call Center, Hold Time. All the content presented in this PPT design is completely editable. Download it and make adjustments in color, background, font etc. as per your unique business setting.
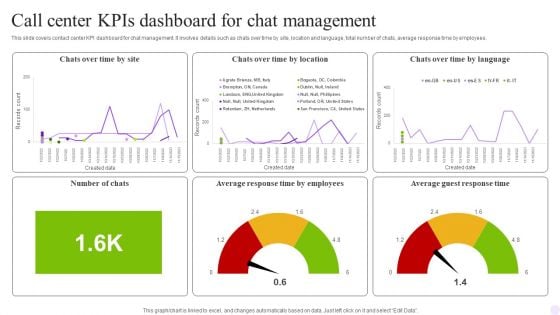
Call Center Kpis Dashboard For Chat Management Graphics PDF
This slide covers contact center KPI dashboard for chat management. It involves details such as chats over time by site, location and language, total number of chats, average response time by employees. Showcasing this set of slides titled Call Center Kpis Dashboard For Chat Management Graphics PDF. The topics addressed in these templates are Management, Employees, Chats. All the content presented in this PPT design is completely editable. Download it and make adjustments in color, background, font etc. as per your unique business setting.
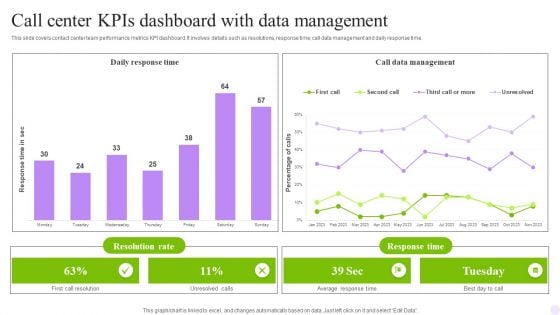
Call Center Kpis Dashboard With Data Management Infographics PDF
This slide covers contact center metrics KPI dashboard with call data details. It involves details such as total number of contacts handled, product sales, repeated calls and contact handles per day. Pitch your topic with ease and precision using this Call Center Kpis Dashboard With Data Management Infographics PDF. This layout presents information on Achieved, Contacts Handled, Repeated Calls. It is also available for immediate download and adjustment. So, changes can be made in the color, design, graphics or any other component to create a unique layout.
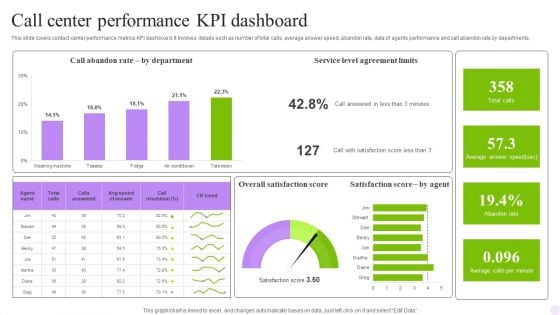
Call Center Performance KPI Dashboard Formats PDF
This slide covers contact center performance metrics KPI dashboard. It involves details such as number of total calls, average answer speed, abandon rate, data of agents performance and call abandon rate by departments. Showcasing this set of slides titled Call Center Performance KPI Dashboard Formats PDF. The topics addressed in these templates are Department, Dashboard, Agreement Limits. All the content presented in this PPT design is completely editable. Download it and make adjustments in color, background, font etc. as per your unique business setting.
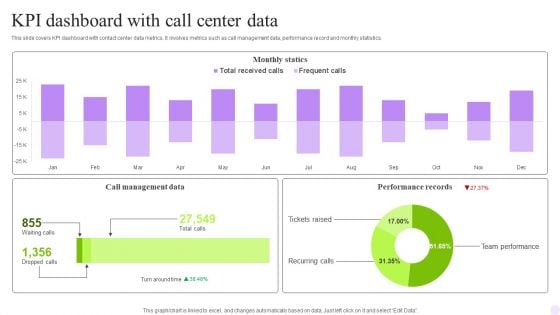
KPI Dashboard With Call Center Data Rules PDF
This slide covers contact center performance metrics KPI dashboard. It involves details such as number of total calls, average answer speed, abandon rate, data of agents performance and call abandon rate by departments. Pitch your topic with ease and precision using this KPI Dashboard With Call Center Data Rules PDF. This layout presents information on Monthly Statics, Management Data, Performance Records. It is also available for immediate download and adjustment. So, changes can be made in the color, design, graphics or any other component to create a unique layout.
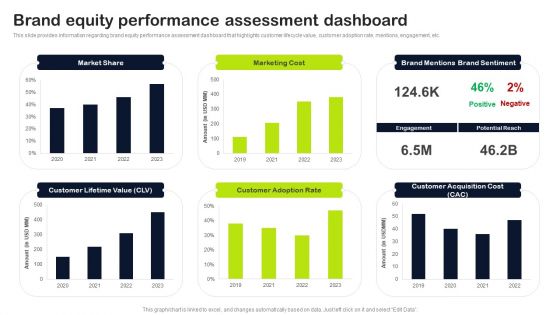
Key Elements Of Strategic Brand Administration Brand Equity Performance Assessment Dashboard Elements PDF
This slide provides information regarding brand equity performance assessment dashboard that highlights customer lifecycle value, customer adoption rate, mentions, engagement, etc. Get a simple yet stunning designed Key Elements Of Strategic Brand Administration Brand Equity Performance Assessment Dashboard Elements PDF. It is the best one to establish the tone in your meetings. It is an excellent way to make your presentations highly effective. So, download this PPT today from Slidegeeks and see the positive impacts. Our easy-to-edit Key Elements Of Strategic Brand Administration Brand Equity Performance Assessment Dashboard Elements PDF can be your go-to option for all upcoming conferences and meetings. So, what are you waiting for Grab this template today.


 Continue with Email

 Home
Home


