Banking Technology
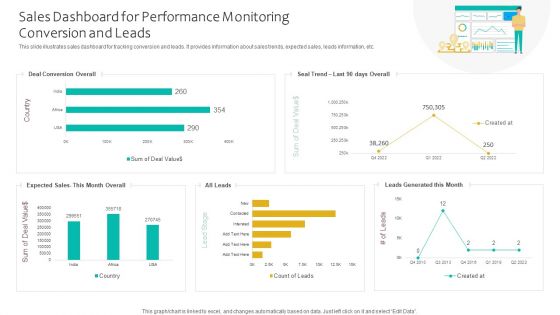
Sales Dashboard For Performance Monitoring Conversion And Leads Ppt Infographics Smartart PDF
This slide illustrates sales dashboard for tracking conversion and leads. It provides information about sales trends, expected sales, leads information, etc. Showcasing this set of slides titled Sales Dashboard For Performance Monitoring Conversion And Leads Ppt Infographics Smartart PDF. The topics addressed in these templates are Deal Conversion Overall, Expected Sales, Leads Generated. All the content presented in this PPT design is completely editable. Download it and make adjustments in color, background, font etc. as per your unique business setting.
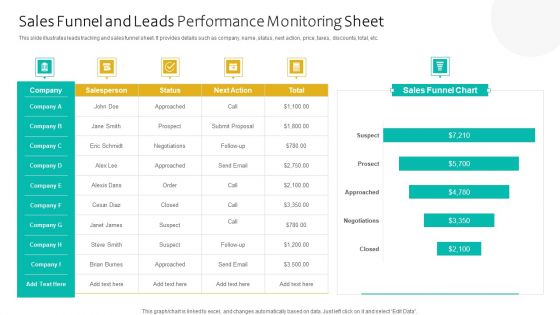
Sales Funnel And Leads Performance Monitoring Sheet Ppt Professional Tips PDF
This slide illustrates leads tracking and sales funnel sheet. It provides details such as company, name, status, next action, price, taxes, discounts, total, etc. Showcasing this set of slides titled Sales Funnel And Leads Performance Monitoring Sheet Ppt Professional Tips PDF. The topics addressed in these templates are Sales Funnel Chart, Salesperson, Next Action. All the content presented in this PPT design is completely editable. Download it and make adjustments in color, background, font etc. as per your unique business setting.
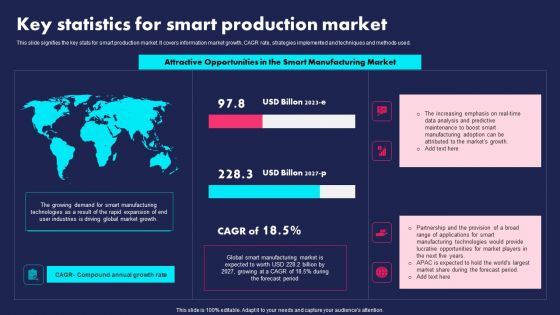
Key Statistics For Smart Production Market Ppt PowerPoint Presentation File Inspiration PDF
This slide signifies the key stats for smart production market. It covers information market growth, CAGR rate, strategies implemented and techniques and methods used. Showcasing this set of slides titled Key Statistics For Smart Production Market Ppt PowerPoint Presentation File Inspiration PDF. The topics addressed in these templates are Attractive Opportunities, Smart Manufacturing Market, Global. All the content presented in this PPT design is completely editable. Download it and make adjustments in color, background, font etc. as per your unique business setting.

Asset Assessment Dashboard With Cash Flow And Market Value Summary PDF
This slide illustrates asset valuation dashboard with key financial metrics. It provides information about cash flow, market value, intrinsic value, assumptions, market cap, discount rate, etc.Showcasing this set of slides titled Asset Assessment Dashboard With Cash Flow And Market Value Summary PDF. The topics addressed in these templates are Discount Rate, Capital Expenditure, Market Capitalization. All the content presented in this PPT design is completely editable. Download it and make adjustments in color, background, font etc. as per your unique business setting.
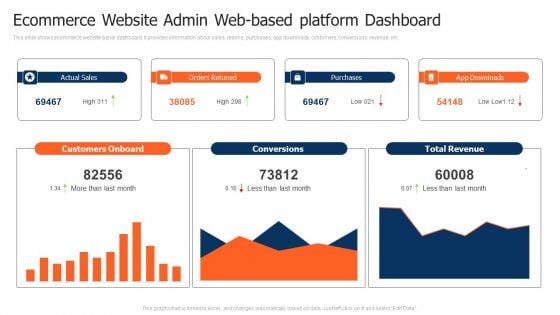
Ecommerce Website Admin Web Based Platform Dashboard Pictures PDF
This slide shows ecommerce website panel dashboard. It provides information about sales, returns, purchases, app downloads, customers, conversions, revenue, etc. Pitch your topic with ease and precision using this Ecommerce Website Admin Web Based Platform Dashboard Pictures PDF. This layout presents information on Customers Onboard, Purchases, Total Revenue. It is also available for immediate download and adjustment. So, changes can be made in the color, design, graphics or any other component to create a unique layout.
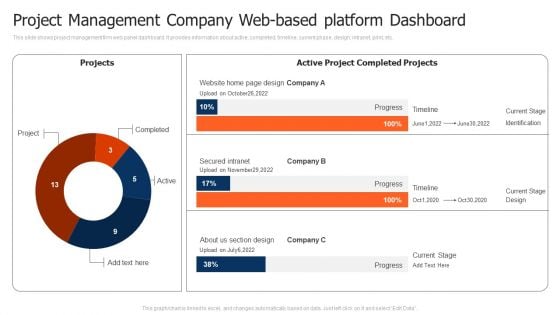
Project Management Company Web Based Platform Dashboard Clipart PDF
This slide shows project management firm web panel dashboard. It provides information about active, completed, timeline, current phase, design, intranet, print, etc. Showcasing this set of slides titled Project Management Company Web Based Platform Dashboard Clipart PDF. The topics addressed in these templates are Secured Intranet, Section Design, Timeline. All the content presented in this PPT design is completely editable. Download it and make adjustments in color, background, font etc. as per your unique business setting.
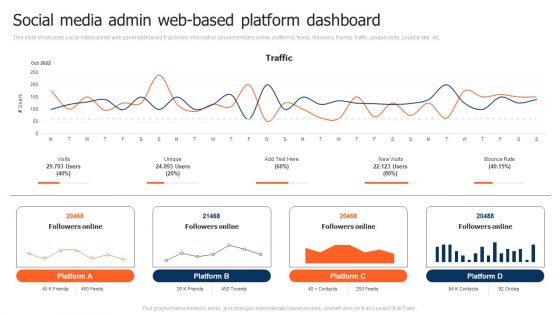
Social Media Admin Web Based Platform Dashboard Demonstration PDF
This slide showcases social media admin web panel dashboard. It provides information about members online, platforms, feeds, followers, friends, traffic, unique visits, bounce rate, etc. Showcasing this set of slides titled Social Media Admin Web Based Platform Dashboard Demonstration PDF. The topics addressed in these templates are Social Media Admin, Web Based Platform Dashboard. All the content presented in this PPT design is completely editable. Download it and make adjustments in color, background, font etc. as per your unique business setting.
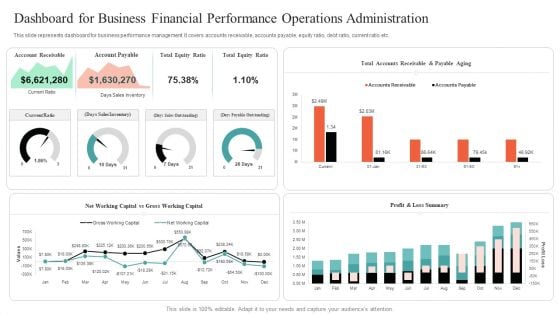
Dashboard For Business Financial Performance Operations Administration Mockup PDF
This slide represents dashboard for business performance management. It covers accounts receivable, accounts payable, equity ratio, debt ratio, current ratio etc. Showcasing this set of slides titled Dashboard For Business Financial Performance Operations Administration Mockup PDF. The topics addressed in these templates are Dashboard For Business Financial, Performance Operations Administration. All the content presented in this PPT design is completely editable. Download it and make adjustments in color, background, font etc. as per your unique business setting.
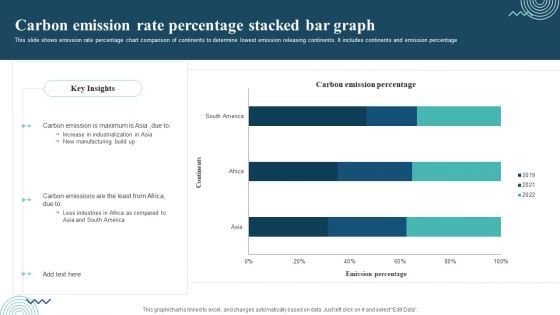
Carbon Emission Rate Percentage Stacked Bar Graph Rules PDF
This slide shows emission rate percentage chart comparison of continents to determine lowest emission releasing continents. It includes continents and emission percentage Showcasing this set of slides titled Carbon Emission Rate Percentage Stacked Bar Graph Rules PDF. The topics addressed in these templates are Carbon Emission, Increase In Industrialization, New Manufacturing. All the content presented in this PPT design is completely editable. Download it and make adjustments in color, background, font etc. as per your unique business setting.

Carbon Emissions Of Countries Bar Graph Professional PDF
This slide depicts emissions chart of various countries to avoid the worst impacts of climate change. It includes countries and carbon emissions in million metric tons. Pitch your topic with ease and precision using this Carbon Emissions Of Countries Bar Graph Professional PDF. This layout presents information on Maximum Production, Consumer Goods, Carbon Emissions. It is also available for immediate download and adjustment. So, changes can be made in the color, design, graphics or any other component to create a unique layout.
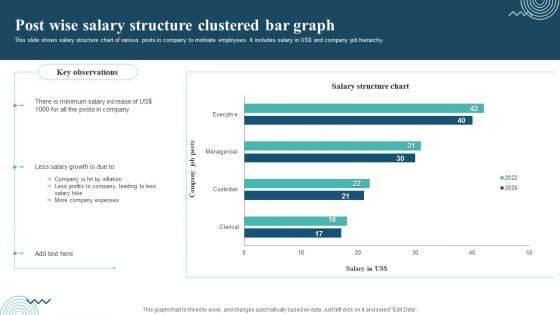
Post Wise Salary Structure Clustered Bar Graph Professional PDF
This slide shows salary structure chart of various posts in company to motivate employees. It includes salary in US dollar and company job hierarchy. Showcasing this set of slides titled Post Wise Salary Structure Clustered Bar Graph Professional PDF. The topics addressed in these templates are Minimum Salary Increase, Less Salary Growth, Company Expenses. All the content presented in this PPT design is completely editable. Download it and make adjustments in color, background, font etc. as per your unique business setting.
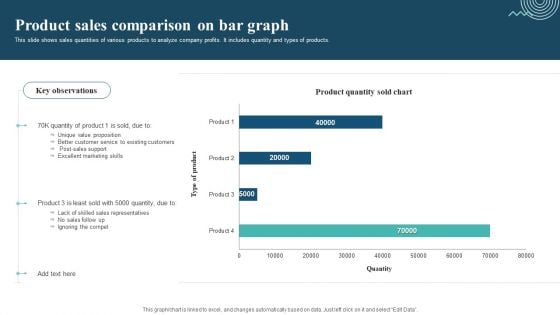
Product Sales Comparison On Bar Graph Sample PDF
This slide shows sales quantities of various products to analyze company profits. It includes quantity and types of products. Pitch your topic with ease and precision using this Product Sales Comparison On Bar Graph Sample PDF. This layout presents information on Unique Value Proposition, Excellent Marketing Skills, Ignoring The Compet. It is also available for immediate download and adjustment. So, changes can be made in the color, design, graphics or any other component to create a unique layout.
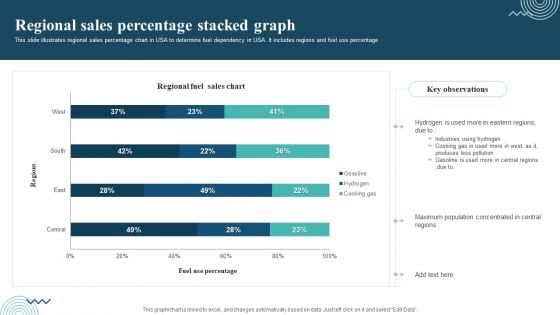
Regional Sales Percentage Stacked Graph Themes PDF
This slide illustrates regional sales percentage chart in USA to determine fuel dependency in USA. It includes regions and fuel use percentage. Pitch your topic with ease and precision using this Regional Sales Percentage Stacked Graph Themes PDF. This layout presents information on Regional Sales, Industries Using Hydrogen, Cooking Gas. It is also available for immediate download and adjustment. So, changes can be made in the color, design, graphics or any other component to create a unique layout.
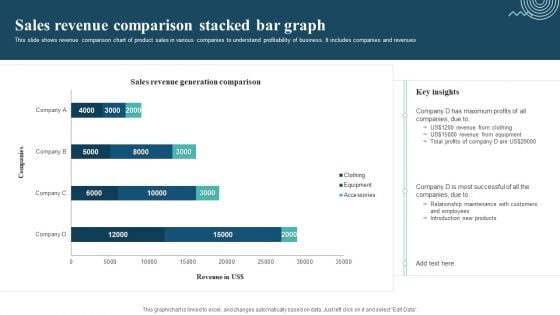
Sales Revenue Comparison Stacked Bar Graph Mockup PDF
This slide shows revenue comparison chart of product sales in various companies to understand profitability of business. It includes companies and revenues. Showcasing this set of slides titled Sales Revenue Comparison Stacked Bar Graph Mockup PDF. The topics addressed in these templates are Sales Revenue Comparison, Revenue From Clothing, Revenue From Equipment. All the content presented in this PPT design is completely editable. Download it and make adjustments in color, background, font etc. as per your unique business setting.
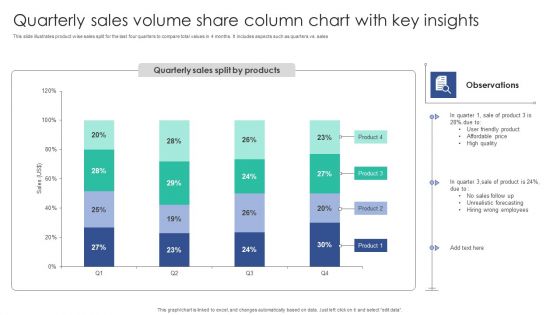
Quarterly Sales Volume Share Column Chart With Key Insights Structure PDF
This slide illustrates product wise sales split for the last four quarters to compare total values in 4 months. It includes aspects such as quarters vs. salesShowcasing this set of slides titled Quarterly Sales Volume Share Column Chart With Key Insights Structure PDF. The topics addressed in these templates are Unrealistic Forecasting, Wrong Employees, Friendly Product. All the content presented in this PPT design is completely editable. Download it and make adjustments in color, background, font etc. as per your unique business setting.
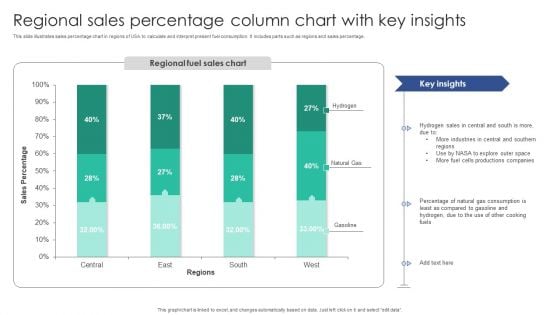
Regional Sales Percentage Column Chart With Key Insights Diagrams PDF
This slide illustrates sales percentage chart in regions of USA to calculate and interpret present fuel consumption. It includes parts such as regions and sales percentage.Pitch your topic with ease and precision using this Regional Sales Percentage Column Chart With Key Insights Diagrams PDF. This layout presents information on Industries Central, Sales Central, Productions Companies. It is also available for immediate download and adjustment. So, changes can be made in the color, design, graphics or any other component to create a unique layout.
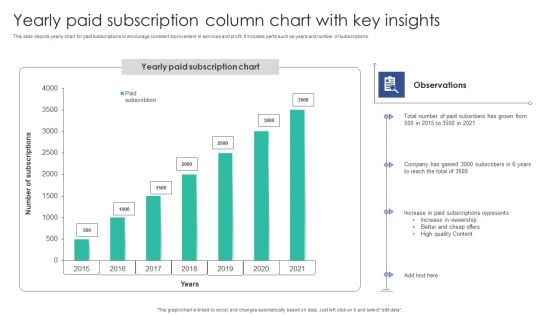
Yearly Paid Subscription Column Chart With Key Insights Microsoft PDF
This slide depicts yearly chart for paid subscriptions to encourage constant improvement in services and profit. It includes parts such as years and number of subscriptions.Showcasing this set of slides titled Yearly Paid Subscription Column Chart With Key Insights Microsoft PDF. The topics addressed in these templates are Paid Subscribers, Company Gained, Subscriptions Represents. All the content presented in this PPT design is completely editable. Download it and make adjustments in color, background, font etc. as per your unique business setting.
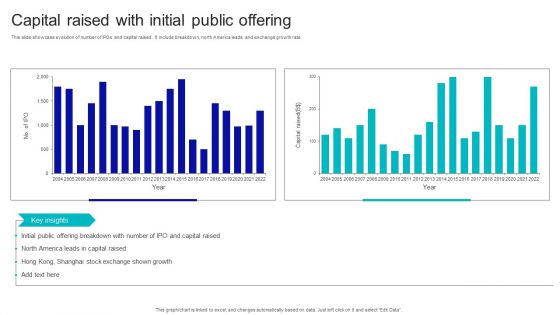
Capital Raised With Initial Public Offering Download PDF
This slide showcase evolution of number of IPOs and capital raised . It include breakdown, north America leads and exchange growth rate. Showcasing this set of slides titled Capital Raised With Initial Public Offering Download PDF. The topics addressed in these templates are Capital Raised, With Initial, Public Offering. All the content presented in this PPT design is completely editable. Download it and make adjustments in color, background, font etc. as per your unique business setting.
Employees Attrition Tracking Rate Stats Summary Report By Departments Slides PDF
This slide illustrates employees quarterly turnover rates for different departments. It also includes turnover rates on the basis of distinct positions and duration of retention in company. Showcasing this set of slides titled Employees Attrition Tracking Rate Stats Summary Report By Departments Slides PDF. The topics addressed in these templates are Employee Turnover, Involuntary. All the content presented in this PPT design is completely editable. Download it and make adjustments in color, background, font etc. as per your unique business setting.
HR Manager KPI Dashboard With Employee Attrition Tracking Report Brochure PDF
This slide covers performance key indicators for HR manager. It also indicates employee turnover count, new recruitment, retention, training and development of new employees. Showcasing this set of slides titled HR Manager KPI Dashboard With Employee Attrition Tracking Report Brochure PDF. The topics addressed in these templates are Recruitment, Employee Turnover, Development. All the content presented in this PPT design is completely editable. Download it and make adjustments in color, background, font etc. as per your unique business setting.
Parameters Impacting Employee Attrition Tracking Rates Report Sample PDF
This slide depicts key reasons for employee turnover rate. It includes career development, work-life balance, management behaviour, compensation, wellbeing, job characteristics, work environment, relocation and retirement. Showcasing this set of slides titled Parameters Impacting Employee Attrition Tracking Rates Report Sample PDF. The topics addressed in these templates are Parameters Impacting Employee, Attrition Tracking Rates Report. All the content presented in this PPT design is completely editable. Download it and make adjustments in color, background, font etc. as per your unique business setting.
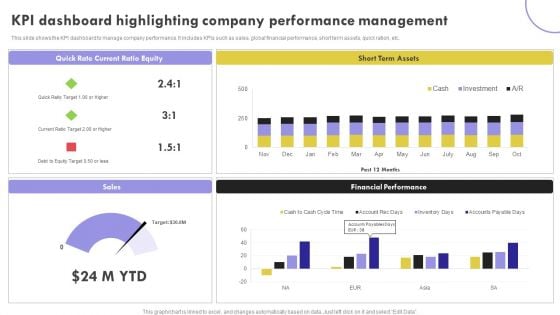
KPI Dashboard Highlighting Company Performance Management Inspiration PDF
This slide shows the KPI dashboard to manage company performance. It includes KPIs such as sales, global financial performance, short term assets, quick ration, etc.Showcasing this set of slides titled KPI Dashboard Highlighting Company Performance Management Inspiration PDF. The topics addressed in these templates are Current Ratio, Term Assets, Financial Performance. All the content presented in this PPT design is completely editable. Download it and make adjustments in color, background, font etc. as per your unique business setting.
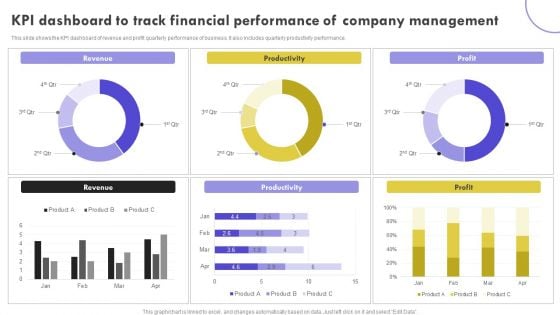
KPI Dashboard To Track Financial Performance Of Company Management Clipart PDF
This slide shows the KPI dashboard of revenue and profit quarterly performance of business. It also includes quarterly productivity performance. Pitch your topic with ease and precision using this KPI Dashboard To Track Financial Performance Of Company Management Clipart PDF. This layout presents information on Revenue, Productivity, Profit. It is also available for immediate download and adjustment. So, changes can be made in the color, design, graphics or any other component to create a unique layout.
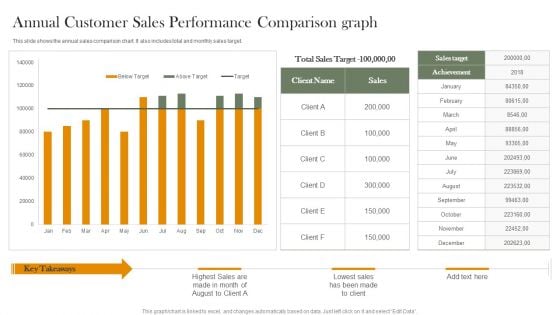
Annual Customer Sales Performance Comparison Graph Portrait PDF
This slide shows the annual sales comparison chart. It also includes total and monthly sales target. Pitch your topic with ease and precision using this Annual Customer Sales Performance Comparison Graph Portrait PDF. This layout presents information on Total Sales Target, Sales Target, Achievement. It is also available for immediate download and adjustment. So, changes can be made in the color, design, graphics or any other component to create a unique layout.
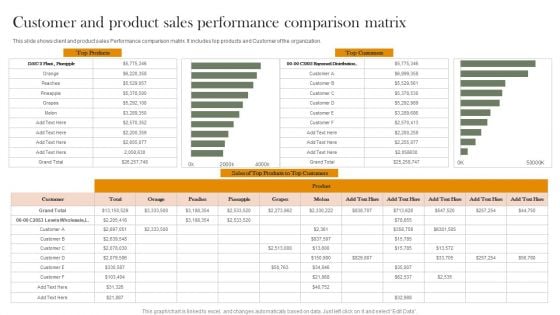
Customer And Product Sales Performance Comparison Matrix Introduction PDF
This slide shows client and product sales Performance comparison matrix. It includes top products and Customer of the organization. Showcasing this set of slides titled Customer And Product Sales Performance Comparison Matrix Introduction PDF. The topics addressed in these templates are Top Products, Top Customers, Sales. All the content presented in this PPT design is completely editable. Download it and make adjustments in color, background, font etc. as per your unique business setting.

KPI Dashboard Of Customer And Product Sales Performance Comparison Information PDF
This slide shows the KPI dashboard of client and product sales comparison. It also includes sales by location and total sales. Pitch your topic with ease and precision using this KPI Dashboard Of Customer And Product Sales Performance Comparison Information PDF. This layout presents information on Product Sales, Client Sales, Tim Santana. It is also available for immediate download and adjustment. So, changes can be made in the color, design, graphics or any other component to create a unique layout.
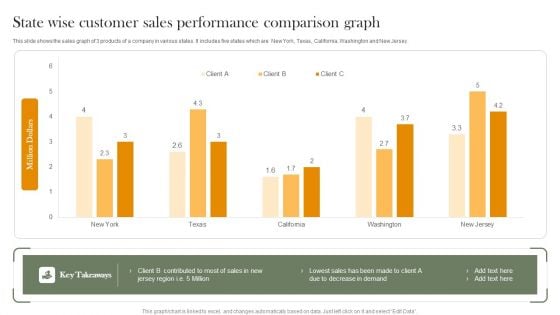
State Wise Customer Sales Performance Comparison Graph Introduction PDF
This slide shows the sales graph of 3 products of a company in various states. It includes five states which are New York, Texas, California, Washington and New Jersey. Showcasing this set of slides titled State Wise Customer Sales Performance Comparison Graph Introduction PDF. The topics addressed in these templates are Lowest Sales, Decrease Demand. All the content presented in this PPT design is completely editable. Download it and make adjustments in color, background, font etc. as per your unique business setting.
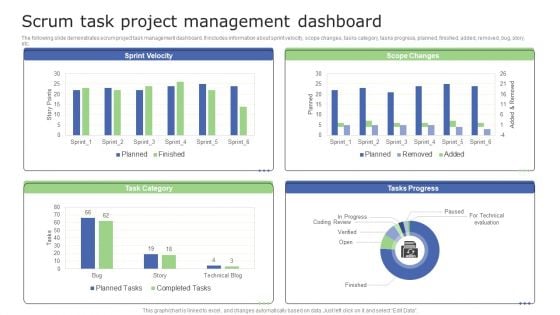
Scrum Task Project Management Dashboard Information PDF
The following slide demonstrates scrum project task management dashboard. It includes information about sprint velocity, scope changes, tasks category, tasks progress, planned, finished, added, removed, bug, story, etc. Pitch your topic with ease and precision using this Scrum Task Project Management Dashboard Information PDF. This layout presents information on Scrum Task Project, Management Dashboard. It is also available for immediate download and adjustment. So, changes can be made in the color, design, graphics or any other component to create a unique layout.
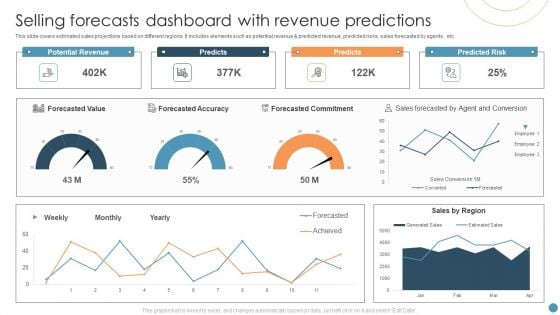
Selling Forecasts Dashboard With Revenue Predictions Elements PDF
This slide covers estimated sales projections based on different regions. It includes elements such as potential revenue and predicted revenue, predicted risks, sales forecasted by agents , etc. Showcasing this set of slides titled Selling Forecasts Dashboard With Revenue Predictions Elements PDF. The topics addressed in these templates are Forecasted Value, Potential Revenue, Predicted Risk. All the content presented in this PPT design is completely editable. Download it and make adjustments in color, background, font etc. as per your unique business setting.

Yearly Selling Forecasts Revenue Chart Summary PDF
This slide covers projections for yearly revenue generation from product sales. It includes forecasted revenue for different years and a graph depicting the projected sales revenue growth. Showcasing this set of slides titled Yearly Selling Forecasts Revenue Chart Summary PDF. The topics addressed in these templates are Project Sales Revenue, Forecasts Revenue Chart. All the content presented in this PPT design is completely editable. Download it and make adjustments in color, background, font etc. as per your unique business setting.
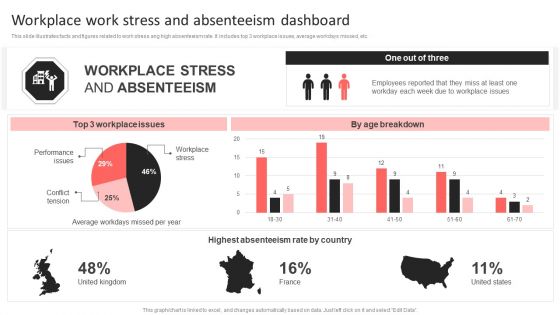
Workplace Work Stress And Absenteeism Dashboard Pictures PDF
This slide illustrates facts and figures related to work stress ang high absenteeism rate. It includes top 3 workplace issues, average workdays missed, etc.Showcasing this set of slides titled Workplace Work Stress And Absenteeism Dashboard Pictures PDF. The topics addressed in these templates are Employees Reported, Workplace Issues, Highest Absenteeism. All the content presented in this PPT design is completely editable. Download it and make adjustments in color, background, font etc. as per your unique business setting.
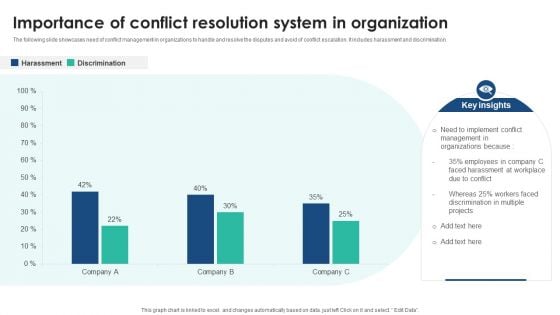
Importance Of Conflict Resolution System In Organization Demonstration PDF
The following slide showcases need of conflict management in organizations to handle and resolve the disputes and avoid of conflict escalation. It includes harassment and discrimination. Showcasing this set of slides titled Importance Of Conflict Resolution System In Organization Demonstration PDF. The topics addressed in these templates are Importance Of Conflict, Resolution System, Organization. All the content presented in this PPT design is completely editable. Download it and make adjustments in color, background, font etc. as per your unique business setting.
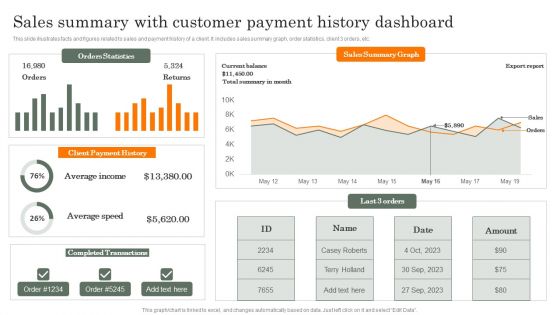
Sales Summary With Customer Payment History Dashboard Guidelines PDF
This slide illustrates facts and figures related to sales and payment history of a client. It includes sales summary graph, order statistics, client 3 orders, etc. Showcasing this set of slides titled Sales Summary With Customer Payment History Dashboard Guidelines PDF. The topics addressed in these templates are Average Income, Average Speed, Completed Transactions. All the content presented in this PPT design is completely editable. Download it and make adjustments in color, background, font etc. as per your unique business setting.
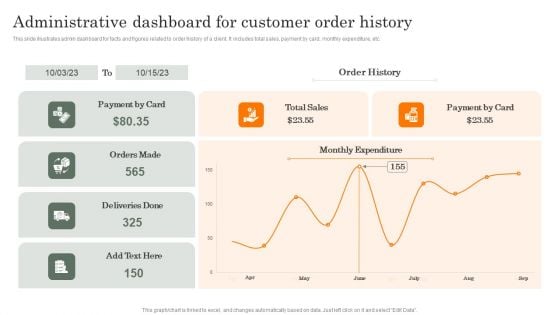
Administrative Dashboard For Customer Order History Formats PDF
This slide illustrates admin dashboard for facts and figures related to order history of a client. It includes total sales, payment by card, monthly expenditure, etc. Showcasing this set of slides titled Administrative Dashboard For Customer Order History Formats PDF. The topics addressed in these templates are Administrative, Dashboard For Customer, Order History. All the content presented in this PPT design is completely editable. Download it and make adjustments in color, background, font etc. as per your unique business setting.
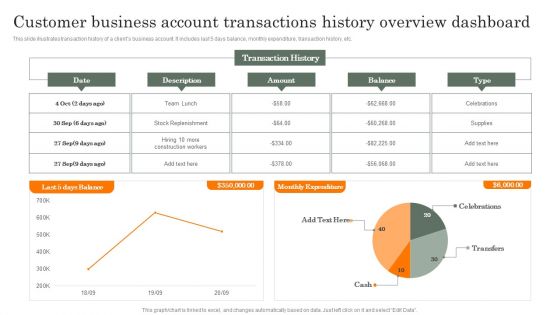
Customer Business Account Transactions History Overview Dashboard Guidelines PDF
This slide illustrates transaction history of a clients business account. It includes last 5 days balance, monthly expenditure, transaction history, etc. Showcasing this set of slides titled Customer Business Account Transactions History Overview Dashboard Guidelines PDF. The topics addressed in these templates are Customer Business, Account Transactions, History Overview. All the content presented in this PPT design is completely editable. Download it and make adjustments in color, background, font etc. as per your unique business setting.
Organization Demand Administration Kpis And Priorities Icons PDF
The below slide showcases the KPIs to enhance forecast accuracy and gain competitive advantage in demand management. It mainly constitutes of techniques, KPIs and priorities. Showcasing this set of slides titled Organization Demand Administration Kpis And Priorities Icons PDF. The topics addressed in these templates are Techniques To Advance, Demand Management. All the content presented in this PPT design is completely editable. Download it and make adjustments in color, background, font etc. as per your unique business setting.
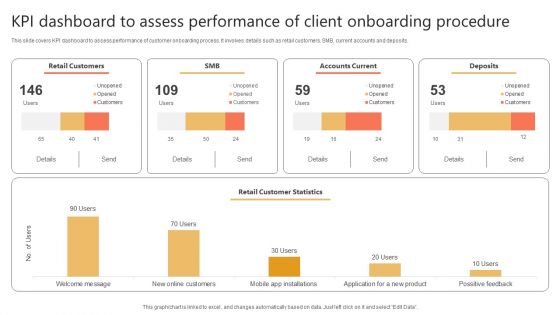
Kpi Dashboard To Assess Performance Of Client Onboarding Procedure Designs PDF
This slide covers KPI dashboard to assess performance of customer onboarding process. It involves details such as retail customers, SMB, current accounts and deposits. Showcasing this set of slides titled Kpi Dashboard To Assess Performance Of Client Onboarding Procedure Designs PDF. The topics addressed in these templates are Retail Customers, Accounts Current, Deposits. All the content presented in this PPT design is completely editable. Download it and make adjustments in color, background, font etc. as per your unique business setting.
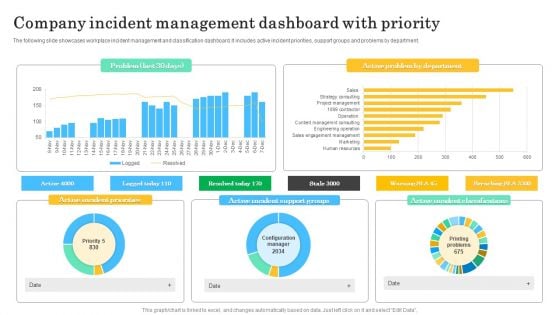
Company Incident Management Dashboard With Priority Microsoft PDF
The following slide showcases workplace incident management and classification dashboard. It includes active incident priorities, support groups and problems by department. Pitch your topic with ease and precision using this Company Incident Management Dashboard With Priority Microsoft PDF. This layout presents information on Active Incident Classifications, Active Incident Support, Active Incident Priorities . It is also available for immediate download and adjustment. So, changes can be made in the color, design, graphics or any other component to create a unique layout.
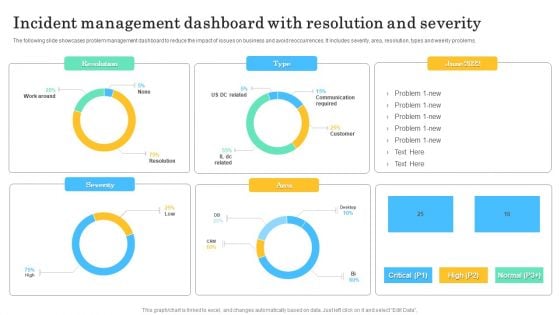
Incident Management Dashboard With Resolution And Severity Guidelines PDF
The following slide showcases problem management dashboard to reduce the impact of issues on business and avoid reoccurrences. It includes severity, area, resolution, types and weekly problems. Pitch your topic with ease and precision using this Incident Management Dashboard With Resolution And Severity Guidelines PDF. This layout presents information on Resolution, Severity, Area. It is also available for immediate download and adjustment. So, changes can be made in the color, design, graphics or any other component to create a unique layout.
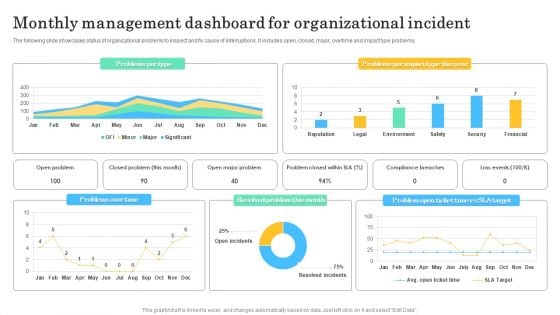
Monthly Management Dashboard For Organizational Incident Professional PDF
The following slide showcases status of organizational problems to inspect and fix cause of interruptions. It includes open, closed, major, overtime and impact type problems. Showcasing this set of slides titled Monthly Management Dashboard For Organizational Incident Professional PDF. The topics addressed in these templates are Problems Over Time, Resolved Problem Month. All the content presented in this PPT design is completely editable. Download it and make adjustments in color, background, font etc. as per your unique business setting.
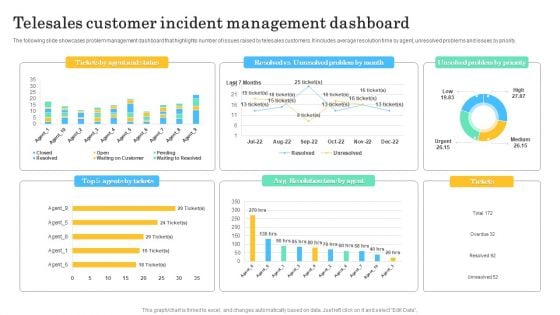
Telesales Customer Incident Management Dashboard Brochure PDF
The following slide showcases problem management dashboard that highlights number of issues raised by telesales customers. It includes average resolution time by agent, unresolved problems and issues by priority. Showcasing this set of slides titled Telesales Customer Incident Management Dashboard Brochure PDF. The topics addressed in these templates are Telesales Customer, Incident Management Dashboard. All the content presented in this PPT design is completely editable. Download it and make adjustments in color, background, font etc. as per your unique business setting.
Email Marketing Campaign Kpis Tracking Dashboard Graphics PDF
This slide shows key performance indicators KPI dashboard for measuring effectiveness of email campaigns. It provides information about sent, delivered, opens, clicks, unsubscribed, bounces, complaints, etc. Pitch your topic with ease and precision using this Email Marketing Campaign Kpis Tracking Dashboard Graphics PDF. This layout presents information on Email Marketing Campaign, Tracking Dashboard. It is also available for immediate download and adjustment. So, changes can be made in the color, design, graphics or any other component to create a unique layout.
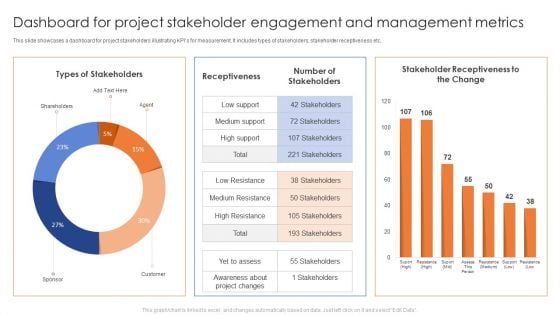
Dashboard For Project Stakeholder Engagement And Management Metrics Brochure PDF
This slide showcases a dashboard for project stakeholders illustrating KPIs for measurement. It includes types of stakeholders, stakeholder receptiveness etc. Pitch your topic with ease and precision using this Dashboard For Project Stakeholder Engagement And Management Metrics Brochure PDF. This layout presents information on Types Of Stakeholders, Receptiveness, Number Of Stakeholders. It is also available for immediate download and adjustment. So, changes can be made in the color, design, graphics or any other component to create a unique layout.
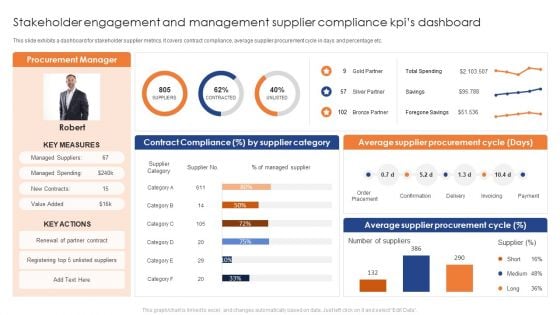
Stakeholder Engagement And Management Supplier Compliance Kpis Dashboard Pictures PDF
This slide exhibits a dashboard for stakeholder supplier metrics. It covers contract compliance, average supplier procurement cycle in days and percentage etc. Showcasing this set of slides titled Stakeholder Engagement And Management Supplier Compliance Kpis Dashboard Pictures PDF. The topics addressed in these templates are Average Supplier Procurement Cycle, Average Supplier Procurement Cycle . All the content presented in this PPT design is completely editable. Download it and make adjustments in color, background, font etc. as per your unique business setting.
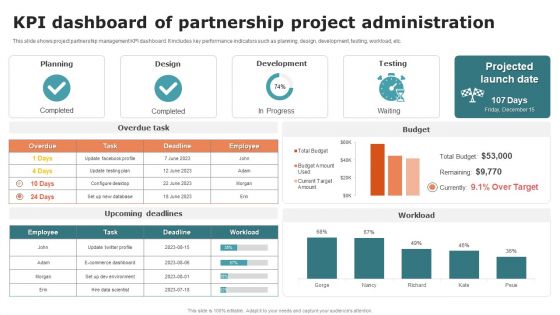
KPI Dashboard Of Partnership Project Administration Ideas PDF
This slide shows project partnership management KPI dashboard. It includes key performance indicators such as planning, design, development, testing, workload, etc. Showcasing this set of slides titled KPI Dashboard Of Partnership Project Administration Ideas PDF. The topics addressed in these templates are Planning, Design, Development. All the content presented in this PPT design is completely editable. Download it and make adjustments in color, background, font etc. as per your unique business setting.
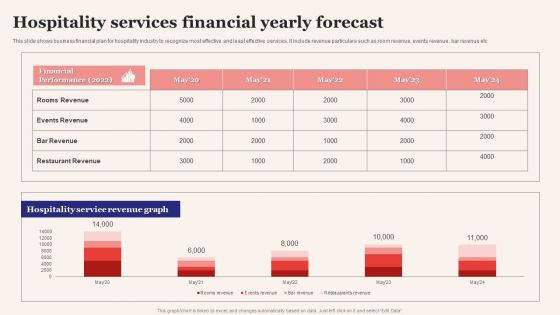
Hospitality Services Financial Yearly Forecast Elements PDF
This slide shows business financial plan for hospitality industry to recognize most effective and least effective services. It include revenue particulars such as room revenue, events revenue, bar revenue etc. Showcasing this set of slides titled Hospitality Services Financial Yearly Forecast Elements PDF. The topics addressed in these templates are Hospitality Services, Financial Yearly Forecast. All the content presented in this PPT design is completely editable. Download it and make adjustments in color, background, font etc. as per your unique business setting.
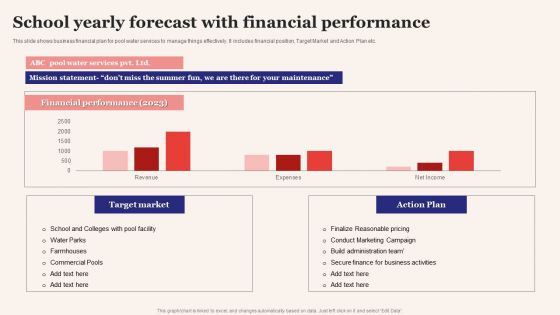
School Yearly Forecast With Financial Performance Information PDF
This slide shows business financial plan for pool water services to manage things effectively. It includes financial position, Target Market and Action Plan etc. Pitch your topic with ease and precision using this School Yearly Forecast With Financial Performance Information PDF. This layout presents information on Target Market, Action Plan. It is also available for immediate download and adjustment. So, changes can be made in the color, design, graphics or any other component to create a unique layout.
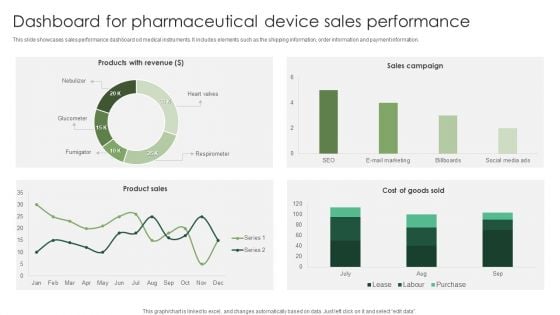
Dashboard For Pharmaceutical Device Sales Performance Graphics PDF
This slide showcases sales performance dashboard od medical instruments. It includes elements such as the shipping information, order information and payment information. Showcasing this set of slides titled Dashboard For Pharmaceutical Device Sales Performance Graphics PDF. The topics addressed in these templates are Pharmaceutical Device, Sales Performance. All the content presented in this PPT design is completely editable. Download it and make adjustments in color, background, font etc. as per your unique business setting.
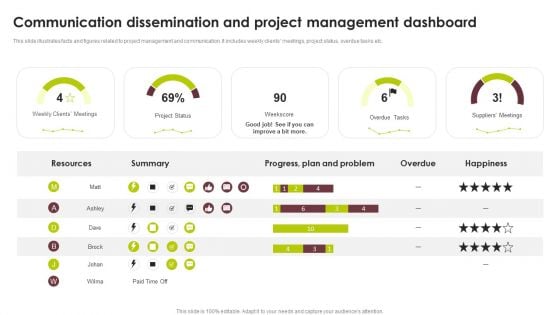
Communication Dissemination And Project Management Dashboard Inspiration PDF
This slide illustrates facts and figures related to project management and communication. It includes weekly clients meetings, project status, overdue tasks etc.Pitch your topic with ease and precision using this Communication Dissemination And Project Management Dashboard Inspiration PDF. This layout presents information on Progress Plan, Overdue Tasks, Project Status. It is also available for immediate download and adjustment. So, changes can be made in the color, design, graphics or any other component to create a unique layout.
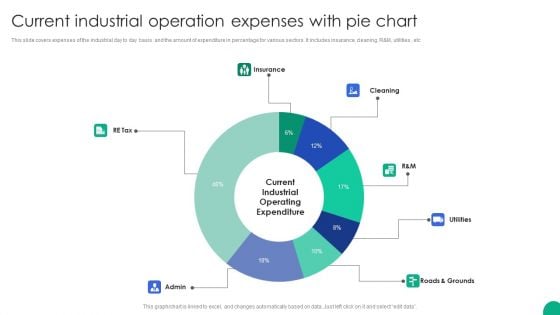
Current Industrial Operation Expenses With Pie Chart Download PDF
This slide covers expenses of the industrial day to day basis and the amount of expenditure in percentage for various sectors. It includes insurance, cleaning, R and M, utilities , etc.Showcasing this set of slides titled Current Industrial Operation Expenses With Pie Chart Download PDF. The topics addressed in these templates are Roads Grounds, Insurance, Utilities. All the content presented in this PPT design is completely editable. Download it and make adjustments in color, background, font etc. as per your unique business setting.
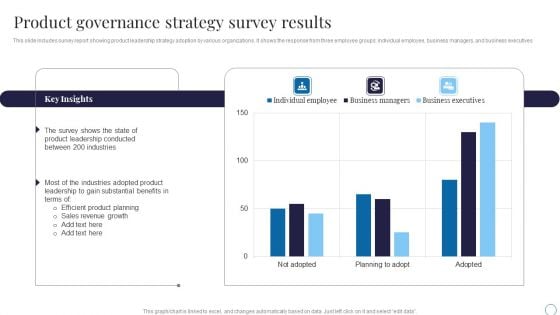
Product Governance Strategy Survey Results Guidelines PDF
This slide includes survey report showing product leadership strategy adoption by various organizations. It shows the response from three employee groups individual employee, business managers, and business executives.Showcasing this set of slides titled Product Governance Strategy Survey Results Guidelines PDF. The topics addressed in these templates are Leadership Conducted, Industries Adopted, Revenue Growth. All the content presented in this PPT design is completely editable. Download it and make adjustments in color, background, font etc. as per your unique business setting.
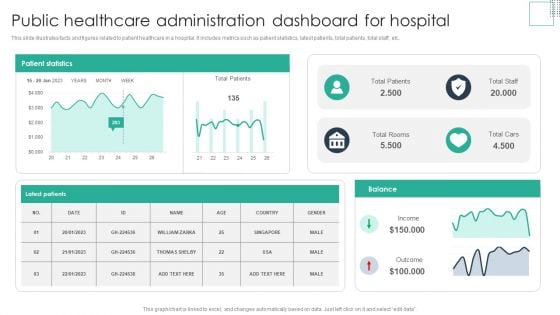
Public Healthcare Administration Dashboard For Hospital Guidelines PDF
This slide illustrates facts and figures related to patient healthcare in a hospital. It includes metrics such as patient statistics, latest patients, total patients, total staff, etc.Pitch your topic with ease and precision using this Public Healthcare Administration Dashboard For Hospital Guidelines PDF. This layout presents information on Total Patients, Total Rooms, Patient Statistics. It is also available for immediate download and adjustment. So, changes can be made in the color, design, graphics or any other component to create a unique layout.
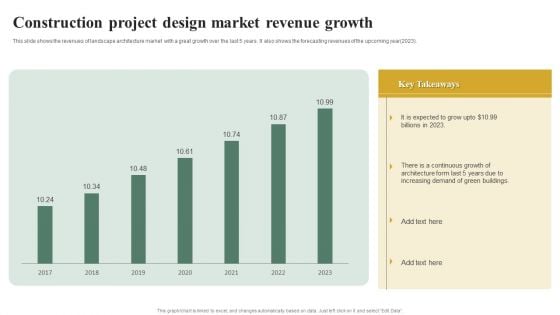
Construction Project Design Market Revenue Growth Introduction PDF
This slide shows the revenues of landscape architecture market with a great growth over the last 5 years. It also shows the forecasting revenues of the upcoming year 2023. Showcasing this set of slides titled Construction Project Design Market Revenue Growth Introduction PDF. The topics addressed in these templates are Construction Project Design, Market Revenue Growth. All the content presented in this PPT design is completely editable. Download it and make adjustments in color, background, font etc. as per your unique business setting.
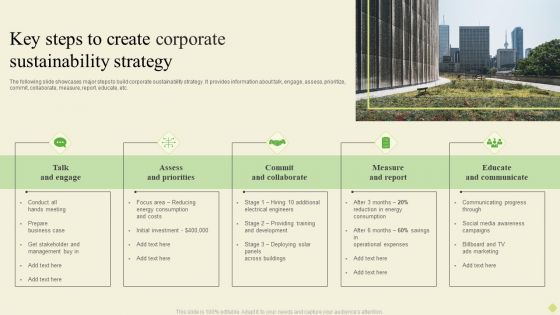
Key Steps To Create Corporate Sustainability Strategy Graphics PDF
The following slide showcases production plant dashboard showing sustainable initiatives. It provides information about pulp sourcing, traceability, plantation, freshwater, energy, chemical, air, etc.Showcasing this set of slides titled Key Steps To Create Corporate Sustainability Strategy Graphics PDF. The topics addressed in these templates are Assess Priorities, Commit Collaborate, Measure Report. All the content presented in this PPT design is completely editable. Download it and make adjustments in color, background, font etc. as per your unique business setting.
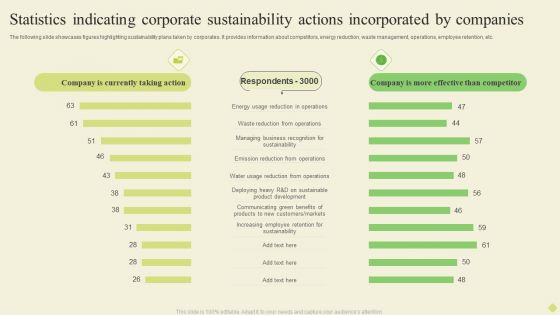
Statistics Indicating Corporate Sustainability Actions Incorporated By Companies Diagrams PDF
The following slide showcases figures highlighting sustainability plans taken by corporates. It provides information about competitors, energy reduction, waste management, operations, employee retention, etc.Pitch your topic with ease and precision using this Statistics Indicating Corporate Sustainability Actions Incorporated By Companies Diagrams PDF. This layout presents information on Energy Reduction, Emission Reduction, Increasing Employee. It is also available for immediate download and adjustment. So, changes can be made in the color, design, graphics or any other component to create a unique layout.

ITIL Incident Regulation Kpi Dashboard Background PDF
This slide covers ITIL problem management KPI dashboard to track status of problems. It involves KPI such as total number of incidents, problems, requests, average time to solve incidents.Pitch your topic with ease and precision using this ITIL Incident Regulation Kpi Dashboard Background PDF. This layout presents information on Active Problems, Average Incidents, Opened Problems. It is also available for immediate download and adjustment. So, changes can be made in the color, design, graphics or any other component to create a unique layout.
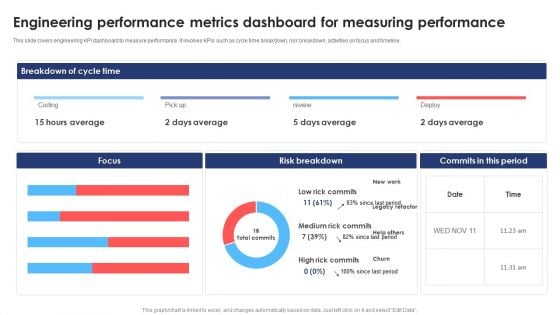
Engineering Performance Metrics Dashboard For Measuring Performance Download PDF
This slide covers engineering KPI dashboard to measure performance. It involves KPIs such as cycle time breakdown, risk breakdown, activities on focus and timeline. Pitch your topic with ease and precision using this Engineering Performance Metrics Dashboard For Measuring Performance Download PDF. This layout presents information on Average, Risk Breakdown, Measuring Performance. It is also available for immediate download and adjustment. So, changes can be made in the color, design, graphics or any other component to create a unique layout.

Quarterly Comparison Of Security For Cloud Based Systems Threats Infographics PDF
This slide shows the various types of cloud security threats occurred during four quarters. It includes phishing, malware, IoT and password attacks. Pitch your topic with ease and precision using this Quarterly Comparison Of Security For Cloud Based Systems Threats Infographics PDF. This layout presents information on Quarterly Comparison Of Security, Cloud Based Systems Threats. It is also available for immediate download and adjustment. So, changes can be made in the color, design, graphics or any other component to create a unique layout.
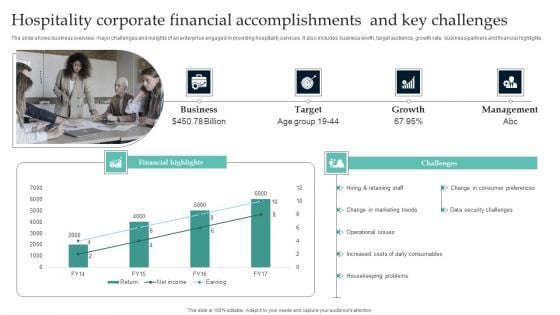
Hospitality Corporate Financial Accomplishments And Key Challenges Slides PDF
The slide shows business overview, major challenges and insights of an enterprise engaged in providing hospitality services. It also includes business worth, target audience, growth rate, business partners and financial highlights. Showcasing this set of slides titled Hospitality Corporate Financial Accomplishments And Key Challenges Slides PDF. The topics addressed in these templates are Business, Target, Growth. All the content presented in this PPT design is completely editable. Download it and make adjustments in color, background, font etc. as per your unique business setting.
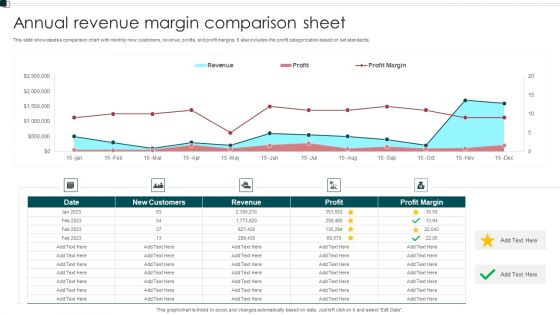
Annual Revenue Margin Comparison Sheet Information PDF
This slide showcases a comparison chart with monthly new customers, revenue, profits, and profit margins. It also includes the profit categorization based on set standards. Showcasing this set of slides titled Annual Revenue Margin Comparison Sheet Information PDF. The topics addressed in these templates are Customers, Revenue, Profit Margin. All the content presented in this PPT design is completely editable. Download it and make adjustments in color, background, font etc. as per your unique business setting.


 Continue with Email

 Home
Home


