Banking Technology
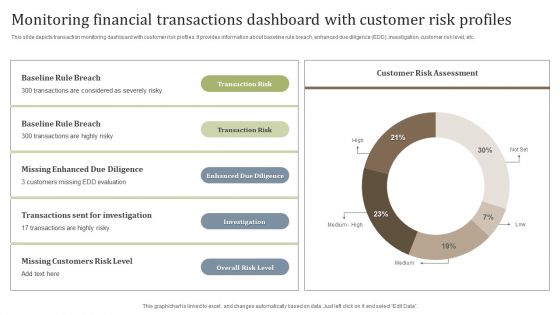
Monitoring Financial Transactions Dashboard With Customer Risk Profiles Diagrams PDF
This slide depicts transaction monitoring dashboard with customer risk profiles. It provides information about baseline rule breach, enhanced due diligence EDD, investigation, customer risk level, etc. Showcasing this set of slides titled Monitoring Financial Transactions Dashboard With Customer Risk Profiles Diagrams PDF. The topics addressed in these templates are Overall Risk Level, Investigation, Enhanced Due Diligence. All the content presented in this PPT design is completely editable. Download it and make adjustments in color, background, font etc. as per your unique business setting.
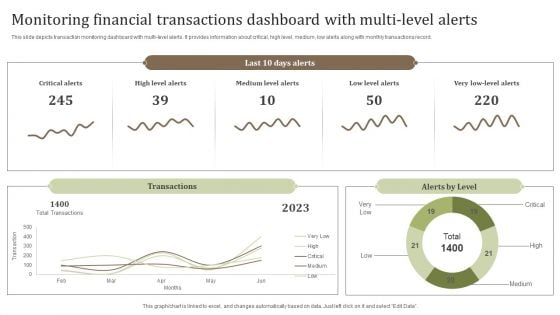
Monitoring Financial Transactions Dashboard With Multi Level Alerts Background PDF
This slide depicts transaction monitoring dashboard with multi-level alerts. It provides information about critical, high level, medium, low alerts along with monthly transactions record. Pitch your topic with ease and precision using this Monitoring Financial Transactions Dashboard With Multi Level Alerts Background PDF. This layout presents information on Critical Alerts, Medium Level Alerts, Total Transactions. It is also available for immediate download and adjustment. So, changes can be made in the color, design, graphics or any other component to create a unique layout.
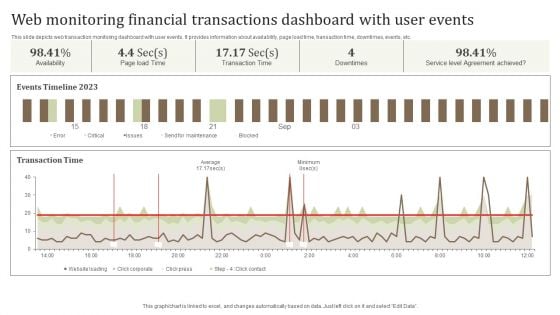
Web Monitoring Financial Transactions Dashboard With User Events Graphics PDF
This slide depicts web transaction monitoring dashboard with user events. It provides information about availability, page load time, transaction time, downtimes, events, etc.Showcasing this set of slides titled Web Monitoring Financial Transactions Dashboard With User Events Graphics PDF. The topics addressed in these templates are Transaction Time, Events Timeline, Level Agreement. All the content presented in this PPT design is completely editable. Download it and make adjustments in color, background, font etc. as per your unique business setting.
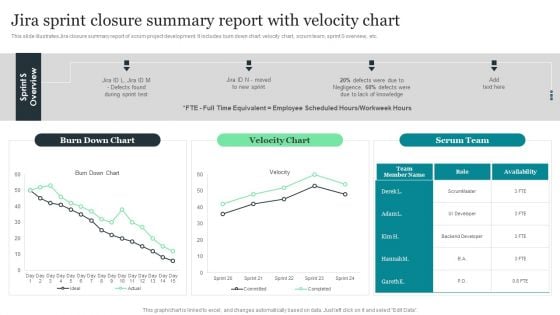
Jira Sprint Closure Summary Report With Velocity Chart Designs PDF
This slide illustrates Jira closure summary report of scrum project development. It includes burn down chart, velocity chart, scrum team, sprint S overview, etc. Pitch your topic with ease and precision using this Jira Sprint Closure Summary Report With Velocity Chart Designs PDF. This layout presents information on Jira Sprint Closure, Summary Report, Velocity Chart. It is also available for immediate download and adjustment. So, changes can be made in the color, design, graphics or any other component to create a unique layout.
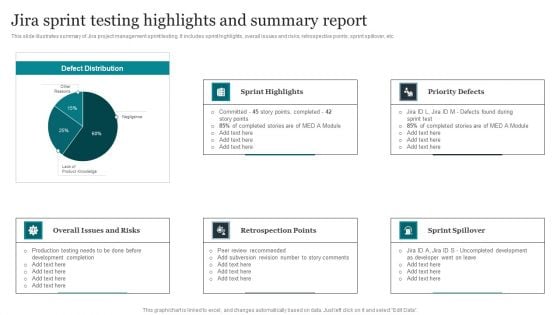
Jira Sprint Testing Highlights And Summary Report Slides PDF
This slide illustrates summary of Jira project management sprint testing. It includes sprint highlights, overall issues and risks, retrospective points, sprint spillover, etc. Showcasing this set of slides titled Jira Sprint Testing Highlights And Summary Report Slides PDF. The topics addressed in these templates are Sprint Highlights, Priority Defects, Retrospection Points. All the content presented in this PPT design is completely editable. Download it and make adjustments in color, background, font etc. as per your unique business setting.
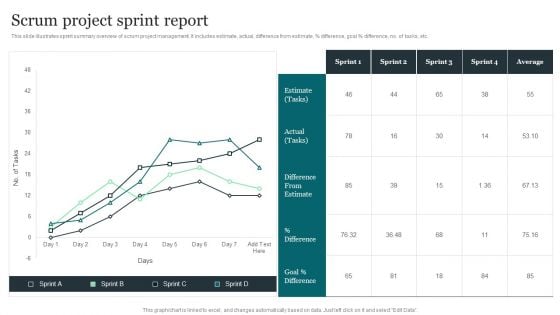
Scrum Project Sprint Report Guidelines PDF
This slide illustrates sprint summary overview of scrum project management. It includes estimate, actual, difference from estimate, percent difference, goal percent difference, no. of tasks, etc. Pitch your topic with ease and precision using this Scrum Project Sprint Report Guidelines PDF. This layout presents information on Scrum Project, Sprint Report. It is also available for immediate download and adjustment. So, changes can be made in the color, design, graphics or any other component to create a unique layout.
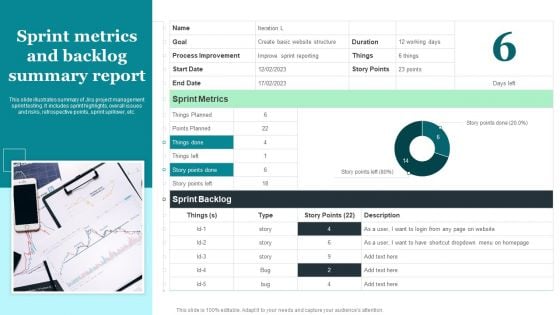
Sprint Metrics And Backlog Summary Report Brochure PDF
This slide illustrates summary of Jira project management sprint testing. It includes sprint highlights, overall issues and risks, retrospective points, sprint spillover, etc. Pitch your topic with ease and precision using this Sprint Metrics And Backlog Summary Report Brochure PDF. This layout presents information on Sprint Metrics And Backlog, Summary Report. It is also available for immediate download and adjustment. So, changes can be made in the color, design, graphics or any other component to create a unique layout.
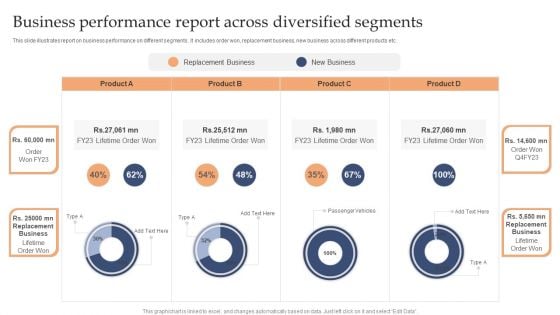
Business Performance Report Across Diversified Segments Microsoft PDF
This slide illustrates report on business performance on different segments . It includes order won, replacement business, new business across different products etc.Pitch your topic with ease and precision using this Business Performance Report Across Diversified Segments Microsoft PDF. This layout presents information on Replacement Business, New Business, Replacement Business. It is also available for immediate download and adjustment. So, changes can be made in the color, design, graphics or any other component to create a unique layout.
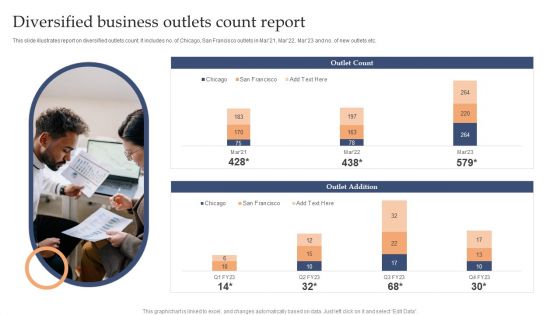
Diversified Business Outlets Count Report Background PDF
This slide illustrates report on diversified outlets count. It includes no. of Chicago, San Francisco outlets in Mar21, Mar22, Mar23 and no. of new outlets etc.Pitch your topic with ease and precision using this Diversified Business Outlets Count Report Background PDF. This layout presents information on Outlet Count, Outlet Addition, Chicago. It is also available for immediate download and adjustment. So, changes can be made in the color, design, graphics or any other component to create a unique layout.
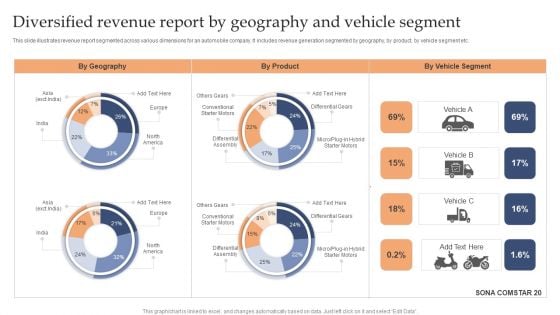
Diversified Revenue Report By Geography And Vehicle Segment Background PDF
This slide illustrates revenue report segmented across various dimensions for an automobile company. It includes revenue generation segmented by geography, by product, by vehicle segment etc.Showcasing this set of slides titled Diversified Revenue Report By Geography And Vehicle Segment Background PDF. The topics addressed in these templates are Vehicle Segment, Conventional Starter, Differential Assembly. All the content presented in this PPT design is completely editable. Download it and make adjustments in color, background, font etc. as per your unique business setting.
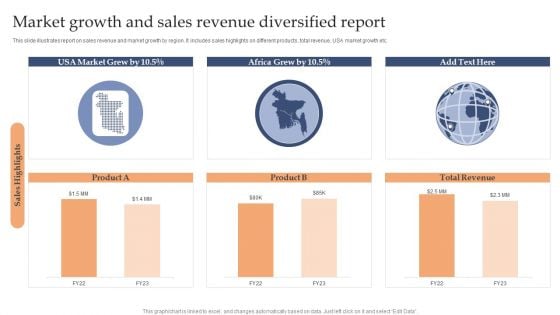
Market Growth And Sales Revenue Diversified Report Sample PDF
This slide illustrates report on sales revenue and market growth by region. It includes sales highlights on different products, total revenue, USA market growth etc.Pitch your topic with ease and precision using this Market Growth And Sales Revenue Diversified Report Sample PDF. This layout presents information on Market Grew, Africa Grew, Total Revenue. It is also available for immediate download and adjustment. So, changes can be made in the color, design, graphics or any other component to create a unique layout.
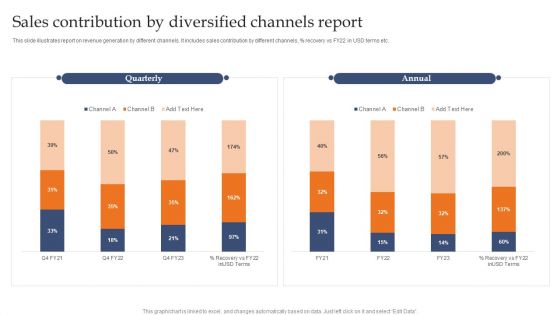
Sales Contribution By Diversified Channels Report Demonstration PDF
This slide illustrates report on revenue generation by different channels. It includes sales contribution by different channels, precent recovery vs FY22 in USD terms etc.Pitch your topic with ease and precision using this Sales Contribution By Diversified Channels Report Demonstration PDF. This layout presents information on Quarterly, Annual, Channel. It is also available for immediate download and adjustment. So, changes can be made in the color, design, graphics or any other component to create a unique layout.
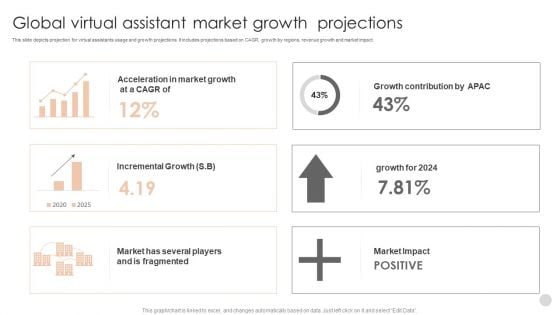
Global Virtual Assistant Market Growth Projections Graphics PDF
This slide depicts projection for virtual assistants usage and growth projections. It includes projections based on CAGR, growth by regions, revenue growth and market impact. Showcasing this set of slides titled Global Virtual Assistant Market Growth Projections Graphics PDF. The topics addressed in these templates are Acceleration Market, Incremental Growth, Players Fragmented. All the content presented in this PPT design is completely editable. Download it and make adjustments in color, background, font etc. as per your unique business setting.
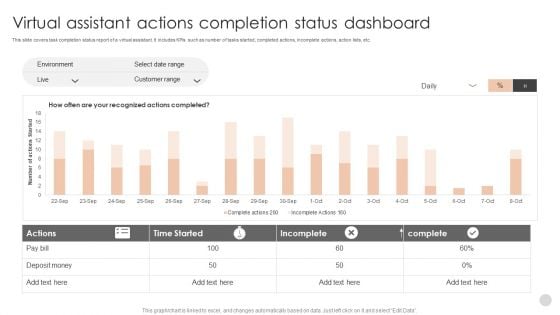
Virtual Assistant Actions Completion Status Dashboard Elements PDF
This slide covers task completion status report of a virtual assistant. It includes KPIs such as number of tasks started, completed actions, incomplete actions, action lists, etc.Showcasing this set of slides titled Virtual Assistant Actions Completion Status Dashboard Elements PDF. The topics addressed in these templates are Customer Range, Time Started, Incomplete. All the content presented in this PPT design is completely editable. Download it and make adjustments in color, background, font etc. as per your unique business setting.
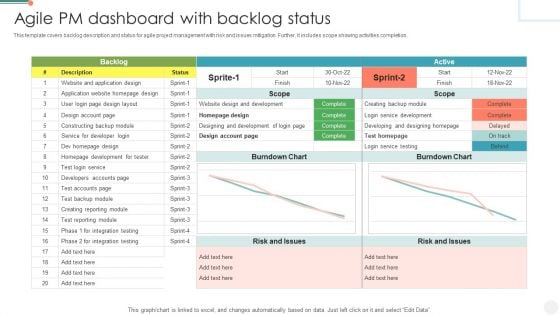
Agile PM Dashboard With Backlog Status Summary PDF
This template covers backlog description and status for agile project management with risk and issues mitigation. Further, it includes scope showing activities completion. Pitch your topic with ease and precision using this Agile PM Dashboard With Backlog Status Summary PDF. This layout presents information on Service For Developer Login, Risk And Issues, Service Development. It is also available for immediate download and adjustment. So, changes can be made in the color, design, graphics or any other component to create a unique layout.
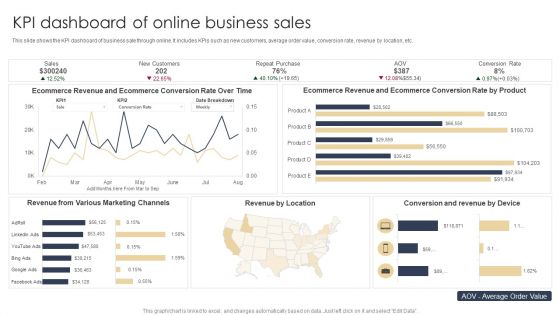
KPI Dashboard Of Online Business Sales Microsoft PDF
This slide shows the KPI dashboard of business sale through online. It includes KPIs such as new customers, average order value, conversion rate, revenue by location, etc. Showcasing this set of slides titled KPI Dashboard Of Online Business Sales Microsoft PDF. The topics addressed in these templates are Marketing Channels, Revenue, Location. All the content presented in this PPT design is completely editable. Download it and make adjustments in color, background, font etc. as per your unique business setting.
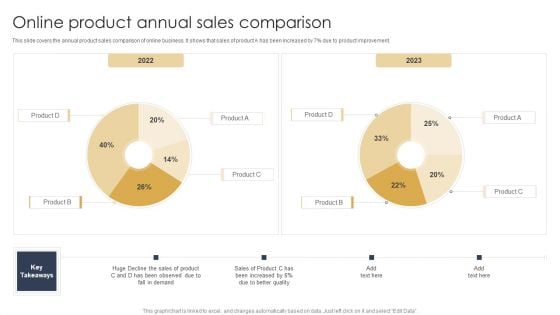
Online Product Annual Sales Comparison Brochure PDF
This slide covers the annual product sales comparison of online business. It shows that sales of product A has been increased by 7 percent due to product improvement. Showcasing this set of slides titled Online Product Annual Sales Comparison Brochure PDF. The topics addressed in these templates are Demand, Sales Of Product, Quality. All the content presented in this PPT design is completely editable. Download it and make adjustments in color, background, font etc. as per your unique business setting.
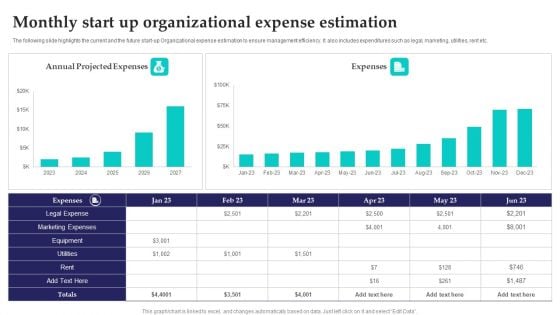
Monthly Start Up Organizational Expense Estimation Information PDF
The following slide highlights the current and the future start up Organizational expense estimation to ensure management efficiency. It also includes expenditures such as legal, marketing, utilities, rent etc. Pitch your topic with ease and precision using this Monthly Start Up Organizational Expense Estimation Information PDF. This layout presents information on Marketing Expenses, Equipment, Organizational. It is also available for immediate download and adjustment. So, changes can be made in the color, design, graphics or any other component to create a unique layout.
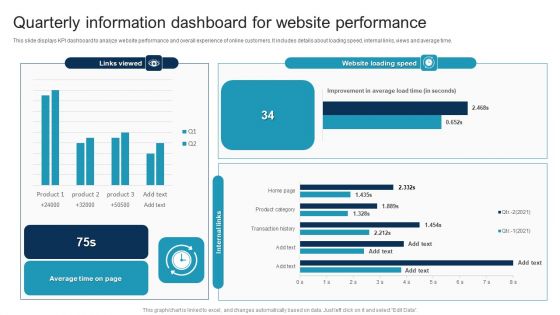
Quarterly Information Dashboard For Website Performance Portrait PDF
This slide displays KPI dashboard to analyze website performance and overall experience of online customers. It includes details about loading speed, internal links, views and average time. Pitch your topic with ease and precision using this Quarterly Information Dashboard For Website Performance Portrait PDF. This layout presents information on Quarterly Information, Dashboard For Website Performance. It is also available for immediate download and adjustment. So, changes can be made in the color, design, graphics or any other component to create a unique layout.
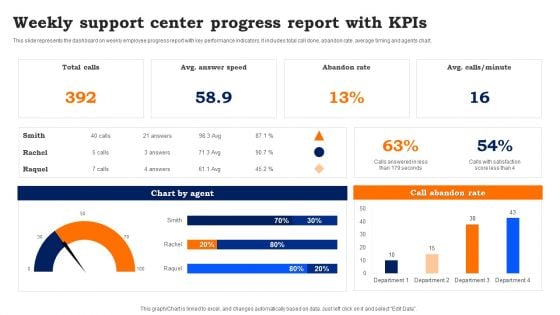
Weekly Support Center Progress Report With Kpis Template PDF
This slide represents the dashboard on weekly employee progress report with key performance indicators. It includes total call done, abandon rate, average timing and agents chart. Pitch your topic with ease and precision using this Weekly Support Center Progress Report With Kpis Template PDF. This layout presents information on Weekly Support, Center Progress Report. It is also available for immediate download and adjustment. So, changes can be made in the color, design, graphics or any other component to create a unique layout.
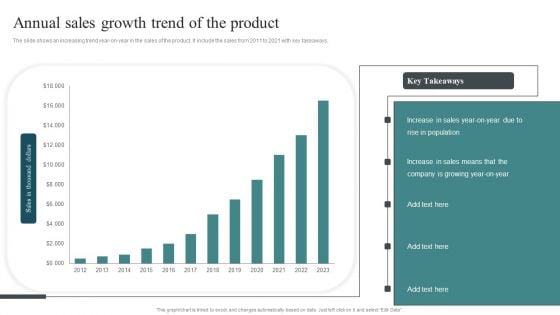
Annual Sales Growth Trend Of The Product Summary PDF
The slide shows an increasing trend year-on-year in the sales of the product. It include the sales from 2011 to 2021 with key takeaways.Pitch your topic with ease and precision using this Annual Sales Growth Trend Of The Product Summary PDF. This layout presents information on Increase Sales, Company Growing, Rise Population. It is also available for immediate download and adjustment. So, changes can be made in the color, design, graphics or any other component to create a unique layout.
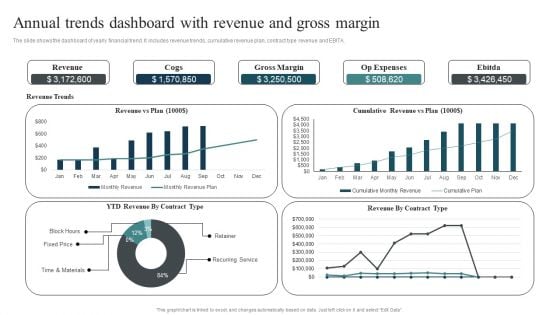
Annual Trends Dashboard With Revenue And Gross Margin Designs PDF
The slide shows the dashboard of yearly financial trend. It includes revenue trends, cumulative revenue plan, contract type revenue and EBITA. Showcasing this set of slides titled Annual Trends Dashboard With Revenue And Gross Margin Designs PDF. The topics addressed in these templates are Cumulative Revenue, Time Materials, Recurring Service. All the content presented in this PPT design is completely editable. Download it and make adjustments in color, background, font etc. as per your unique business setting.
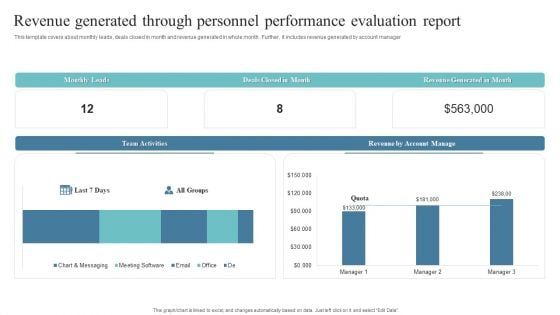
Revenue Generated Through Personnel Performance Evaluation Report Mockup PDF
This template covers about monthly leads, deals closed in month and revenue generated in whole month . Further, it includes revenue generated by account manager.Pitch your topic with ease and precision using this Revenue Generated Through Personnel Performance Evaluation Report Mockup PDF. This layout presents information on Monthly Lead, Team Activities, Account Manage. It is also available for immediate download and adjustment. So, changes can be made in the color, design, graphics or any other component to create a unique layout.
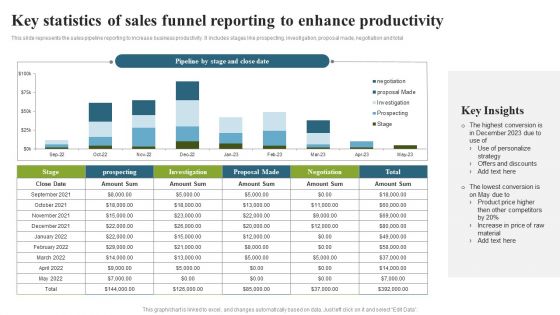
Key Statistics Of Sales Funnel Reporting To Enhance Productivity Clipart PDF
This slide represents the sales pipeline reporting to increase business productivity. It includes stages like prospecting, investigation, proposal made, negotiation and total. Showcasing this set of slides titled Key Statistics Of Sales Funnel Reporting To Enhance Productivity Clipart PDF. The topics addressed in these templates are Highest Conversion Offers Discounts, Product Higher. All the content presented in this PPT design is completely editable. Download it and make adjustments in color, background, font etc. as per your unique business setting.
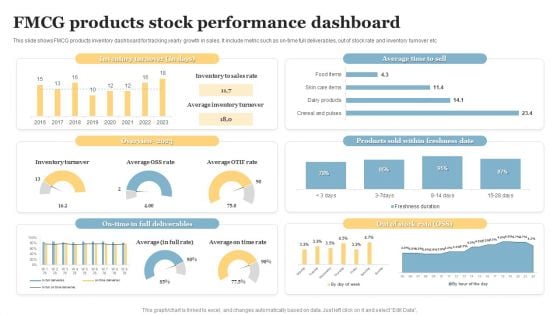
FMCG Products Stock Performance Dashboard Pictures PDF
This slide shows FMCG products inventory dashboard for tracking yearly growth in sales. It include metric such as on-time full deliverables, out of stock rate and inventory turnover etc. Showcasing this set of slides titled FMCG Products Stock Performance Dashboard Pictures PDF. The topics addressed in these templates are Inventory Turnover, Products Sold, Freshness Date. All the content presented in this PPT design is completely editable. Download it and make adjustments in color, background, font etc. as per your unique business setting.
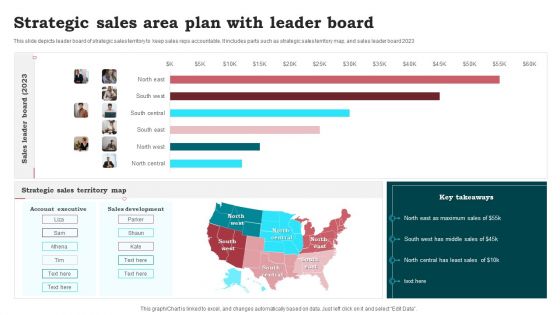
Strategic Sales Area Plan With Leader Board Inspiration PDF
This slide depicts leader board of strategic sales territory to keep sales reps accountable. It includes parts such as strategic sales territory map, and sales leader board 2023. Showcasing this set of slides titled Strategic Sales Area Plan With Leader Board Inspiration PDF. The topics addressed in these templates are Strategic Sales Area, Plan Leader Board. All the content presented in this PPT design is completely editable. Download it and make adjustments in color, background, font etc. as per your unique business setting.
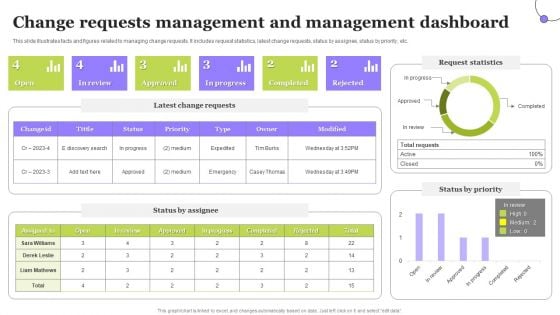
Change Requests Management And Management Dashboard Clipart PDF
This slide illustrates facts and figures related to managing change requests. It includes request statistics, latest change requests, status by assignee, status by priority, etc. Pitch your topic with ease and precision using this Change Requests Management And Management Dashboard Clipart PDF. This layout presents information on Status By Assignee, Status By Priority, Request Statistics. It is also available for immediate download and adjustment. So, changes can be made in the color, design, graphics or any other component to create a unique layout.
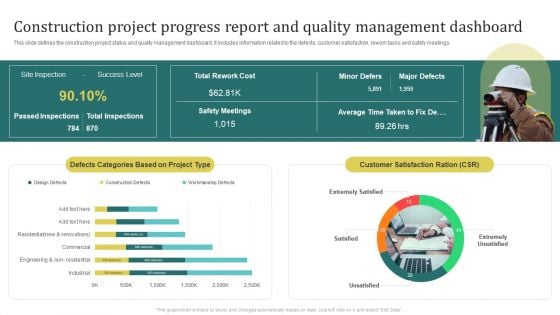
Construction Project Progress Report And Quality Management Dashboard Sample PDF
This slide defines the construction project status and quality management dashboard. It includes information related to the defects, customer satisfaction, rework tasks and safety meetings.Showcasing this set of slides titled Construction Project Progress Report And Quality Management Dashboard Sample PDF. The topics addressed in these templates are Passed Inspections, Customer Satisfaction, Defects Categories. All the content presented in this PPT design is completely editable. Download it and make adjustments in color, background, font etc. as per your unique business setting.
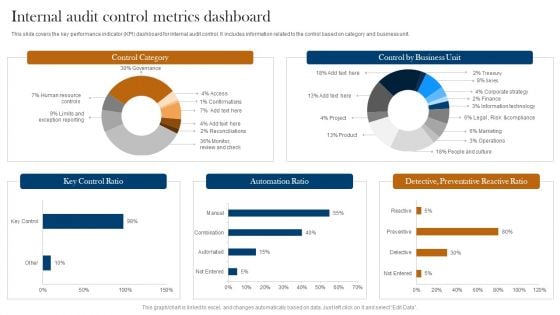
Internal Audit Control Metrics Dashboard Ppt Professional Design Templates PDF
This slide covers the key performance indicator KPI dashboard for internal audit control. It includes information related to the control based on category and business unit. Showcasing this set of slides titled Internal Audit Control Metrics Dashboard Ppt Professional Design Templates PDF. The topics addressed in these templates are Control Category, Key Control Ratio, Automation Ratio. All the content presented in this PPT design is completely editable. Download it and make adjustments in color, background, font etc. as per your unique business setting.
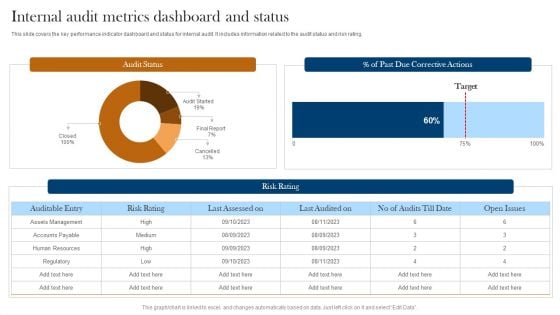
Internal Audit Metrics Dashboard And Status Ppt Layouts Graphic Images PDF
This slide covers the key performance indicator dashboard and status for internal audit. It includes information related to the audit status and risk rating. Pitch your topic with ease and precision using this Internal Audit Metrics Dashboard And Status Ppt Layouts Graphic Images PDF. This layout presents information on Audit Status, Risk Rating, Auditable Entry. It is also available for immediate download and adjustment. So, changes can be made in the color, design, graphics or any other component to create a unique layout.
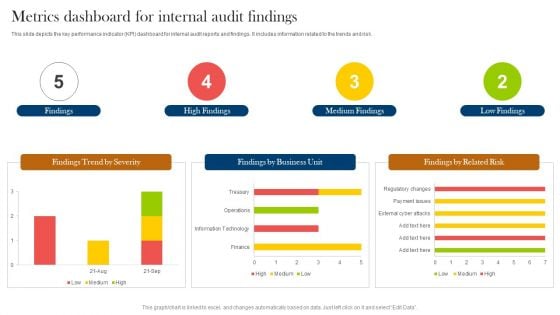
Metrics Dashboard For Internal Audit Findings Ppt Styles Gallery PDF
This slide depicts the key performance indicator KPI dashboard for internal audit reports and findings. It includes information related to the trends and risk. Pitch your topic with ease and precision using this Metrics Dashboard For Internal Audit Findings Ppt Styles Gallery PDF. This layout presents information on Findings, High Findings, Medium Findings, Low Findings. It is also available for immediate download and adjustment. So, changes can be made in the color, design, graphics or any other component to create a unique layout.
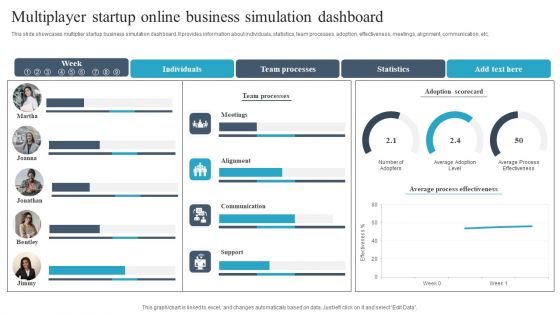
Multiplayer Startup Online Business Simulation Dashboard Demonstration PDF
This slide showcases multiplier startup business simulation dashboard. It provides information about individuals, statistics, team processes, adoption, effectiveness, meetings, alignment, communication, etc. Pitch your topic with ease and precision using this Multiplayer Startup Online Business Simulation Dashboard Demonstration PDF. This layout presents information on Individuals, Team Processes, Statistics. It is also available for immediate download and adjustment. So, changes can be made in the color, design, graphics or any other component to create a unique layout.
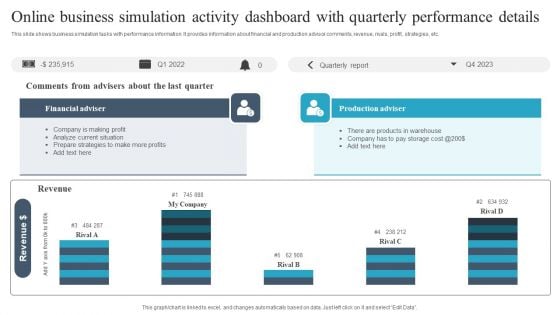
Online Business Simulation Activity Dashboard With Quarterly Performance Details Guidelines PDF
This slide shows business simulation tasks with performance information. It provides information about financial and production advisor comments, revenue, rivals, profit, strategies, etc. Pitch your topic with ease and precision using this Online Business Simulation Activity Dashboard With Quarterly Performance Details Guidelines PDF. This layout presents information on Financial Adviser, Production Adviser, Revenue. It is also available for immediate download and adjustment. So, changes can be made in the color, design, graphics or any other component to create a unique layout.
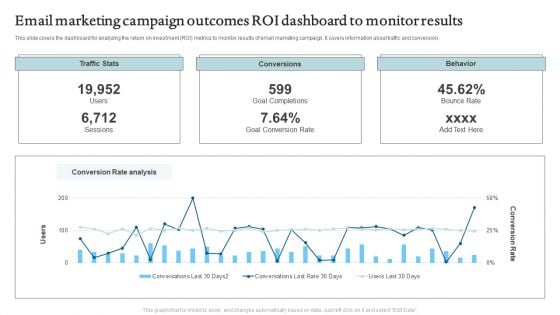
Email Marketing Campaign Outcomes ROI Dashboard To Monitor Results Formats PDF
This slide depicts the dashboard for analyzing the marketing results and campaign performance. It includes information related email sent, delivered, conversions, etc. Pitch your topic with ease and precision using this Email Marketing Campaign Outcomes ROI Dashboard To Monitor Results Formats PDF. This layout presents information on Traffic Stats, Conversions, Behavior. It is also available for immediate download and adjustment. So, changes can be made in the color, design, graphics or any other component to create a unique layout.
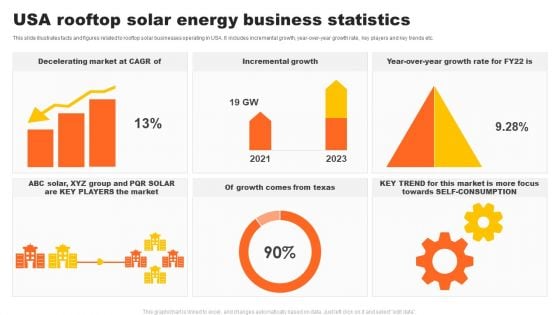
USA Rooftop Solar Energy Business Statistics Brochure PDF
This slide illustrates facts and figures related to rooftop solar businesses operating in USA. It includes incremental growth, year-over-year growth rate, key players and key trends etc. Showcasing this set of slides titled USA Rooftop Solar Energy Business Statistics Brochure PDF. The topics addressed in these templates are Decelerating Market, Incremental Growth, More Focus. All the content presented in this PPT design is completely editable. Download it and make adjustments in color, background, font etc. as per your unique business setting.
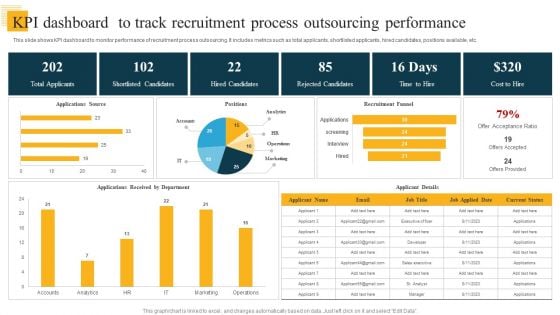
KPI Dashboard To Track Recruitment Process Outsourcing Performance Information PDF
This slide shows KPI dashboard to monitor performance of recruitment process outsourcing. It includes metrics such as total applicants, shortlisted applicants, hired candidates, positions available, etc. Showcasing this set of slides titled KPI Dashboard To Track Recruitment Process Outsourcing Performance Information PDF. The topics addressed in these templates are Shortlisted Candidates, Hired Candidates, Rejected Candidates. All the content presented in this PPT design is completely editable. Download it and make adjustments in color, background, font etc. as per your unique business setting.
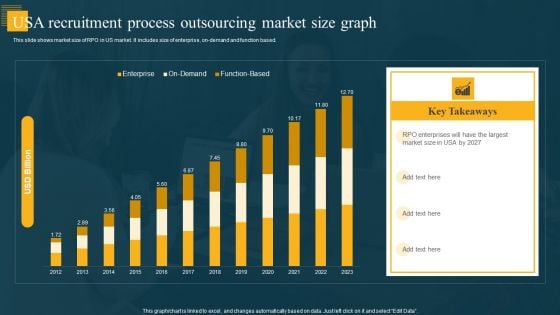
USA Recruitment Process Outsourcing Market Size Graph Topics PDF
This slide shows market size of RPO in US market. It includes size of enterprise, on-demand and function based. Showcasing this set of slides titled USA Recruitment Process Outsourcing Market Size Graph Topics PDF. The topics addressed in these templates are RPO Enterprises, Largest Market Size. All the content presented in this PPT design is completely editable. Download it and make adjustments in color, background, font etc. as per your unique business setting.
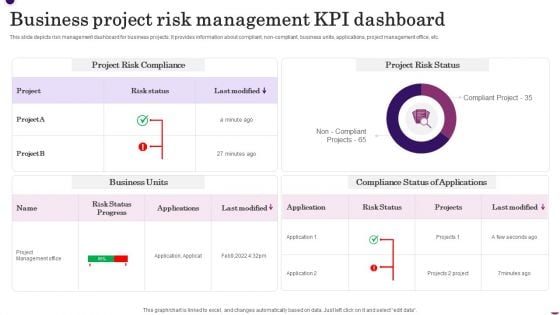
Business Project Risk Management KPI Dashboard Inspiration PDF
This slide depicts risk management dashboard for business projects. It provides information about compliant, non-compliant, business units, applications, project management office, etc. Showcasing this set of slides titled Business Project Risk Management KPI Dashboard Inspiration PDF. The topics addressed in these templates areProject Risk Compliance, Project Risk Status, Business Units . All the content presented in this PPT design is completely editable. Download it and make adjustments in color, background, font etc. as per your unique business setting.
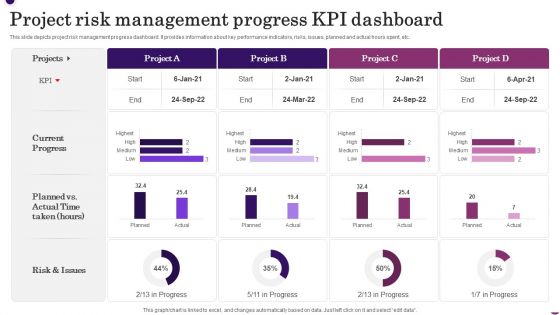
Project Risk Management Progress KPI Dashboard Template PDF
This slide depicts project risk management progress dashboard. It provides information about key performance indicators, risks, issues, planned and actual hours spent, etc. Pitch your topic with ease and precision using this Project Risk Management Progress KPI Dashboard Template PDF. This layout presents information on Current Progress, Risk And Issues. It is also available for immediate download and adjustment. So, changes can be made in the color, design, graphics or any other component to create a unique layout.

Project Risk KPI Dashboard With Impact Assessment Diagrams PDF
This slide depicts project risk impact assessment dashboard. It provides information about residual, inherent, enterprise and project risk assessment by status, etc. Showcasing this set of slides titled Project Risk KPI Dashboard With Impact Assessment Diagrams PDF. The topics addressed in these templates are Inherent Risk, Impact Of Risks On Project. All the content presented in this PPT design is completely editable. Download it and make adjustments in color, background, font etc. as per your unique business setting.
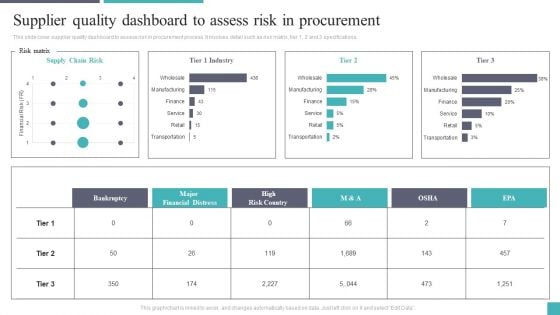
Supplier Quality Dashboard To Assess Risk In Procurement Demonstration PDF
This slide cover supplier quality dashboard to assess risk in procurement process. It involves detail such as risk matrix, tier 1, 2 and 3 specifications. Showcasing this set of slides titled Supplier Quality Dashboard To Assess Risk In Procurement Demonstration PDF. The topics addressed in these templates are Supply Chain Risk, Bankruptcy, Major Financial Distress. All the content presented in this PPT design is completely editable. Download it and make adjustments in color, background, font etc. as per your unique business setting.
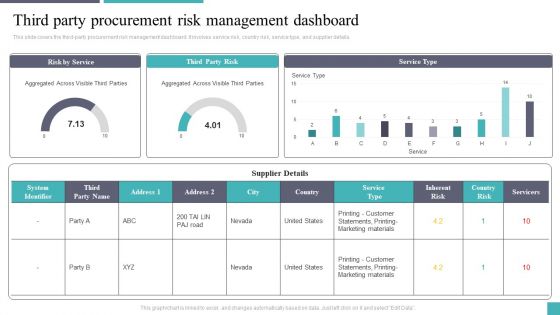
Third Party Procurement Risk Management Dashboard Ideas PDF
This slide covers the third-party procurement risk management dashboard. It involves service risk, country risk, service type, and supplier details. Showcasing this set of slides titled Third Party Procurement Risk Management Dashboard Ideas PDF. The topics addressed in these templates are Risk By Service, Third Party Risk, Service Type. All the content presented in this PPT design is completely editable. Download it and make adjustments in color, background, font etc. as per your unique business setting.
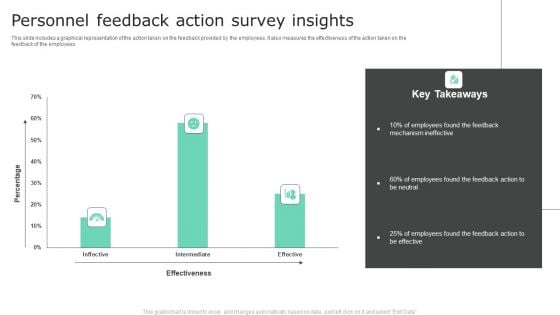
Personnel Feedback Action Survey Insights Themes PDF
This slide includes a graphical representation of the action taken on the feedback provided by the employees. It also measures the effectiveness of the action taken on the feedback of the employees. Showcasing this set of slides titled Personnel Feedback Action Survey Insights Themes PDF. The topics addressed in these templates are Mechanism Ineffective, Survey Insights. All the content presented in this PPT design is completely editable. Download it and make adjustments in color, background, font etc. as per your unique business setting.
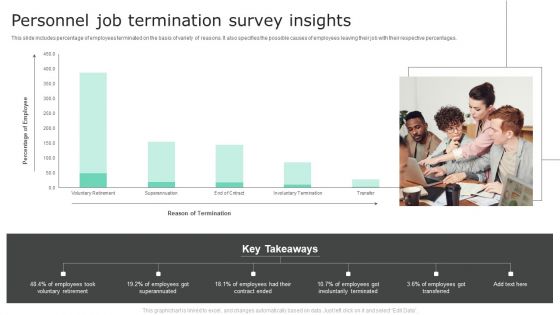
Personnel Job Termination Survey Insights Introduction PDF
This slide includes percentage of employees terminated on the basis of variety of reasons. It also specifies the possible causes of employees leaving their job with their respective percentages. Showcasing this set of slides titled Personnel Job Termination Survey Insights Introduction PDF. The topics addressed in these templates are Employees Got Superannuated, Contract Ended. All the content presented in this PPT design is completely editable. Download it and make adjustments in color, background, font etc. as per your unique business setting.
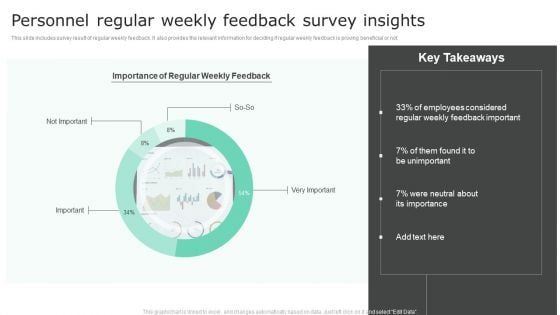
Personnel Regular Weekly Feedback Survey Insights Structure PDF
This slide includes survey result of regular weekly feedback. It also provides the relevant information for deciding if regular weekly feedback is proving beneficial or not. Pitch your topic with ease and precision using this Personnel Regular Weekly Feedback Survey Insights Structure PDF. This layout presents information on Feedback Important, Survey Insights. It is also available for immediate download and adjustment. So, changes can be made in the color, design, graphics or any other component to create a unique layout.
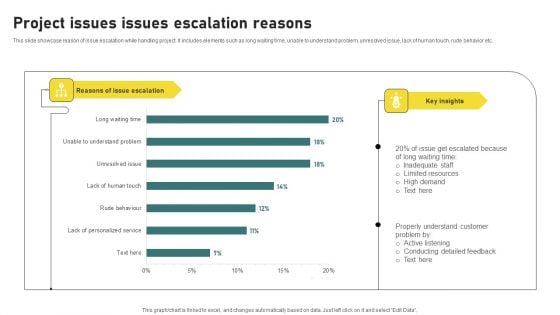
Project Issues Issues Escalation Reasons Information PDF
This slide showcase reason of issue escalation while handling project. It includes elements such as long waiting time, unable to understand problem, unresolved issue, lack of human touch, rude behavior etc. Showcasing this set of slides titled Project Issues Issues Escalation Reasons Information PDF. The topics addressed in these templates are Inadequate Staff, High Demand. All the content presented in this PPT design is completely editable. Download it and make adjustments in color, background, font etc. as per your unique business setting.
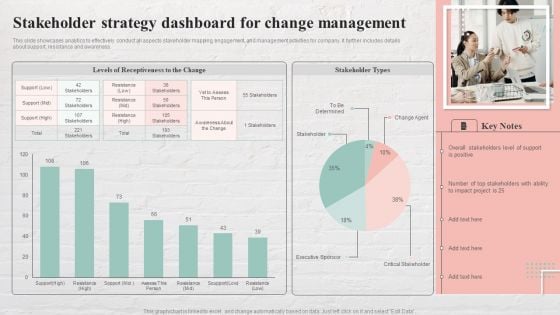
Stakeholder Strategy Dashboard For Change Management Brochure PDF
This slide showcases analytics to effectively conduct all aspects stakeholder mapping, engagement, and management activities for company. It further includes details about support, resistance and awareness. Showcasing this set of slides titled Stakeholder Strategy Dashboard For Change Management Brochure PDF. The topics addressed in these templates are Level Of Support, Stakeholders With Ability. All the content presented in this PPT design is completely editable. Download it and make adjustments in color, background, font etc. as per your unique business setting.
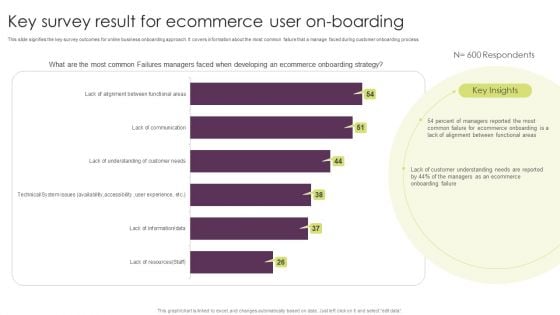
Key Survey Result For Ecommerce User On Boarding Professional PDF
This slide signifies the key survey outcomes for online business onboarding approach. It covers information about the most common failure that a manage faced during customer onboarding process. Showcasing this set of slides titled Key Survey Result For Ecommerce User On-Boarding Professional PDF. The topics addressed in these templates are Key Survey Result Ecommerce, User On-Boarding. All the content presented in this PPT design is completely editable. Download it and make adjustments in color, background, font etc. as per your unique business setting.
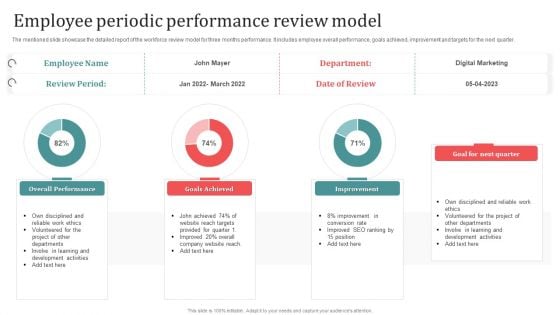
Employee Periodic Performance Review Model Demonstration PDF
The mentioned slide showcase the detailed report of the workforce review model for three months performance. It includes employee overall performance, goals achieved, improvement and targets for the next quarter. Showcasing this set of slides titled Employee Periodic Performance Review Model Demonstration PDF. The topics addressed in these templates are Overall Performance, Goals Achieved, Improvement. All the content presented in this PPT design is completely editable. Download it and make adjustments in color, background, font etc. as per your unique business setting.
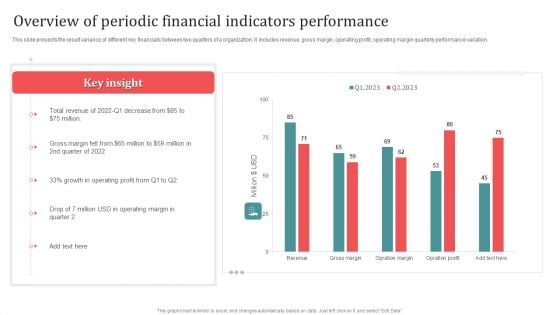
Overview Of Periodic Financial Indicators Performance Designs PDF
This slide presents the result variance of different key financials between two quarters of a organization. It includes revenue, gross margin, operating profit, operating margin quarterly performance variation. Showcasing this set of slides titled Overview Of Periodic Financial Indicators Performance Designs PDF. The topics addressed in these templates are Overview Of Periodic, Financial Indicators Performance. All the content presented in this PPT design is completely editable. Download it and make adjustments in color, background, font etc. as per your unique business setting.
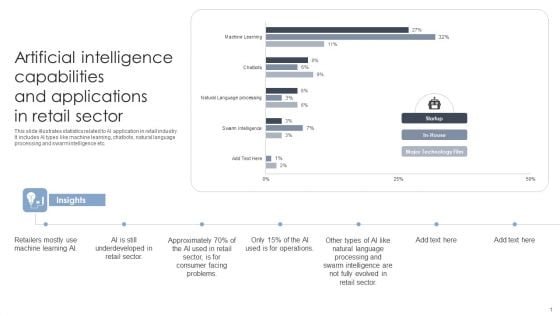
Artificial Intelligence Capabilities And Applications In Retail Sector Themes PDF
This slide illustrates statistics related to AI application in retail industry. It includes AI types like machine learning, chatbots, natural language processing and swarm intelligence etc. Pitch your topic with ease and precision using this Artificial Intelligence Capabilities And Applications In Retail Sector Themes PDF. This layout presents information on Capabilities And Applications, Retail Sector. It is also available for immediate download and adjustment. So, changes can be made in the color, design, graphics or any other component to create a unique layout.
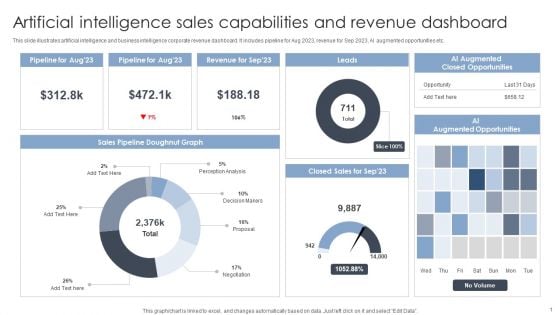
Artificial Intelligence Sales Capabilities And Revenue Dashboard Portrait PDF
This slide illustrates artificial intelligence and business intelligence corporate revenue dashboard. It includes pipeline for Aug 2023, revenue for Sep 2023, AI augmented opportunities etc. Pitch your topic with ease and precision using this Artificial Intelligence Sales Capabilities And Revenue Dashboard Portrait PDF. This layout presents information on Sales Capabilities, Revenue Dashboard. It is also available for immediate download and adjustment. So, changes can be made in the color, design, graphics or any other component to create a unique layout.
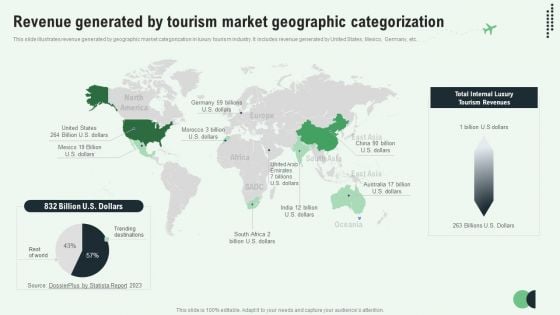
Revenue Generated By Tourism Market Geographic Categorization Infographics PDF
This slide illustrates revenue generated by geographic market categorization in luxury tourism industry. It includes revenue generated by United States, Mexico, Germany, etc. Showcasing this set of slides titled Revenue Generated By Tourism Market Geographic Categorization Infographics PDF. The topics addressed in these templates are Tourism Market, Geographic Categorization. All the content presented in this PPT design is completely editable. Download it and make adjustments in color, background, font etc. as per your unique business setting.
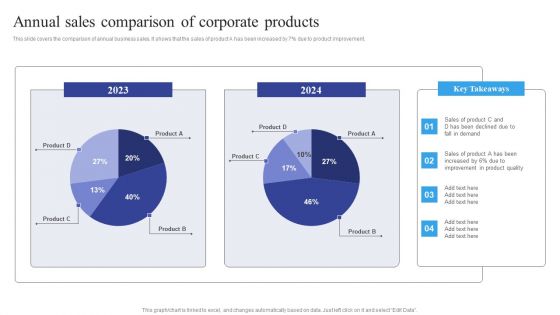
Annual Sales Comparison Of Corporate Products Themes PDF
This slide covers the comparison of annual business sales. It shows that the sales of product A has been increased by 7 percent due to product improvement. Pitch your topic with ease and precision using this Annual Sales Comparison Of Corporate Products Themes PDF. This layout presents information on Annual Sales, Comparison Of Corporate Products. It is also available for immediate download and adjustment. So, changes can be made in the color, design, graphics or any other component to create a unique layout.
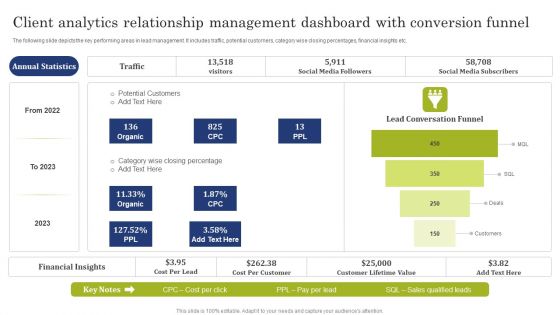
Client Analytics Relationship Management Dashboard With Conversion Funnel Demonstration PDF
The following slide depicts the key performing areas in lead management. It includes traffic, potential customers, category wise closing percentages, financial insights etc. Pitch your topic with ease and precision using this Client Analytics Relationship Management Dashboard With Conversion Funnel Demonstration PDF. This layout presents information on Potential Customers, Social Media Followers, Social Media Subscribers. It is also available for immediate download and adjustment. So, changes can be made in the color, design, graphics or any other component to create a unique layout.
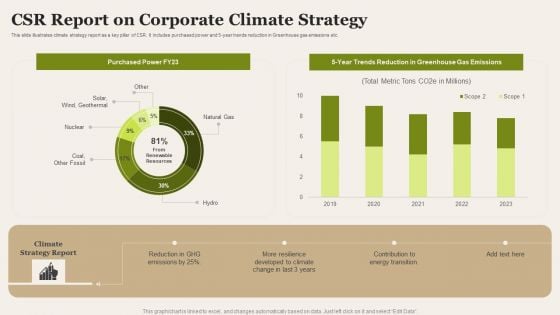
CSR Report On Corporate Climate Strategy Brochure PDF
This slide illustrates climate strategy report as a key pillar of CSR. It includes purchased power and 5 year trends reduction in Greenhouse gas emissions etc. Showcasing this set of slides titled CSR Report On Corporate Climate Strategy Brochure PDF. The topics addressed in these templates are Purchased Power, Trends Reduction, Climate Strategy Report. All the content presented in this PPT design is completely editable. Download it and make adjustments in color, background, font etc. as per your unique business setting.
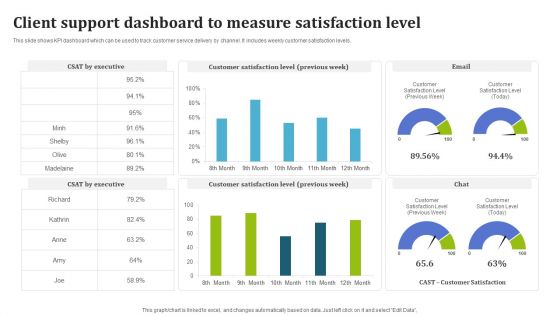
Client Support Dashboard To Measure Satisfaction Level Structure PDF
This slide shows KPI dashboard which can be used to track customer service delivery by channel. It includes weekly customer satisfaction levels. Showcasing this set of slides titled Client Support Dashboard To Measure Satisfaction Level Structure PDF. The topics addressed in these templates are Executive, Customer Satisfaction Level, Email. All the content presented in this PPT design is completely editable. Download it and make adjustments in color, background, font etc. as per your unique business setting.
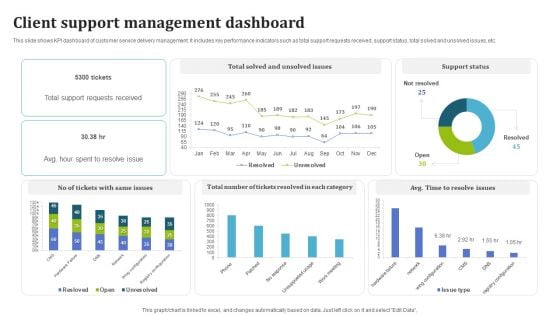
Client Support Management Dashboard Designs PDF
This slide shows KPI dashboard of customer service delivery management. It includes key performance indicators such as total support requests received, support status, total solved and unsolved issues, etc. Pitch your topic with ease and precision using this Client Support Management Dashboard Designs PDF. This layout presents information on Client Support, Management Dashboard. It is also available for immediate download and adjustment. So, changes can be made in the color, design, graphics or any other component to create a unique layout.
Client Support Performance Tracking Dashboard Template PDF
This slide shows KPI dashboard which can be used by organizations to track customer service delivery dashboard. It includes customer satisfaction score, total cases received, cases responses, etc. Showcasing this set of slides titled Client Support Performance Tracking Dashboard Template PDF. The topics addressed in these templates are Customer Satisfaction Score, Average, Cases By Product. All the content presented in this PPT design is completely editable. Download it and make adjustments in color, background, font etc. as per your unique business setting.
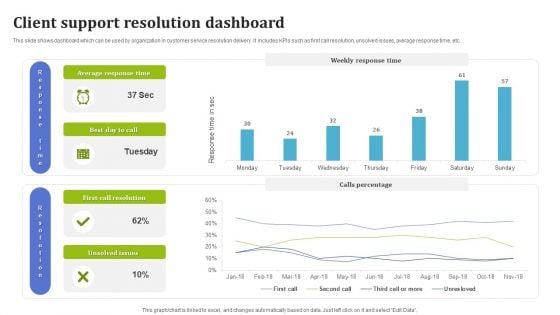
Client Support Resolution Dashboard Graphics PDF
This slide shows dashboard which can be used by organization in customer service resolution delivery. It includes KPIs such as first call resolution, unsolved issues, average response time, etc. Pitch your topic with ease and precision using this Client Support Resolution Dashboard Graphics PDF. This layout presents information on Client Support, Resolution Dashboard. It is also available for immediate download and adjustment. So, changes can be made in the color, design, graphics or any other component to create a unique layout.


 Continue with Email

 Home
Home


