Banking Technology
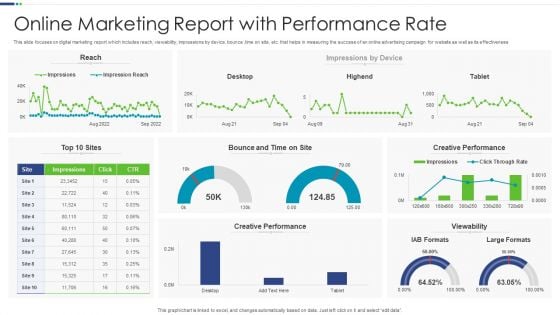
Online Marketing Report With Performance Rate Microsoft PDF
This slide focuses on digital marketing report which includes reach, viewability, impressions by device, bounce ,time on site, etc. that helps in measuring the success of an online advertising campaign for website as well as its effectiveness.Pitch your topic with ease and precision using this Online Marketing Report With Performance Rate Microsoft PDF This layout presents information on Creative Performance, Viewability, Creative Performance It is also available for immediate download and adjustment. So, changes can be made in the color, design, graphics or any other component to create a unique layout.
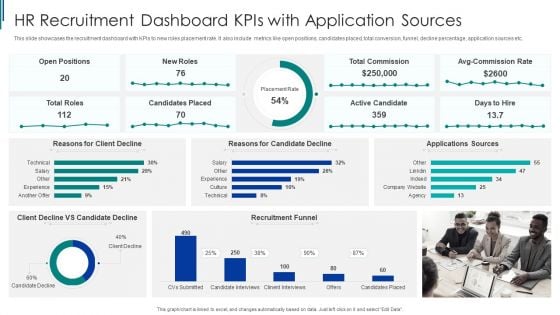
HR Recruitment Dashboard Kpis With Application Sources Ppt Pictures Styles PDF
This slide showcases the recruitment dashboard with KPIs to new roles placement rate. It also include metrics like open positions, candidates placed, total conversion, funnel, decline percentage, application sources etc. Pitch your topic with ease and precision using this HR Recruitment Dashboard Kpis With Application Sources Ppt Pictures Styles PDF. This layout presents information on Recruitment Funnel, HR Recruitment, Dashboard Kpis. It is also available for immediate download and adjustment. So, changes can be made in the color, design, graphics or any other component to create a unique layout.
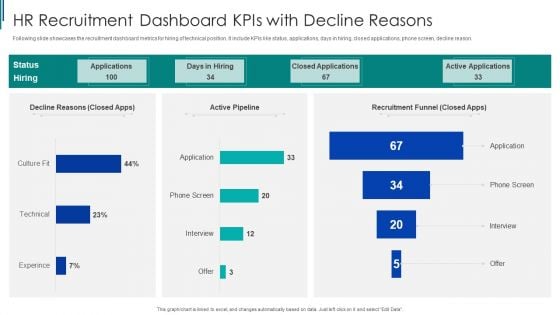
HR Recruitment Dashboard Kpis With Decline Reasons Ppt Pictures Example Introduction PDF
Following slide showcases the recruitment dashboard metrics for hiring of technical position. It include KPIs like status, applications, days in hiring, closed applications, phone screen, decline reason. Showcasing this set of slides titled HR Recruitment Dashboard Kpis With Decline Reasons Ppt Pictures Example Introduction PDF. The topics addressed in these templates are Recruitment Funnel, HR Recruitment, Dashboard Kpis. All the content presented in this PPT design is completely editable. Download it and make adjustments in color, background, font etc. as per your unique business setting.
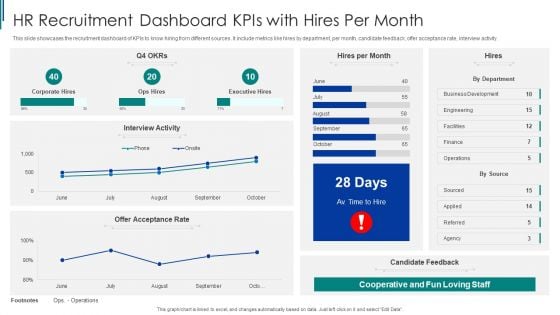
HR Recruitment Dashboard Kpis With Hires Per Month Ppt Slides Portfolio PDF
This slide showcases the recruitment dashboard of KPIs to know hiring from different sources. It include metrics like hires by department, per month, candidate feedback, offer acceptance rate, interview activity. Pitch your topic with ease and precision using this HR Recruitment Dashboard Kpis With Hires Per Month Ppt Slides Portfolio PDF. This layout presents information on HR Recruitment, Dashboard Kpis, Business Development. It is also available for immediate download and adjustment. So, changes can be made in the color, design, graphics or any other component to create a unique layout.

HR Recruitment Dashboard Kpis With Open Positions Ppt Model Good PDF
Following slide showcases the recruitment dashboard metrics for measuring placement per department. It include KPIs like applications received by departments, applicant details, sources, time to hire. Pitch your topic with ease and precision using this HR Recruitment Dashboard Kpis With Open Positions Ppt Model Good PDF. This layout presents information on Offer Acceptance Ratio, Recruitment Funnel, Applicant Details. It is also available for immediate download and adjustment. So, changes can be made in the color, design, graphics or any other component to create a unique layout.
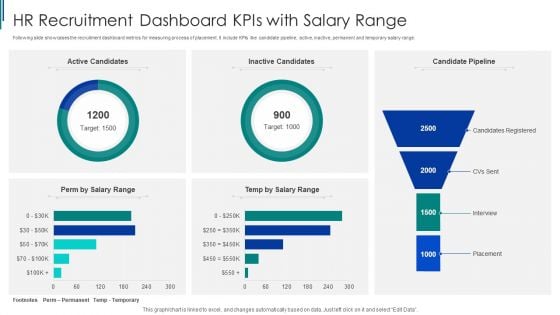
HR Recruitment Dashboard Kpis With Salary Range Ppt Inspiration Rules PDF
Following slide showcases the recruitment dashboard metrics for measuring process of placement. It include KPIs like candidate pipeline, active, inactive, permanent and temporary salary range. Pitch your topic with ease and precision using this HR Recruitment Dashboard Kpis With Salary Range Ppt Inspiration Rules PDF. This layout presents information on HR Recruitment, Dashboard Kpis, Salary Range. It is also available for immediate download and adjustment. So, changes can be made in the color, design, graphics or any other component to create a unique layout.
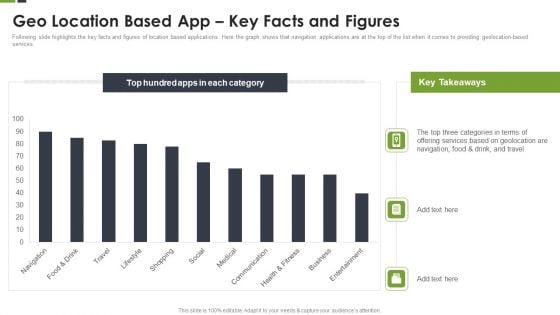
LBS Application Elevator Geo Location Based App Key Facts And Figures Ppt Infographic Template Example Topics PDF
Following slide highlights the key facts and figures of location based applications. Here the graph shows that navigation applications are at the top of the list when it comes to providing geolocation-based services. Deliver and pitch your topic in the best possible manner with this LBS Application Elevator Geo Location Based App Key Facts And Figures Ppt Infographic Template Example Topics PDF. Use them to share invaluable insights on Health Fitness, Business Entertainment, Social Medical and impress your audience. This template can be altered and modified as per your expectations. So, grab it now.
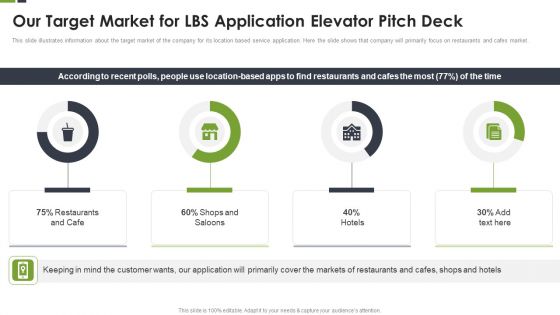
Our Target Market For LBS Application Elevator Pitch Deck Ppt Professional Elements PDF
This slide illustrates information about the target market of the company for its location based service application. Here the slide shows that company will primarily focus on restaurants and cafes market. Deliver an awe inspiring pitch with this creative Our Target Market For LBS Application Elevator Pitch Deck Ppt Professional Elements PDF bundle. Topics like Customer Wants, Keeping Mind, Primarily Cover can be discussed with this completely editable template. It is available for immediate download depending on the needs and requirements of the user.
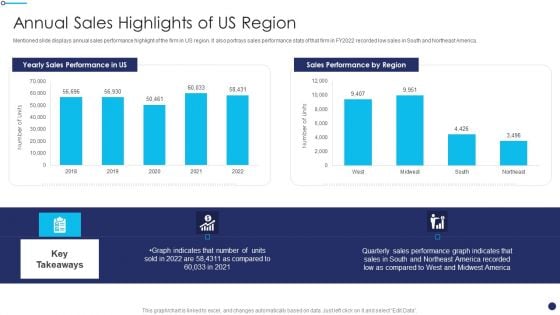
Effective Sales Technique For New Product Launch Annual Sales Highlights Of US Region Inspiration PDF
Mentioned slide displays annual sales performance highlight of the firm in US region. It also portrays sales performance stats of that firm in FY2022 recorded low sales in South and Northeast America. Deliver an awe inspiring pitch with this creative Effective Sales Technique For New Product Launch Annual Sales Highlights Of US Region Inspiration PDF bundle. Topics like Sales Performance, Graph Indicates, Performance Graph can be discussed with this completely editable template. It is available for immediate download depending on the needs and requirements of the user.
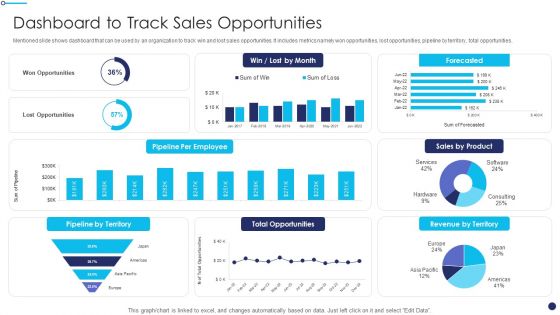
Effective Sales Technique For New Product Launch Dashboard To Track Sales Opportunities Introduction PDF
Mentioned slide shows dashboard that can be used by an organization to track win and lost sales opportunities. It includes metrics namely won opportunities, lost opportunities, pipeline by territory, total opportunities.Deliver an awe inspiring pitch with this creative Effective Sales Technique For New Product Launch Dashboard To Track Sales Opportunities Introduction PDF bundle. Topics like Lost Opportunities, Total Opportunities, Revenue Territory can be discussed with this completely editable template. It is available for immediate download depending on the needs and requirements of the user.
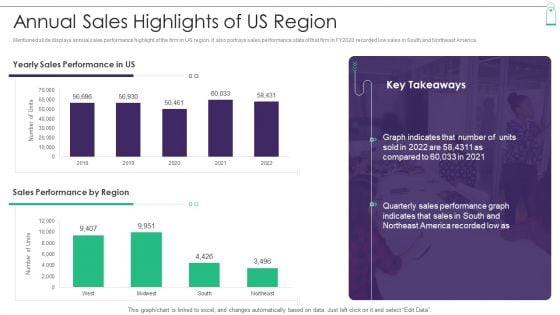
New Product Sales Strategy And Marketing Annual Sales Highlights Of Us Region Graphics PDF
Mentioned slide displays annual sales performance highlight of the firm in US region. It also portrays sales performance stats of that firm in FY2020 recorded low sales in South and Northeast America. Deliver and pitch your topic in the best possible manner with this New Product Sales Strategy And Marketing Annual Sales Highlights Of Us Region Graphics PDF. Use them to share invaluable insights on Sales Performance, Quarterly Sales, Annual Sales and impress your audience. This template can be altered and modified as per your expectations. So, grab it now.
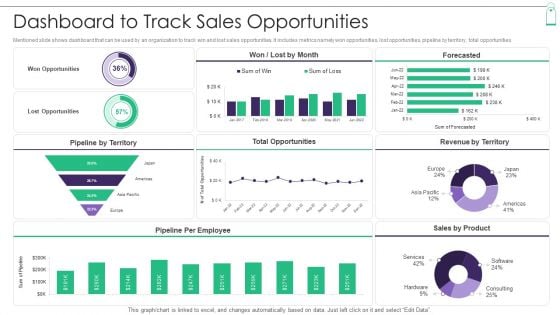
New Product Sales Strategy And Marketing Dashboard To Track Sales Opportunities Rules PDF
Mentioned slide shows dashboard that can be used by an organization to track win and lost sales opportunities. It includes metrics namely won opportunities, lost opportunities, pipeline by territory, total opportunities. Deliver and pitch your topic in the best possible manner with this New Product Sales Strategy And Marketing Dashboard To Track Sales Opportunities Rules PDF. Use them to share invaluable insights on Won Opportunities, Lost Opportunities, Revenue and impress your audience. This template can be altered and modified as per your expectations. So, grab it now.
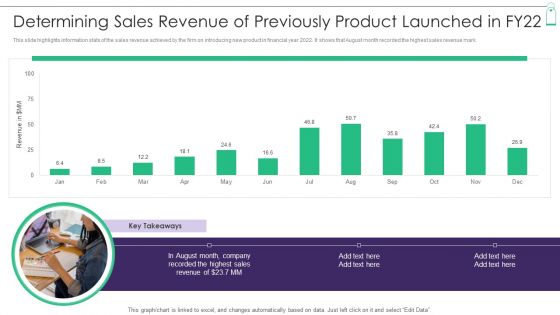
New Product Sales Strategy And Marketing Determining Sales Revenue Of Previously Product Brochure PDF
This slide highlights information stats of the sales revenue achieved by the firm on introducing new product in financial year 2022. It shows that August month recorded the highest sales revenue mark. Deliver and pitch your topic in the best possible manner with this New Product Sales Strategy And Marketing Determining Sales Revenue Of Previously Product Brochure PDF. Use them to share invaluable insights on Sales Revenue, Previously Product, Revenue and impress your audience. This template can be altered and modified as per your expectations. So, grab it now.
Project Transition Plan Dashboard For Issues Tracking Ppt PowerPoint Presentation File Example PDF
This slide shows the issues tracking the dashboard for the business transition project. It provides details of multiple issues faced by users to keep records for effective management of the project. Deliver an awe inspiring pitch with this creative Project Transition Plan Dashboard For Issues Tracking Ppt PowerPoint Presentation File Example PDF bundle. Topics like Employee Wise, Immediate Issues, Suspect Requirements can be discussed with this completely editable template. It is available for immediate download depending on the needs and requirements of the user.

Effective Sales Plan For New Product Introduction In Market Annual Sales Highlights Template PDF
Mentioned slide displays annual sales performance highlight of the firm in US region. It also portrays sales performance stats of that firm in FY2020 recorded low sales in South and Northeast America. Deliver an awe inspiring pitch with this creative Effective Sales Plan For New Product Introduction In Market Annual Sales Highlights Template PDF bundle. Topics like Sales Performance, Graph Indicates, Key Takeaways can be discussed with this completely editable template. It is available for immediate download depending on the needs and requirements of the user.
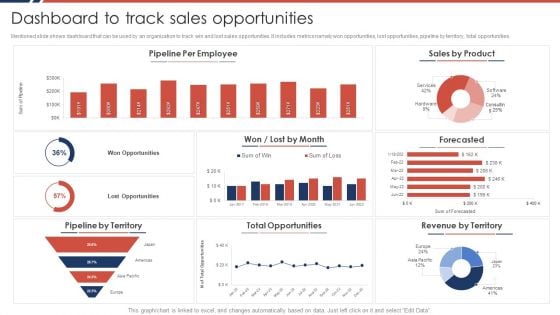
Effective Sales Plan For New Product Introduction In Market Dashboard To Track Sales Opportunities Formats PDF
Mentioned slide shows dashboard that can be used by an organization to track win and lost sales opportunities. It includes metrics namely won opportunities, lost opportunities, pipeline by territory, total opportunities.Deliver an awe inspiring pitch with this creative Effective Sales Plan For New Product Introduction In Market Dashboard To Track Sales Opportunities Formats PDF bundle. Topics like Pipeline Employee, Total Opportunities, Revenue Territory can be discussed with this completely editable template. It is available for immediate download depending on the needs and requirements of the user.
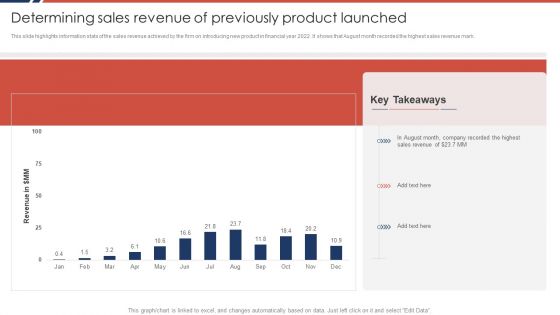
Effective Sales Plan For New Product Introduction In Market Determining Sales Revenue Of Previously Information PDF
This slide highlights information stats of the sales revenue achieved by the firm on introducing new product in financial year 2022. It shows that August month recorded the highest sales revenue mark.Deliver an awe inspiring pitch with this creative Effective Sales Plan For New Product Introduction In Market Determining Sales Revenue Of Previously Information PDF bundle. Topics like Determining Sales, Revenue Previously, Product Launched can be discussed with this completely editable template. It is available for immediate download depending on the needs and requirements of the user.
Automating Supply Chain Procurement Automation Strategy End To End Process Tracking Portrait PDF
This slide covers tool for analysing end to end procurement process. It includes features such as tracking real- time overall business health, checking quotation to order conversion, automated notifications and payments reminders, etc. Deliver an awe inspiring pitch with this creative Automating Supply Chain Procurement Automation Strategy End To End Process Tracking Portrait PDF bundle. Topics like Total Sales, Total Purchase, Amount Receivable can be discussed with this completely editable template. It is available for immediate download depending on the needs and requirements of the user.
Automating Supply Chain Dashboard For Tracking Impact Of Supply Chain Automation Pictures PDF
This slide covers the dashboard for back-end tracking of overall impact automation. It include KPIs such as retailer capacity, warehouse capacity, truck efficiency, time to reach warehouse, sustainability, etc. Deliver and pitch your topic in the best possible manner with this Automating Supply Chain Dashboard For Tracking Impact Of Supply Chain Automation Pictures PDF. Use them to share invaluable insights on Supply Chain Manager, Warehouse Manager, Truck Driver and impress your audience. This template can be altered and modified as per your expectations. So, grab it now.
Automating Supply Chain Dashboard For Tracking Impact Of Transport Automation Themes PDF
This slide covers the dashboard for tracking vehicle efficiency after transport automation. It include KPIs such as truck turnaround time, average revenue per hour, truckload capacity, transit time, on-time pickup, and average revenue per mile. Deliver an awe inspiring pitch with this creative Automating Supply Chain Dashboard For Tracking Impact Of Transport Automation Themes PDF bundle. Topics like Average Revenue, Per Mile, Truck Turnaround can be discussed with this completely editable template. It is available for immediate download depending on the needs and requirements of the user.
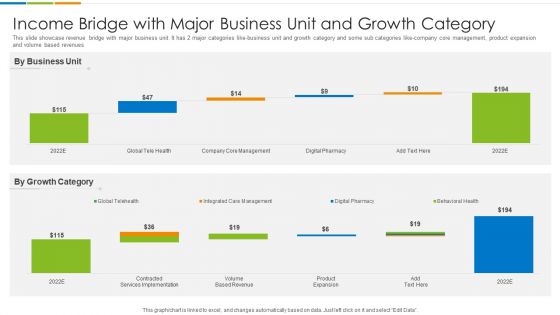
Income Bridge With Major Business Unit And Growth Category Ppt PowerPoint Presentation Gallery Format PDF
This slide showcase revenue bridge with major business unit. It has 2 major categories like-business unit and growth category and some sub categories like-company core management, product expansion and volume based revenues. Showcasing this set of slides titled Income Bridge With Major Business Unit And Growth Category Ppt PowerPoint Presentation Gallery Format PDF. The topics addressed in these templates are Business Unit, Growth Category, Product Expansion. All the content presented in this PPT design is completely editable. Download it and make adjustments in color, background, font etc. as per your unique business setting.
How To Implement Cloud Collaboration Cloud Platform Dashboard For Tracking Project Team Professional PDF
The following slide depicts project team task tracking cloud dashboard. It provides information about hours worked, projects worked, time spent, daily limit, product design, weekly activity, etc. Deliver and pitch your topic in the best possible manner with this How To Implement Cloud Collaboration Cloud Platform Dashboard For Tracking Project Team Professional PDF. Use them to share invaluable insights on Today Activity, Daily Limits, Recent Activity and impress your audience. This template can be altered and modified as per your expectations. So, grab it now.
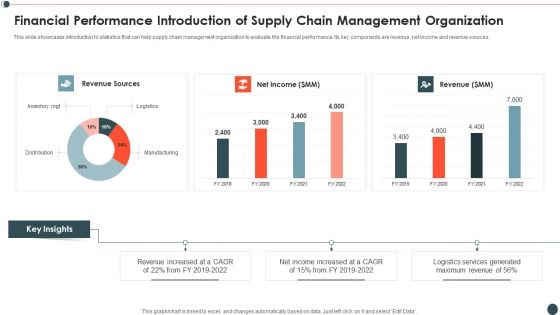
Financial Performance Introduction Of Supply Chain Management Organization Infographics PDF
This slide showcases introduction to statistics that can help supply chain management organization to evaluate the financial performance. Its key components are revenue, net income and revenue sources.Pitch your topic with ease and precision using this Financial Performance Introduction Of Supply Chain Management Organization Infographics PDF This layout presents information on Revenue Sources, Revenue Increased, Income Increased It is also available for immediate download and adjustment. So, changes can be made in the color, design, graphics or any other component to create a unique layout.
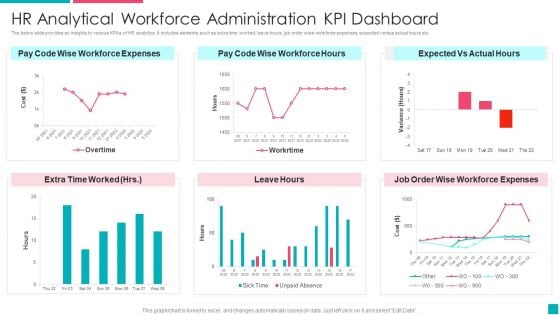
HR Analytical Workforce Administration Kpi Dashboard Introduction PDF
The below slide provides an insights to various KPAs of HR analytics. It includes elements such as extra time worked, leave hours, job order wise workforce expenses, expected versus actual hours etc. Showcasing this set of slides titled HR Analytical Workforce Administration Kpi Dashboard Introduction PDF. The topics addressed in these templates are Workforce Expenses, Administration KPI Dashboard. All the content presented in this PPT design is completely editable. Download it and make adjustments in color, background, font etc. as per your unique business setting.
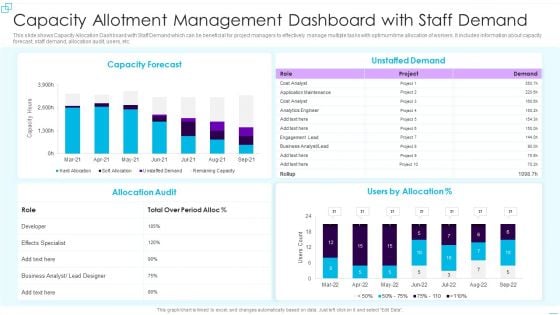
Capacity Allotment Management Dashboard With Staff Demand Rules PDF
This slide shows Capacity Allocation Dashboard with Staff Demand which can be beneficial for project managers to effectively manage multiple tasks with optimum time allocation of workers. It includes information about capacity forecast, staff demand, allocation audit, users, etc. Showcasing this set of slides titled Capacity Allotment Management Dashboard With Staff Demand Rules PDF. The topics addressed in these templates are Capacity Forecast, Allocation Audit, Unstaffed Demand. All the content presented in this PPT design is completely editable. Download it and make adjustments in color, background, font etc. as per your unique business setting.
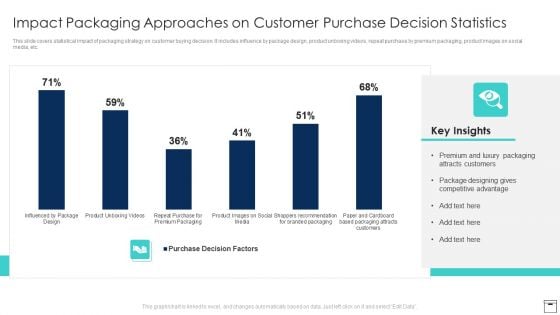
Impact Packaging Approaches On Customer Purchase Decision Statistics Information PDF
This slide covers statistical impact of packaging strategy on customer buying decision. It includes influence by package design, product unboxing videos, repeat purchase by premium packaging, product images on social media, etc. Showcasing this set of slides titled Impact Packaging Approaches On Customer Purchase Decision Statistics Information PDF. The topics addressed in these templates are Attracts Customers, Customer Purchase, Social Media. All the content presented in this PPT design is completely editable. Download it and make adjustments in color, background, font etc. as per your unique business setting.
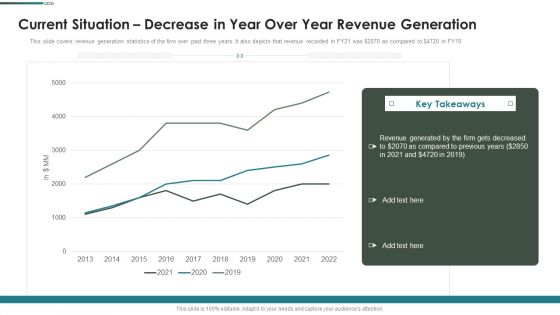
Purchase Assessment Process Current Situation Decrease In Year Over Year Revenue Generation Introduction PDF
This slide covers revenue generation statistics of the firm over past three years. It also depicts that revenue recorded in FY21 was dollar2070 as compared to dollar 4720 in FY19.Deliver and pitch your topic in the best possible manner with this Purchase Assessment Process Current Situation Decrease In Year Over Year Revenue Generation Introduction PDF Use them to share invaluable insights on Key Takeaways, Revenue Generated, Compared To Previous and impress your audience. This template can be altered and modified as per your expectations. So, grab it now.
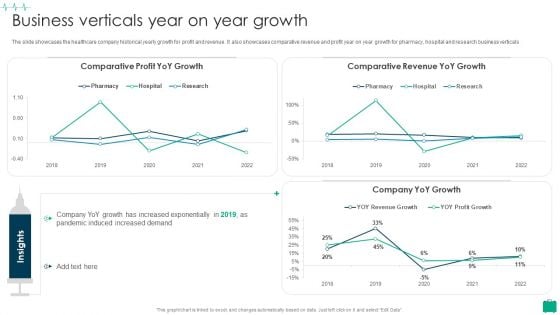
Healthcare Services Company Profile Business Verticals Year On Year Growth Summary PDF
The slide showcases the healthcare company historical yearly growth for profit and revenue. It also showcases comparative revenue and profit year on year growth for pharmacy, hospital and research business verticals.Deliver and pitch your topic in the best possible manner with this Healthcare Services Company Profile Business Verticals Year On Year Growth Summary PDF Use them to share invaluable insights on Comparative Profit, Comparative Revenue, Increased Exponentially and impress your audience. This template can be altered and modified as per your expectations. So, grab it now.
Implementation Strategy For Project Solution Dashboard For Issues Tracking Summary PDF
This slide shows the issues tracking the dashboard for the business transition project. It provides details of multiple issues faced by users to keep records for effective management of the project. Deliver an awe inspiring pitch with this creative Implementation Strategy For Project Solution Dashboard For Issues Tracking Summary PDF bundle. Topics like Overall Issues Status, Employee Wise Issues Status, Immediate Issues can be discussed with this completely editable template. It is available for immediate download depending on the needs and requirements of the user.
Transformation Plan Issues Tracking Dashboard For Transition Project Ppt PowerPoint Presentation File Styles PDF
This slide shows the issues tracking the dashboard for the business transition project. It provides details of multiple issues faced by users to keep records for effective management of the project. Deliver an awe inspiring pitch with this creative Transformation Plan Issues Tracking Dashboard For Transition Project Ppt PowerPoint Presentation File Styles PDF bundle. Topics like Immediate Issues, High Churn Issues, Suspect Requirements can be discussed with this completely editable template. It is available for immediate download depending on the needs and requirements of the user.
Effective Company Event Communication Plan Dashboard For Tracking Active Number Microsoft PDF
This slide covers metrics for analyzing the number of most active event participants. It includes KPIs such as check-in status, contract roles, top industries, contract by country, top 5 job functions, etc. Deliver and pitch your topic in the best possible manner with this Effective Company Event Communication Plan Dashboard For Tracking Active Number Microsoft PDF Use them to share invaluable insights on Marketing, Management Less, Attendance and impress your audience. This template can be altered and modified as per your expectations. So, grab it now.
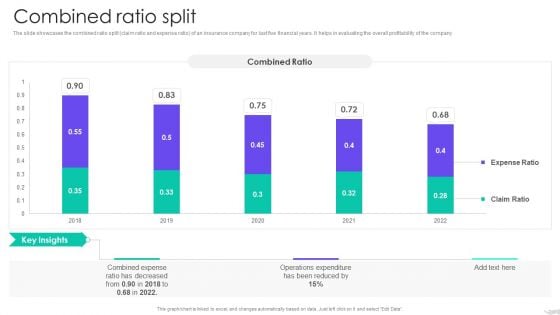
Insurance Services Firm Profile Combined Ratio Split Download PDF
The slide showcases the combined ratio split claim ratio and expense ratio of an insurance company for last five financial years. It helps in evaluating the overall profitability of the company Deliver and pitch your topic in the best possible manner with this Insurance Services Firm Profile Combined Ratio Split Download PDF . Use them to share invaluable insights on Combined Expense, Operations Expenditure, Combined Ratio and impress your audience. This template can be altered and modified as per your expectations. So, grab it now.
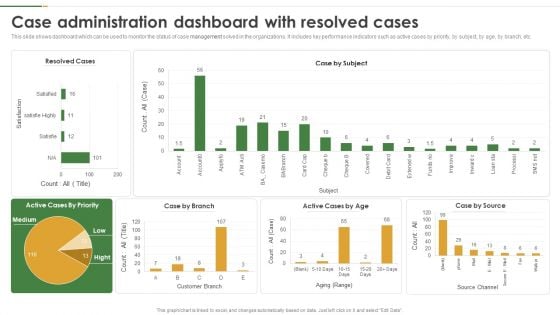
Case Administration Dashboard With Resolved Cases Graphics PDF
This slide shows dashboard which can be used to monitor the status of case management solved in the organizations. It includes key performance indicators such as active cases by priority, by subject, by age, by branch, etc. Pitch your topic with ease and precision using this Case Administration Dashboard With Resolved Cases Graphics PDF. This layout presents information on Case Administration Dashboard, Resolved Cases. It is also available for immediate download and adjustment. So, changes can be made in the color, design, graphics or any other component to create a unique layout.

Action Plan To Optimize Hiring Process Dashboard To Analyze Application Sources And Days To Hire Themes PDF
This slide showcases dashboard that can help organization to evaluate average days taken to hire a candidate and major sources of application. It also showcases various other components which are open positions, candidates place, avg commission rate, reasons for candidate and client decline.Deliver and pitch your topic in the best possible manner with this Action Plan To Optimize Hiring Process Dashboard To Analyze Application Sources And Days To Hire Themes PDF Use them to share invaluable insights on Open Positions, Recruitment Funnel, Total Commission and impress your audience. This template can be altered and modified as per your expectations. So, grab it now.
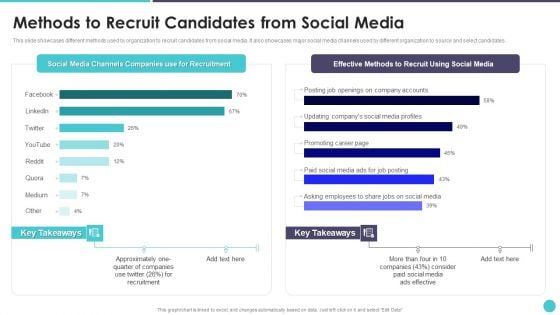
Action Plan To Optimize Hiring Process Methods To Recruit Candidates From Social Media Designs PDF
This slide showcases different methods used by organization to recruit candidates from social media. It also showcases major social media channels used by different organization to source and select candidates.Deliver an awe inspiring pitch with this creative Action Plan To Optimize Hiring Process Methods To Recruit Candidates From Social Media Designs PDF bundle. Topics like Channels Companies, Effective Methods, Posting Openings can be discussed with this completely editable template. It is available for immediate download depending on the needs and requirements of the user.
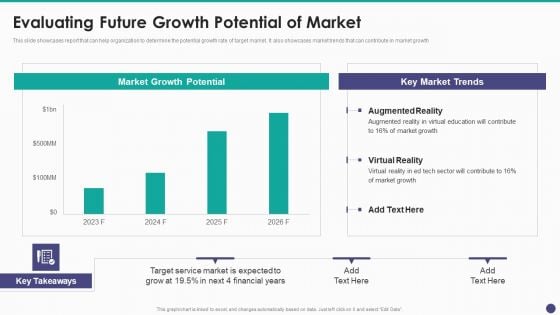
New Service Launch And Development Strategy To Gain Market Share Evaluating Future Growth Potential Of Market Clipart PDF
This slide showcases report that can help organization to determine the potential growth rate of target market. It also showcases market trends that can contribute in market growth.Deliver an awe inspiring pitch with this creative New Service Launch And Development Strategy To Gain Market Share Evaluating Future Growth Potential Of Market Clipart PDF bundle. Topics like Growth Potential, Market Trends, Augmented Reality can be discussed with this completely editable template. It is available for immediate download depending on the needs and requirements of the user.
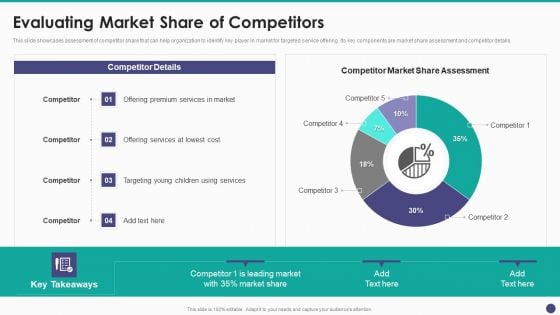
New Service Launch And Development Strategy To Gain Market Share Evaluating Market Share Of Competitors Information PDF
This slide showcases assessment of competitor share that can help organization to identify key player in market for targeted service offering. Its key components are market share assessment and competitor details.Deliver and pitch your topic in the best possible manner with this New Service Launch And Development Strategy To Gain Market Share Evaluating Market Share Of Competitors Information PDF Use them to share invaluable insights on Competitor Details, Competitor Market, Premium Services and impress your audience. This template can be altered and modified as per your expectations. So, grab it now.
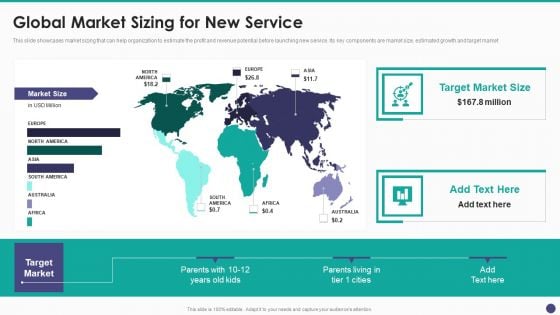
New Service Launch And Development Strategy To Gain Market Share Global Market Sizing For New Service Diagrams PDF
This slide showcases market sizing that can help organization to estimate the profit and revenue potential before launching new service. Its key components are market size, estimated growth and target market.Deliver and pitch your topic in the best possible manner with this New Service Launch And Development Strategy To Gain Market Share Global Market Sizing For New Service Diagrams PDF Use them to share invaluable insights on Global Market, Sizing, New Service and impress your audience. This template can be altered and modified as per your expectations. So, grab it now.
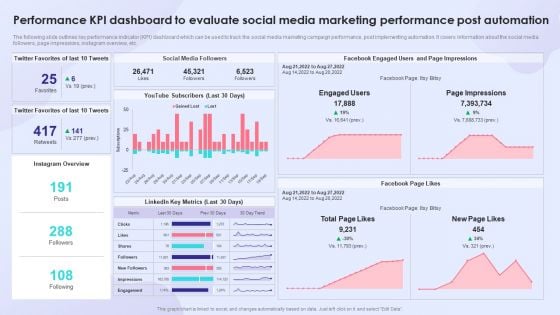
Performance KPI Dashboard To Evaluate Social Media Marketing Performance Post Automation Themes PDF
The following slide outlines key performance indicator KPI dashboard which can be used to track the social media marketing campaign performance, post implementing automation. It covers information about the social media followers, page impressions, instagram overview, etc. Deliver and pitch your topic in the best possible manner with this Performance KPI Dashboard To Evaluate Social Media Marketing Performance Post Automation Themes PDF. Use them to share invaluable insights on Social Media Followers, Linkedin Key Metrics, Performance KPI Dashboard and impress your audience. This template can be altered and modified as per your expectations. So, grab it now.

Home Insurance Analytics Statistics With Settlement Time Dashboard Ideas PDF
This slide illustrates home insurance facts and figures of the organization. It includes monthly claim volume, claim status, average notification time, acknowledged time, decision time etc. Pitch your topic with ease and precision using this Home Insurance Analytics Statistics With Settlement Time Dashboard Ideas PDF. This layout presents information on Average Acknowledged Time, Average Decision Time, Average Lead Time. It is also available for immediate download and adjustment. So, changes can be made in the color, design, graphics or any other component to create a unique layout.
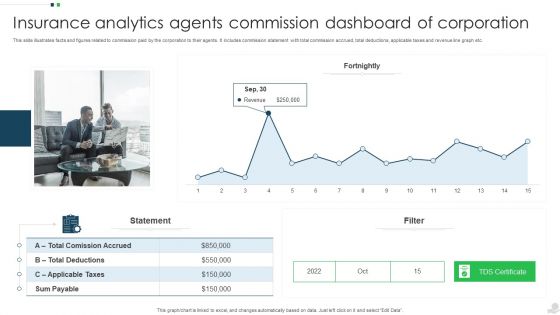
Insurance Analytics Agents Commission Dashboard Of Corporation Introduction PDF
This slide illustrates facts and figures related to commission paid by the corporation to their agents. It includes commission statement with total commission accrued, total deductions, applicable taxes and revenue line graph etc. Pitch your topic with ease and precision using this Insurance Analytics Agents Commission Dashboard Of Corporation Introduction PDF. This layout presents information on Applicable Taxes, Sum Payable, Revenue. It is also available for immediate download and adjustment. So, changes can be made in the color, design, graphics or any other component to create a unique layout.
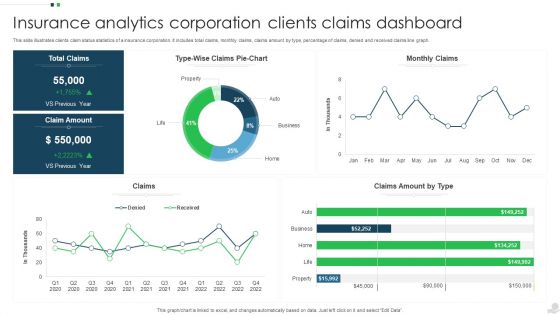
Insurance Analytics Corporation Clients Claims Dashboard Summary PDF
This slide illustrates clients claim status statistics of a insurance corporation. It includes total claims, monthly claims, claims amount by type, percentage of claims, denied and received claims line graph. Showcasing this set of slides titled Insurance Analytics Corporation Clients Claims Dashboard Summary PDF. The topics addressed in these templates are Insurance Analytics Corporation, Clients Claims Dashboard. All the content presented in this PPT design is completely editable. Download it and make adjustments in color, background, font etc. as per your unique business setting.
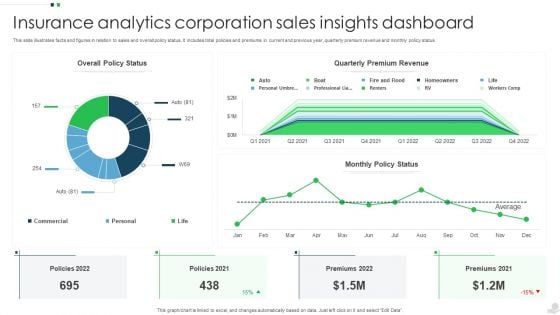
Insurance Analytics Corporation Sales Insights Dashboard Structure PDF
This slide illustrates facts and figures in relation to sales and overall policy status. It includes total policies and premiums in current and previous year, quarterly premium revenue and monthly policy status. Pitch your topic with ease and precision using this Insurance Analytics Corporation Sales Insights Dashboard Structure PDF. This layout presents information on Quarterly Premium Revenue, Sales Insights Dashboard, Insurance Analytics Corporation. It is also available for immediate download and adjustment. So, changes can be made in the color, design, graphics or any other component to create a unique layout.
Insurance Analytics Enrollment Around The World Dashboard Icons PDF
This slide illustrates total insurance enrollment of all insurance corporations. It includes monthly enrollment charts, enrollments in 2021, enrollment by scheme, enrollment levels, worldwide enrollments, enrollment age wise etc. Showcasing this set of slides titled Insurance Analytics Enrollment Around The World Dashboard Icons PDF. The topics addressed in these templates are Enrollments Levels, Enrollments Worldwide, Enrollments Age Wise. All the content presented in this PPT design is completely editable. Download it and make adjustments in color, background, font etc. as per your unique business setting.
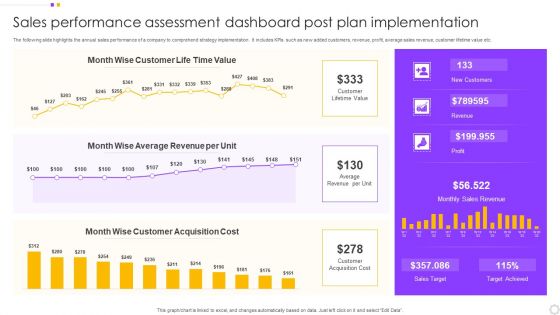
Sales Performance Assessment Dashboard Post Plan Implementation Introduction PDF
The following slide highlights the annual sales performance of a company to comprehend strategy implementation. It includes KPIs such as new added customers, revenue, profit, average sales revenue, customer lifetime value etc. Pitch your topic with ease and precision using this Sales Performance Assessment Dashboard Post Plan Implementation Introduction PDF. This layout presents information on Customer, Value, Average Revenue. It is also available for immediate download and adjustment. So, changes can be made in the color, design, graphics or any other component to create a unique layout.
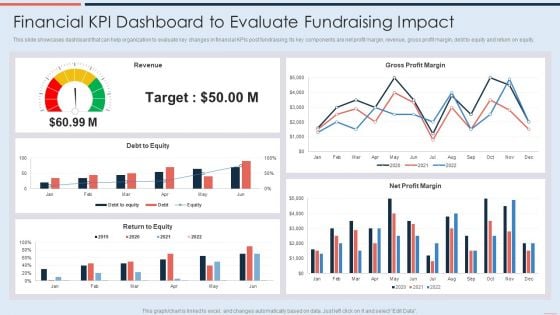
Financial Kpi Dashboard To Evaluate Fundraising Impact Demonstration PDF
This slide showcases dashboard that can help organization to evaluate key changes in financial KPIs post fundraising. Its key components are net profit margin, revenue, gross profit margin, debt to equity and return on equity. Deliver and pitch your topic in the best possible manner with this Financial Kpi Dashboard To Evaluate Fundraising Impact Demonstration PDF. Use them to share invaluable insights on Debt To Equity, Revenue, Gross Profit Margin and impress your audience. This template can be altered and modified as per your expectations. So, grab it now.
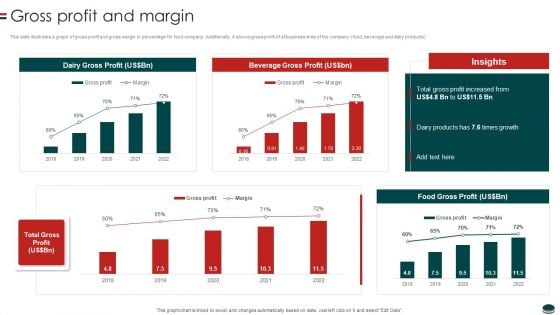
Instant Snacks And Food Firm Details Gross Profit And Margin Professional PDF
This slide illustrates a graph of gross profit and gross margin in percentage for food company. Additionally, it shows gross profit of all business lines of the company food, beverage and dairy products.Deliver an awe inspiring pitch with this creative Instant Snacks And Food Firm Details Gross Profit And Margin Professional PDF bundle. Topics like Gross Profit, Beverage Gross, Dairy Products can be discussed with this completely editable template. It is available for immediate download depending on the needs and requirements of the user.

Instant Snacks And Food Firm Details Net Profit And Margin Microsoft PDF
This slide illustrates a graph of net profit in US and gross margin in percentage for food company. Additionally, it shows net profit of all business lines of the company food, beverage and dairy products.Deliver and pitch your topic in the best possible manner with this Instant Snacks And Food Firm Details Net Profit And Margin Microsoft PDF Use them to share invaluable insights on Profit Increased, Profit Margin, Disrupted Supply and impress your audience. This template can be altered and modified as per your expectations. So, grab it now.
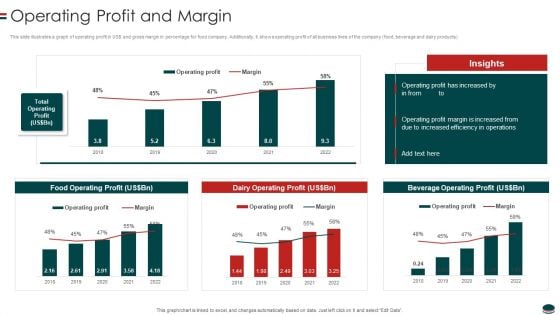
Instant Snacks And Food Firm Details Operating Profit And Margin Themes PDF
This slide illustrates a graph of operating profit in US and gross margin in percentage for food company. Additionally, it shows operating profit of all business lines of the company food, beverage and dairy products.Deliver an awe inspiring pitch with this creative Instant Snacks And Food Firm Details Operating Profit And Margin Themes PDF bundle. Topics like Operating Profit, Increased Efficiency, Beverage Operating can be discussed with this completely editable template. It is available for immediate download depending on the needs and requirements of the user.
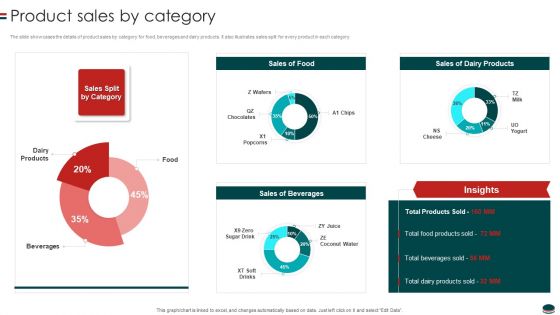
Instant Snacks And Food Firm Details Product Sales By Category Structure PDF
The slide showcases the details of product sales by category for food, beverages and dairy products. It also illustrates sales split for every product in each category Deliver and pitch your topic in the best possible manner with this Instant Snacks And Food Firm Details Product Sales By Category Structure PDF Use them to share invaluable insights on Dairy Products, Sales Beverages, Sales Of Food and impress your audience. This template can be altered and modified as per your expectations. So, grab it now.
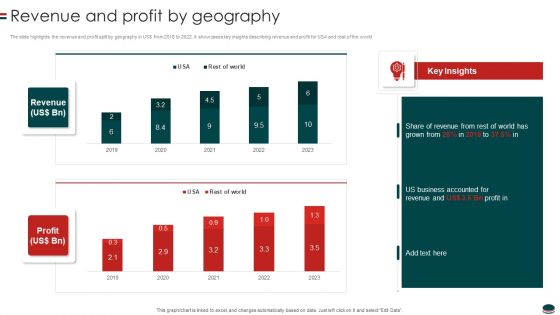
Instant Snacks And Food Firm Details Revenue And Profit By Geography Mockup PDF
The slide highlights the revenue and profit split by geography in US from 2018 to 2022. It showcases key insights describing revenue and profit for USA and rest of the world.Deliver an awe inspiring pitch with this creative Instant Snacks And Food Firm Details Revenue And Profit By Geography Mockup PDF bundle. Topics like Business Accounted, Share Of Revenue, Key Insights can be discussed with this completely editable template. It is available for immediate download depending on the needs and requirements of the user.
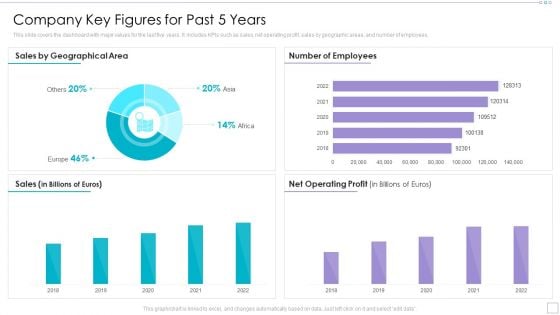
Clothing Business Market Entry Strategy Company Key Figures For Past 5 Years Infographics PDF
This slide covers the dashboard with major values for the last five years. It includes KPIs such as sales, net operating profit, sales by geographic areas, and number of employees. Deliver an awe inspiring pitch with this creative Clothing Business Market Entry Strategy Company Key Figures For Past 5 Years Infographics PDF bundle. Topics like Geographical Area, Operating Profit, Billions Of Euros can be discussed with this completely editable template. It is available for immediate download depending on the needs and requirements of the user.
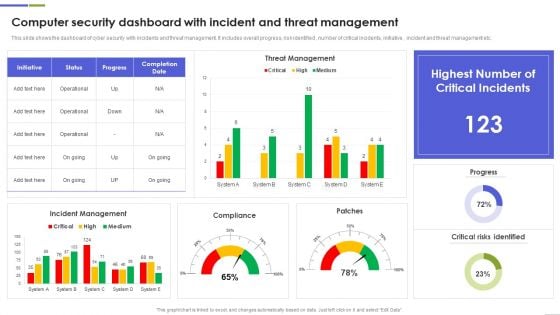
Computer Security Dashboard With Incident And Threat Management Rules PDF
This slide shows the dashboard of cyber security with incidents and threat management. It includes overall progress, risk identified , number of critical incidents, initiative , incident and threat management etc.Showcasing this set of slides titled Computer Security Dashboard With Incident And Threat Management Rules PDF The topics addressed in these templates are Critical Incidents, Risks Identified, Compliance All the content presented in this PPT design is completely editable. Download it and make adjustments in color, background, font etc. as per your unique business setting.
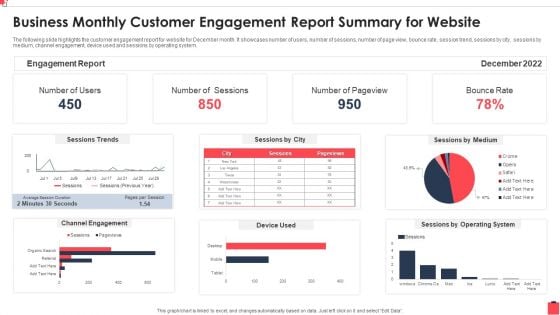
Business Monthly Customer Engagement Report Summary For Website Sample PDF
The following slide highlights the customer engagement report for website for December month. It showcases number of users, number of sessions, number of page view, bounce rate, session trend, sessions by city, sessions by medium, channel engagement, device used and sessions by operating system.Showcasing this set of slides titled Business Monthly Customer Engagement Report Summary For Website Sample PDF The topics addressed in these templates are Channel Engagement, Operating System, Bounce Rate All the content presented in this PPT design is completely editable. Download it and make adjustments in color, background, font etc. as per your unique business setting.
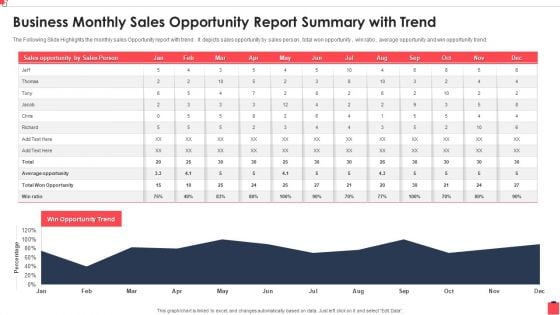
Business Monthly Sales Opportunity Report Summary With Trend Professional PDF
The Following Slide Highlights the monthly sales Opportunity report with trend . It depicts sales opportunity by sales person , total won opportunity , win ratio , average opportunity and win opportunity trend.Showcasing this set of slides titled Business Monthly Sales Opportunity Report Summary With Trend Professional PDF The topics addressed in these templates are Average Opportunity, Won Opportunity, Sales Opportunity All the content presented in this PPT design is completely editable. Download it and make adjustments in color, background, font etc. as per your unique business setting.
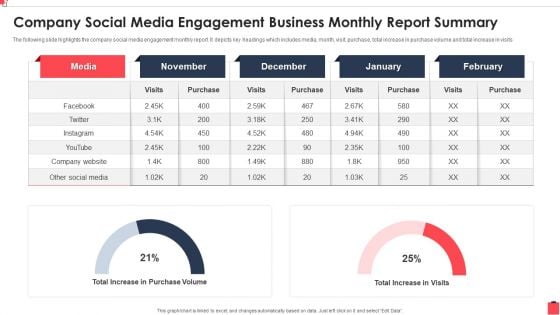
Company Social Media Engagement Business Monthly Report Summary Mockup PDF
The following slide highlights the company social media engagement monthly report. It depicts key headings which includes media, month, visit, purchase, total increase in purchase volume and total increase in visits.Pitch your topic with ease and precision using this Company Social Media Engagement Business Monthly Report Summary Mockup PDF This layout presents information on Total Increase, Company Website, Purchase Volume It is also available for immediate download and adjustment. So, changes can be made in the color, design, graphics or any other component to create a unique layout.
Weekly Tracking Dashboard For Social Media Content Inspiration PDF
This slide showcases weekly content tracking dashboard that can help organization to track the statistics of social media blogs and videos. Its key components are avg impressions per post, avg reach per post, avg engagement rate and avg click through rate.Showcasing this set of slides titled Weekly Tracking Dashboard For Social Media Content Inspiration PDF The topics addressed in these templates are Impressions Per, Impression On Facebook, Posts Reactions All the content presented in this PPT design is completely editable. Download it and make adjustments in color, background, font etc. as per your unique business setting.
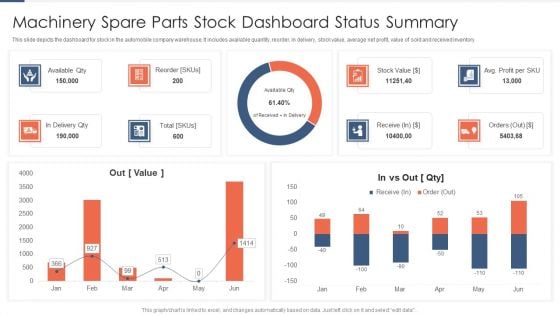
Machinery Spare Parts Stock Dashboard Status Summary Topics PDF
This slide depicts the dashboard for stock in the automobile company warehouse. It includes available quantity, reorder, in delivery, stock value, average net profit, value of sold and received inventory. Pitch your topic with ease and precision using this Machinery Spare Parts Stock Dashboard Status Summary Topics PDF. This layout presents information on Available Qty, Delivery Qty, Reorder. It is also available for immediate download and adjustment. So, changes can be made in the color, design, graphics or any other component to create a unique layout.
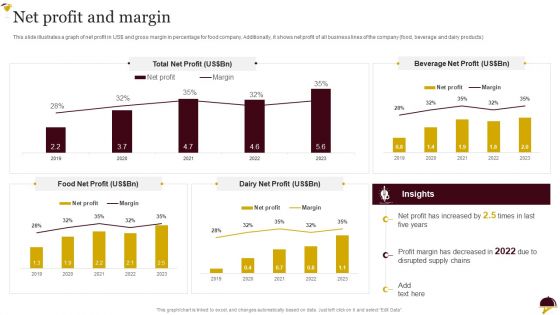
Food Company Overview Net Profit And Margin Summary PDF
This slide illustrates a graph of net profit in USdollar and gross margin in percentage for food company. Additionally, it shows net profit of all business lines of the company food, beverage and dairy products.Deliver and pitch your topic in the best possible manner with this Food Company Overview Net Profit And Margin Summary PDF Use them to share invaluable insights on Beverage Net, Margin Decreased, Disrupted Supply and impress your audience. This template can be altered and modified as per your expectations. So, grab it now.
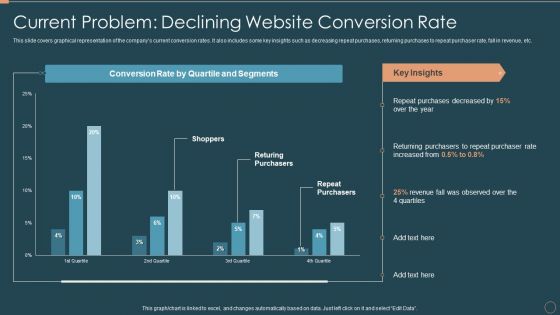
Remarketing Techniques Current Problem Declining Website Conversion Rate Brochure PDF
This slide covers graphical representation of the companys current conversion rates. It also includes some key insights such as decreasing repeat purchases, returning purchases to repeat purchaser rate, fall in revenue, etc. Deliver an awe inspiring pitch with this creative Remarketing Techniques Current Problem Declining Website Conversion Rate Brochure PDF bundle. Topics like Conversion Rate, Quartile And Segments, Repeat Purchases Decreased can be discussed with this completely editable template. It is available for immediate download depending on the needs and requirements of the user.


 Continue with Email

 Home
Home


