Banking Technology
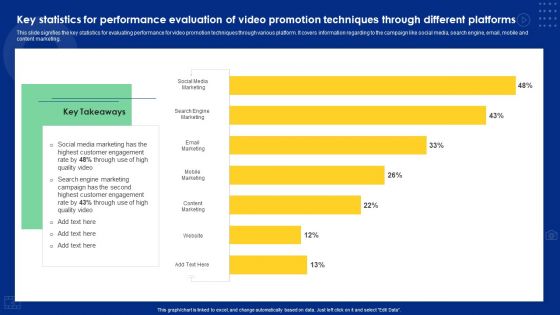
Key Statistics For Performance Evaluation Of Video Promotion Techniques Through Different Platforms Sample PDF
This slide signifies the key statistics for evaluating performance for video promotion techniques through various platform. It covers information regarding to the campaign like social media, search engine, email, mobile and content marketing. Showcasing this set of slides titled Key Statistics For Performance Evaluation Of Video Promotion Techniques Through Different Platforms Sample PDF. The topics addressed in these templates are Social Media Marketing, Search Engine Marketing, Email Marketing. All the content presented in this PPT design is completely editable. Download it and make adjustments in color, background, font etc. as per your unique business setting.
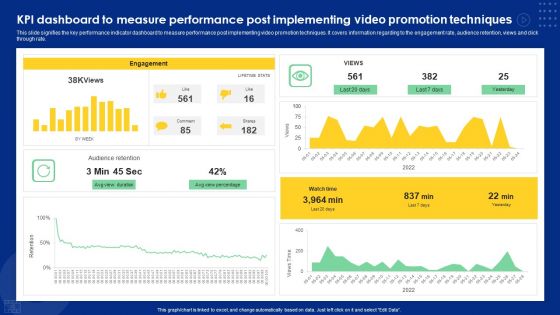
KPI Dashboard To Measure Performance Post Implementing Video Promotion Techniques Ideas PDF
This slide signifies the key performance indicator dashboard to measure performance post implementing video promotion techniques. It covers information regarding to the engagement rate, audience retention, views and click through rate. Pitch your topic with ease and precision using this KPI Dashboard To Measure Performance Post Implementing Video Promotion Techniques Ideas PDF. This layout presents information on Engagement, Audience Retention, Watch Time. It is also available for immediate download and adjustment. So, changes can be made in the color, design, graphics or any other component to create a unique layout.
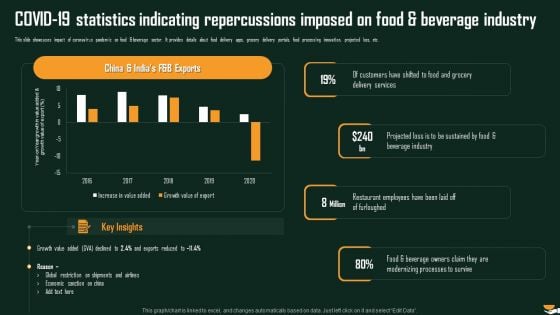
COVID 19 Statistics Indicating Repercussions Imposed On Food And Beverage Industry Demonstration PDF
This slide showcases impact of coronavirus pandemic on food beverage sector. It provides details about food delivery apps, grocery delivery portals, food processing innovation, projected loss, etc. Deliver and pitch your topic in the best possible manner with this COVID 19 Statistics Indicating Repercussions Imposed On Food And Beverage Industry Demonstration PDF. Use them to share invaluable insights on Delivery Services, Beverage Industry, Sustained Food and impress your audience. This template can be altered and modified as per your expectations. So, grab it now.

Product Procurement Management Dashboard With Defect Rate Supplier Availability And Lead Time Pictures PDF
This slide shows a dashboard of procurement to provide real time information about various components. It includes defect rate, on time supplies , supplier availability and lead time. Showcasing this set of slides titled Product Procurement Management Dashboard With Defect Rate Supplier Availability And Lead Time Pictures PDF. The topics addressed in these templates are Supplier Defect Rate, Supplier Availability, Lead Time. All the content presented in this PPT design is completely editable. Download it and make adjustments in color, background, font etc. as per your unique business setting.
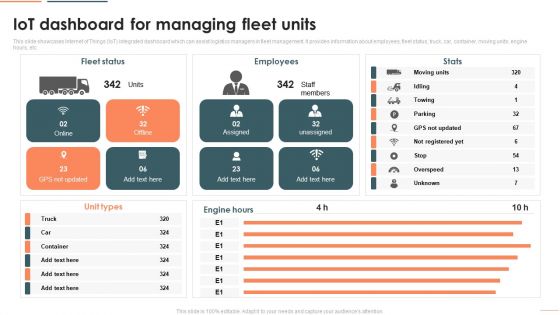
Deploying Iot In Logistics And Supply Chain Iot Dashboard For Managing Fleet Units Download PDF
This slide showcases Internet of Things IoT integrated dashboard which can assist logistics managers in fleet management. It provides information about employees, fleet status, truck, car, container, moving units, engine hours, etc. Deliver and pitch your topic in the best possible manner with this Deploying Iot In Logistics And Supply Chain Iot Dashboard For Managing Fleet Units Download PDF. Use them to share invaluable insights on Fleet Status, Employees, Unit Types and impress your audience. This template can be altered and modified as per your expectations. So, grab it now.
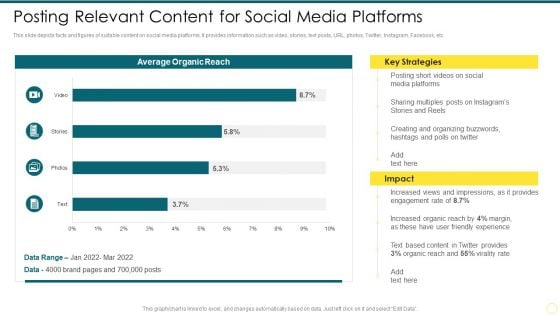
Strategies To Enhance Social Media Posting Relevant Content For Social Media Platforms Designs PDF
This slide depicts facts and figures of suitable content on social media platforms. It provides information such as video, stories, text posts, URL, photos, Twitter, Instagram, Facebook, etc. Deliver and pitch your topic in the best possible manner with this Strategies To Enhance Social Media Posting Relevant Content For Social Media Platforms Designs PDF. Use them to share invaluable insights on Video, Stories, Text Posts, URL, Photos and impress your audience. This template can be altered and modified as per your expectations. So, grab it now.
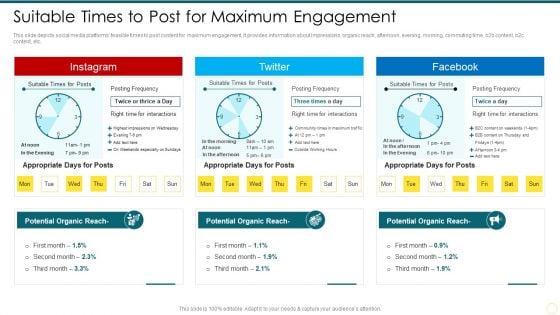
Strategies To Enhance Social Media Suitable Times To Post For Maximum Engagement Guidelines PDF
This slide depicts social media platforms feasible times to post content for maximum engagement. It provides information about impressions, organic reach, afternoon, evening, morning, commuting time, b2b content, b2c content, etc. Deliver and pitch your topic in the best possible manner with this Strategies To Enhance Social Media Suitable Times To Post For Maximum Engagement Guidelines PDF. Use them to share invaluable insights on Instagram, Twitter, Facebook and impress your audience. This template can be altered and modified as per your expectations. So, grab it now.
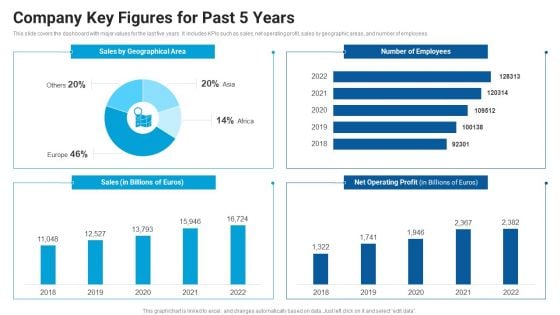
Company Key Figures For Past 5 Years Market Entry Approach For Apparel Sector Clipart PDF
This slide covers the dashboard with major values for the last five years. It includes KPIs such as sales, net operating profit, sales by geographic areas, and number of employees. Deliver an awe inspiring pitch with this creative Company Key Figures For Past 5 Years Market Entry Approach For Apparel Sector Clipart PDF bundle. Topics like Sales Geographical, Number Employees, Operating Profit can be discussed with this completely editable template. It is available for immediate download depending on the needs and requirements of the user.
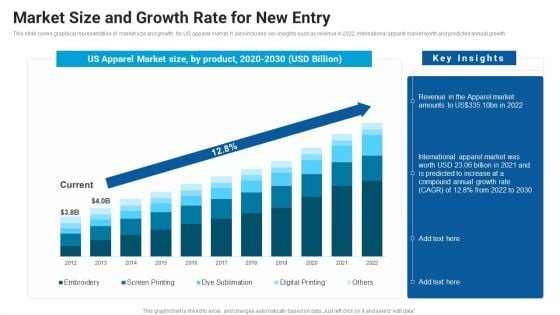
Market Size And Growth Rate For New Entry Market Entry Approach For Apparel Sector Themes PDF
This slide covers graphical representation of market size and growth for US apparel market. It also includes key insights such as revenue in 2022, international apparel market worth and predicted annual growth. Deliver an awe inspiring pitch with this creative Market Size And Growth Rate For New Entry Market Entry Approach For Apparel Sector Themes PDF bundle. Topics like Apparel Market, International Apparel, Compound Annual can be discussed with this completely editable template. It is available for immediate download depending on the needs and requirements of the user.
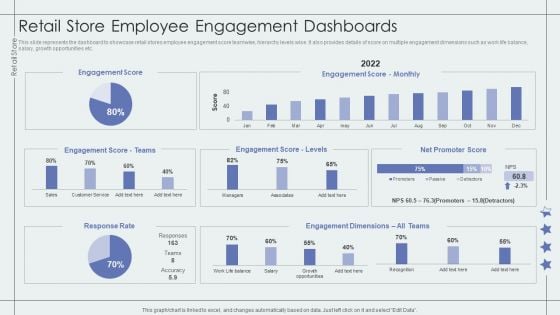
Retail Store Employee Engagement Dashboards Retail Outlet Performance Assessment Summary PDF
This slide represents the dashboard to showcase retail stores employee engagement score teamwise, hierarchy levels wise. It also provides details of score on multiple engagement dimensions such as work life balance, salary, growth opportunities etc.Deliver an awe inspiring pitch with this creative Retail Store Employee Engagement Dashboards Retail Outlet Performance Assessment Summary PDF bundle. Topics like Engagement Score, Promoter Score, Engagement Dimensions can be discussed with this completely editable template. It is available for immediate download depending on the needs and requirements of the user.
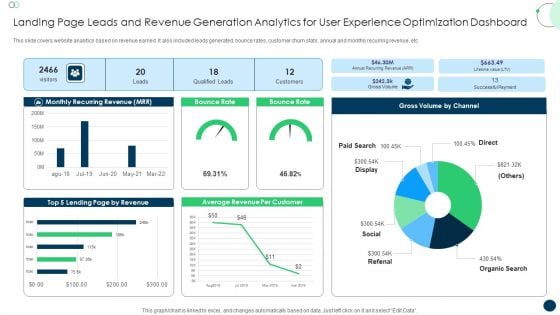
Landing Page Leads And Revenue Generation Analytics For User Experience Optimization Dashboard Formats PDF
This slide covers website analytics based on revenue earned. It also included leads generated, bounce rates, customer churn stats, annual and monthly recurring revenue, etc. Pitch your topic with ease and precision using this Landing Page Leads And Revenue Generation Analytics For User Experience Optimization Dashboard Formats PDF. This layout presents information on Monthly Recurring Revenue, Bounce Rate, Gross Volume. It is also available for immediate download and adjustment. So, changes can be made in the color, design, graphics or any other component to create a unique layout.
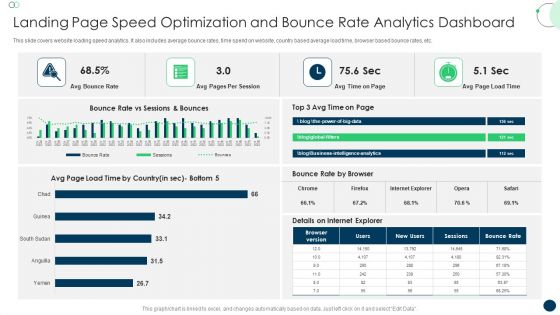
Landing Page Speed Optimization And Bounce Rate Analytics Dashboard Topics PDF
This slide covers website loading speed analytics. It also includes average bounce rates, time spend on website, country based average load time, browser based bounce rates, etc. Pitch your topic with ease and precision using this Landing Page Speed Optimization And Bounce Rate Analytics Dashboard Topics PDF. This layout presents information on Avg Bounce Rate, Avg Pages, Per Session. It is also available for immediate download and adjustment. So, changes can be made in the color, design, graphics or any other component to create a unique layout.
Youtube Video Marketing Analytics Dashboard Ppt Icon Portrait PDF
This slide covers dashboard illustrating performance of ad campaigns on YouTube. It includes elements such as total gained subscribers, likes, dislikes, daily active users, views, campaign performance, traffic sources by views, etc. Pitch your topic with ease and precision using this Youtube Video Marketing Analytics Dashboard Ppt Icon Portrait PDF. This layout presents information on Average Vies, Per Week, Campaigns, Traffic Sources. It is also available for immediate download and adjustment. So, changes can be made in the color, design, graphics or any other component to create a unique layout.
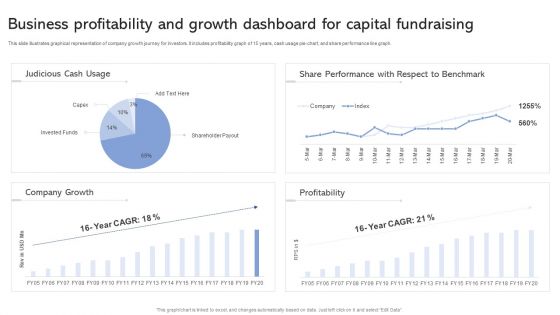
Business Profitability And Growth Dashboard For Capital Fundraising Ppt Slides Guide PDF
This slide illustrates graphical representation of company growth journey for investors. It includes profitability graph of 15 years, cash usage pie-chart, and share performance line graph. Showcasing this set of slides titled Business Profitability And Growth Dashboard For Capital Fundraising Ppt Slides Guide PDF. The topics addressed in these templates are Judicious Cash Usage, Share Performance, Respect To Benchmark. All the content presented in this PPT design is completely editable. Download it and make adjustments in color, background, font etc. as per your unique business setting.
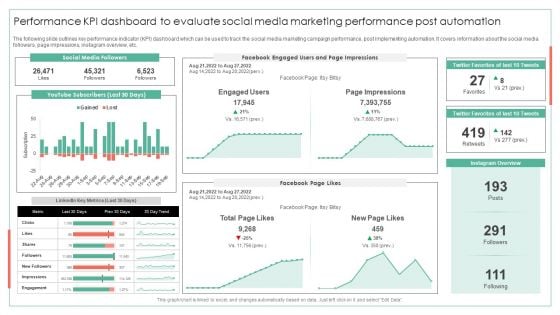
Performance KPI Dashboard To Evaluate Social Media Marketing Performance Post Automation Ideas PDF
The following slide outlines key performance indicator KPI dashboard which can be used to track the social media marketing campaign performance, post implementing automation. It covers information about the social media followers, page impressions, instagram overview, etc.Deliver an awe inspiring pitch with this creative Performance KPI Dashboard To Evaluate Social Media Marketing Performance Post Automation Ideas PDF bundle. Topics like Page Impressions, Twitter Favorites, Instagram Overview can be discussed with this completely editable template. It is available for immediate download depending on the needs and requirements of the user.
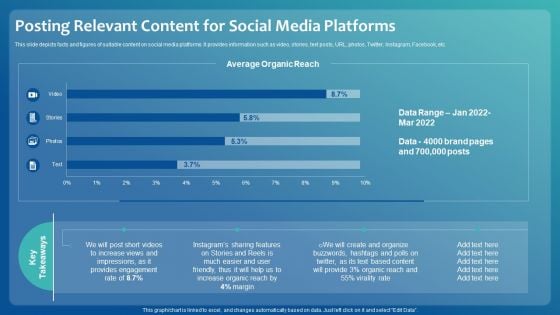
Improving Digital Community Engagement Strategy Posting Relevant Content For Social Media Platforms Pictures PDF
This slide depicts facts and figures of suitable content on social media platforms. It provides information such as video, stories, text posts, URL, photos, Twitter, Instagram, Facebook, etc. Deliver and pitch your topic in the best possible manner with this Improving Digital Community Engagement Strategy Posting Relevant Content For Social Media Platforms Pictures PDF. Use them to share invaluable insights on Increase Organic, Social Media Platforms, Posting Relevant Content and impress your audience. This template can be altered and modified as per your expectations. So, grab it now.
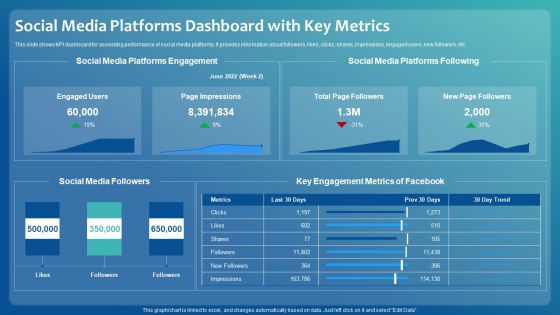
Improving Digital Community Engagement Strategy Social Media Platforms Dashboard With Key Metrics Professional PDF
This slide shows KPI dashboard for assessing performance of social media platforms. It provides information about followers, likes, clicks, shares, impressions, engaged users, new followers, etc. Deliver and pitch your topic in the best possible manner with this Improving Digital Community Engagement Strategy Social Media Platforms Dashboard With Key Metrics Professional PDF. Use them to share invaluable insights on Social Media Platforms Engagement, Key Engagement Metrics and impress your audience. This template can be altered and modified as per your expectations. So, grab it now.

Positive Impact Post Successful Implementation Of Social Media Engagement Strategy Microsoft PDF
This slide shows major impact post implementing social media strategy for improved engagement. It provides information about organic reach, lead generation, average share per post, new page likes and followers, etc. Deliver and pitch your topic in the best possible manner with this Positive Impact Post Successful Implementation Of Social Media Engagement Strategy Microsoft PDF. Use them to share invaluable insights on Successful Implementation, Social Media Engagement Strategy and impress your audience. This template can be altered and modified as per your expectations. So, grab it now.
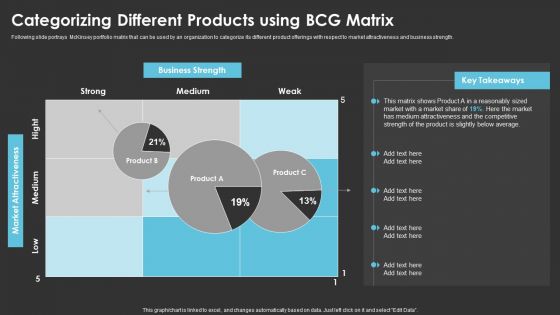
Method To Introduce New Product Offerings In The Industry Categorizing Different Products Using BCG Matrix Structure PDF
Following slide portrays McKinsey portfolio matrix that can be used by an organization to categorize its different product offerings with respect to market attractiveness and business strength. Deliver and pitch your topic in the best possible manner with this Method To Introduce New Product Offerings In The Industry Categorizing Different Products Using BCG Matrix Structure PDF. Use them to share invaluable insights on Categorizing Different Products, Matrix and impress your audience. This template can be altered and modified as per your expectations. So, grab it now.
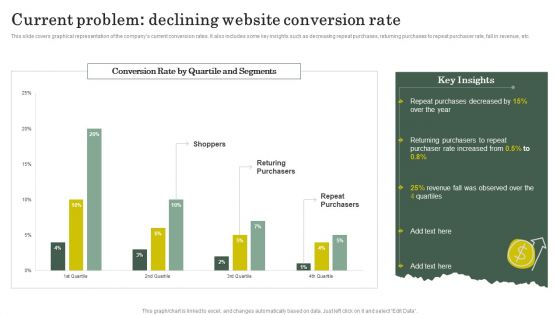
Strategies To Attract Customers And Lead Generation Current Problem Declining Website Conversion Rate Themes PDF
This slide covers graphical representation of the companys current conversion rates. It also includes some key insights such as decreasing repeat purchases, returning purchases to repeat purchaser rate, fall in revenue, etc. Deliver and pitch your topic in the best possible manner with this Strategies To Attract Customers And Lead Generation Current Problem Declining Website Conversion Rate Themes PDF. Use them to share invaluable insights on Revenue, Purchaser Rate and impress your audience. This template can be altered and modified as per your expectations. So, grab it now.
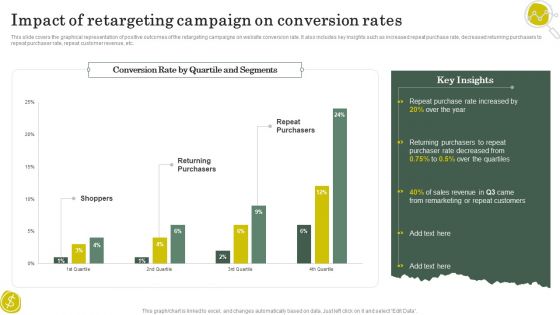
Strategies To Attract Customers And Lead Generation Impact Of Retargeting Campaign On Conversion Rates Pictures PDF
This slide covers the graphical representation of positive outcomes of the retargeting campaigns on website conversion rate. It also includes key insights such as increased repeat purchase rate, decreased returning purchasers to repeat purchaser rate, repeat customer revenue, etc. Deliver and pitch your topic in the best possible manner with this Strategies To Attract Customers And Lead Generation Impact Of Retargeting Campaign On Conversion Rates Pictures PDF. Use them to share invaluable insights on Purchase Rate, Remarketing, Sales Revenue and impress your audience. This template can be altered and modified as per your expectations. So, grab it now.
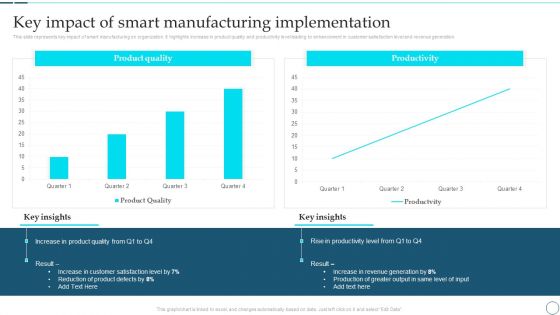
Deployment Of Smart Factory Solutions Key Impact Of Smart Manufacturing Implementation Download PDF
This slide represents key impact of smart manufacturing on organization. It highlights increase in product quality and productivity level leading to enhancement in customer satisfaction level and revenue generation. Deliver and pitch your topic in the best possible manner with this Deployment Of Smart Factory Solutions Key Impact Of Smart Manufacturing Implementation Download PDF. Use them to share invaluable insights on Product Quality, Customer Satisfaction, Product Defects, Revenue and impress your audience. This template can be altered and modified as per your expectations. So, grab it now.
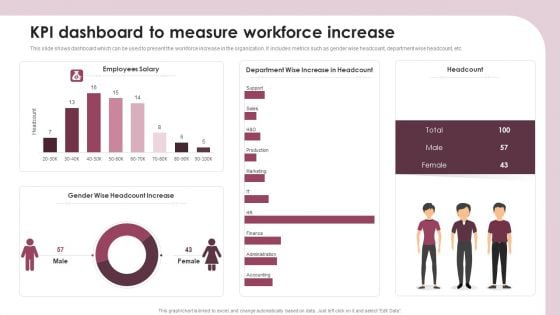
KPI Dashboard To Measure Workforce Increase Ppt Slides Elements PDF
This slide shows dashboard which can be used to present the workforce increase in the organization. It includes metrics such as gender wise headcount, department wise headcount, etc. Showcasing this set of slides titled KPI Dashboard To Measure Workforce Increase Ppt Slides Elements PDF. The topics addressed in these templates are Employees Salary, Headcount, Gender Wise, Headcount Increase. All the content presented in this PPT design is completely editable. Download it and make adjustments in color, background, font etc. as per your unique business setting.
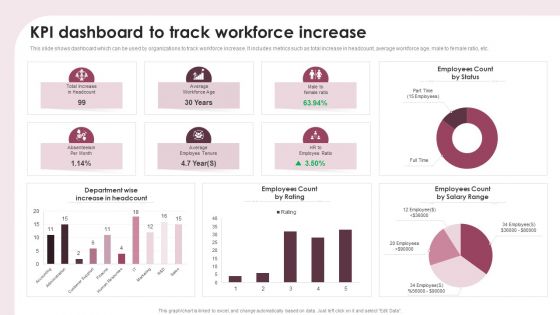
KPI Dashboard To Track Workforce Increase Ppt Show Portfolio PDF
This slide shows dashboard which can be used by organizations to track workforce increase. It includes metrics such as total increase in headcount, average workforce age, male to female ratio, etc. Pitch your topic with ease and precision using this KPI Dashboard To Track Workforce Increase Ppt Show Portfolio PDF. This layout presents information on Department Wise, Increase Headcount, Employees Count Rating. It is also available for immediate download and adjustment. So, changes can be made in the color, design, graphics or any other component to create a unique layout.
Altcoins Portfolio Tracking Metrics Dashboard Ppt Inspiration Background Images PDF
This slide covers dashboard for tracking different cryptocurrencies value and growth. It includes metrics such as incomes and expenses, market values, cryptocurrency transactions history, overall growth percentages, exchange rates, etc. Showcasing this set of slides titled Altcoins Portfolio Tracking Metrics Dashboard Ppt Inspiration Background Images PDF. The topics addressed in these templates are Balance, 3 Currencies, Transactions. All the content presented in this PPT design is completely editable. Download it and make adjustments in color, background, font etc. as per your unique business setting.
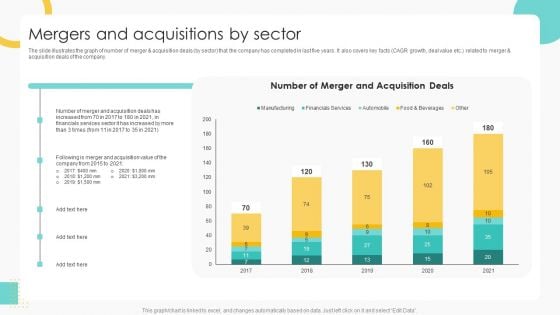
Buy Side Merger And Acquisition Pitch Book Mergers And Acquisitions By Sector Summary PDF
The slide illustrates the graph of number of merger and acquisition deals by sector that the company has completed in last five years. It also covers key facts CAGR growth, deal value etc. related to merger and acquisition deals of the company. Deliver an awe inspiring pitch with this creative Buy Side Merger And Acquisition Pitch Book Mergers And Acquisitions By Sector Summary PDF bundle. Topics like Financials Services, Acquisition Value can be discussed with this completely editable template. It is available for immediate download depending on the needs and requirements of the user.
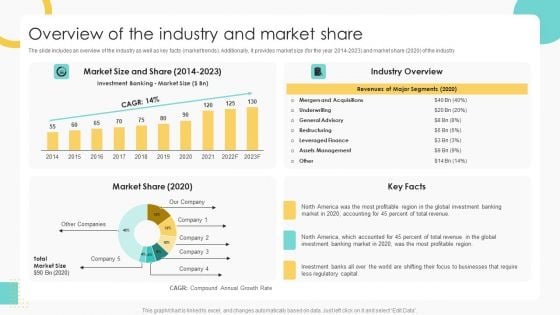
Buy Side Merger And Acquisition Pitch Book Overview Of The Industry And Market Share Graphics PDF
The slide includes an overview of the industry as well as key facts market trends. Additionally, it provides market size for the year 2014 to 2023 and market share 2020 of the industry. Deliver an awe inspiring pitch with this creative Buy Side Merger And Acquisition Pitch Book Overview Of The Industry And Market Share Graphics PDF bundle. Topics like Market Share, Industry Overview, Profitable can be discussed with this completely editable template. It is available for immediate download depending on the needs and requirements of the user.
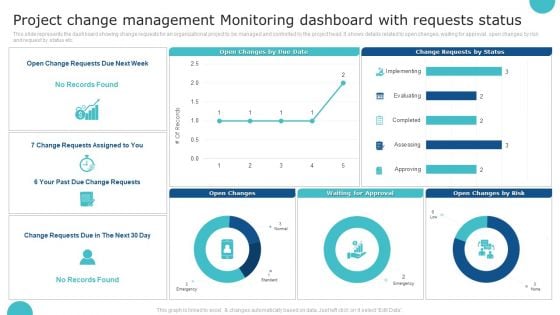
Project Change Management Monitoring Dashboard With Requests Status Structure PDF
This slide represents the dashboard showing change requests for an organizational project to be managed and controlled by the project head. It shows details related to open changes, waiting for approval, open changes by risk and request by status etc. Showcasing this set of slides titled Project Change Management Monitoring Dashboard With Requests Status Structure PDF. The topics addressed in these templates are Project Change Management, Monitoring Dashboard. All the content presented in this PPT design is completely editable. Download it and make adjustments in color, background, font etc. as per your unique business setting.
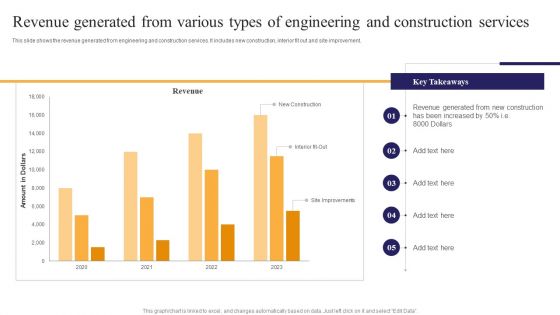
Revenue Generated From Various Types Of Engineering And Construction Services Ppt PowerPoint Presentation File Guide PDF
This slide shows the revenue generated from engineering and construction services. It includes new construction, interior fit out and site improvement. Pitch your topic with ease and precision using this Revenue Generated From Various Types Of Engineering And Construction Services Ppt PowerPoint Presentation File Guide PDF. This layout presents information on Revenue Generated, New Construction, Been Increased. It is also available for immediate download and adjustment. So, changes can be made in the color, design, graphics or any other component to create a unique layout.
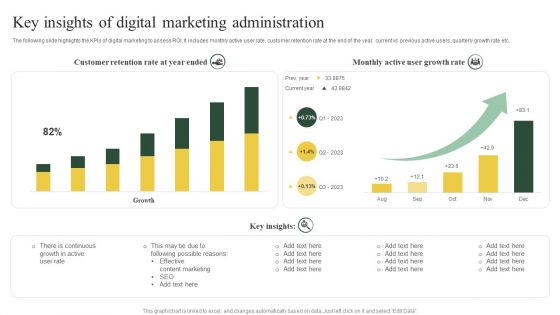
Key Insights Of Digital Marketing Administration Ppt PowerPoint Presentation Styles Graphics Template PDF
The following slide highlights the KPIs of digital marketing to assess ROI. It includes monthly active user rate, customer retention rate at the end of the year, current vs previous active users, quarterly growth rate etc.Pitch your topic with ease and precision using this Key Insights Of Digital Marketing Administration Ppt PowerPoint Presentation Styles Graphics Template PDF. This layout presents information on Possible Reasons, Content Marketing, Growth Rate. It is also available for immediate download and adjustment. So, changes can be made in the color, design, graphics or any other component to create a unique layout.
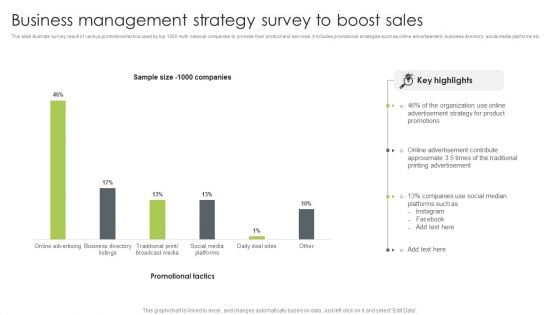
Business Management Strategy Survey To Boost Sales Summary PDF
This slide illustrate survey result of various promotional tactics used by top 1000 multi national companies to promote their product and services. it includes promotional strategies such as online advertisement, business directory, social media platforms etc. Pitch your topic with ease and precision using this Business Management Strategy Survey To Boost Sales Summary PDF. This layout presents information on Advertisement Strategy, Organization, Social Median. It is also available for immediate download and adjustment. So, changes can be made in the color, design, graphics or any other component to create a unique layout.
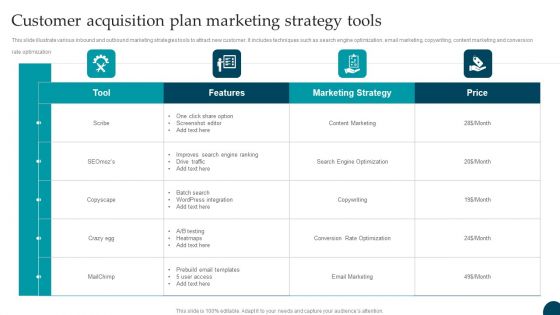
Customer Acquisition Plan Marketing Strategy Tools Information PDF
This slide illustrate success rate of various platform used for attracting and acquiring customer. It includes marketing tools such as website, email marketing, word of mouth communication, print advertisement, social media platforms etc. Showcasing this set of slides titled Customer Acquisition Plan Marketing Strategy Tools Information PDF. The topics addressed in these templates are Strategies, Customers, Marketing. All the content presented in this PPT design is completely editable. Download it and make adjustments in color, background, font etc. as per your unique business setting.
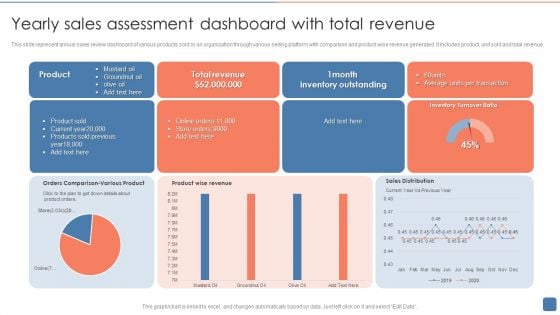
Yearly Sales Assessment Dashboard With Total Revenue Introduction PDF
This slide represent annual sales review dashboard of various products sold by an organization through various selling platform with comparison and product wise revenue generated .It includes product, unit sold and total revenue. Showcasing this set of slides titled Yearly Sales Assessment Dashboard With Total Revenue Introduction PDF. The topics addressed in these templates are Product Sold, Inventory Outstanding, Average. All the content presented in this PPT design is completely editable. Download it and make adjustments in color, background, font etc. as per your unique business setting.
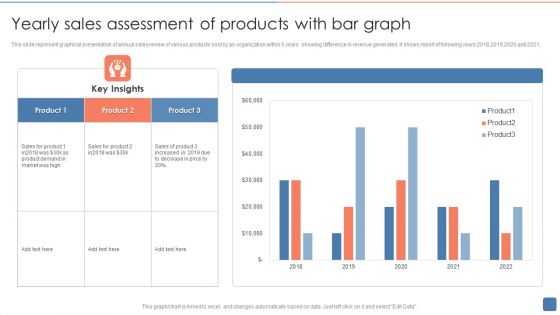
Yearly Sales Assessment Of Products With Bar Graph Structure PDF
This slide represent graphical presentation of annual sales review of various products sold by an organization within 5 years showing difference in revenue generated .It shows report of following years 2018,2019,2020,and 2021. Showcasing this set of slides titled Yearly Sales Assessment Of Products With Bar Graph Structure PDF. The topics addressed in these templates are Product, Sales Of Product, Product Demand. All the content presented in this PPT design is completely editable. Download it and make adjustments in color, background, font etc. as per your unique business setting.
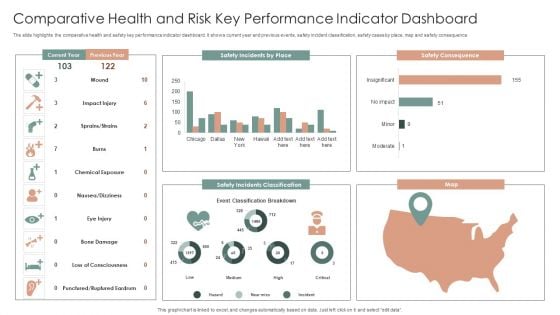
Comparative Health And Risk Key Performance Indicator Dashboard Ppt Portfolio Slide PDF
The slide highlights the comparative health and safety key performance indicator dashboard. It shows current year and previous events, safety incident classification, safety cases by place, map and safety consequence. Showcasing this set of slides titled Comparative Health And Risk Key Performance Indicator Dashboard Ppt Portfolio Slide PDF. The topics addressed in these templates are Safety Consequence, Safety Incidents Classification, Map. All the content presented in this PPT design is completely editable. Download it and make adjustments in color, background, font etc. as per your unique business setting.
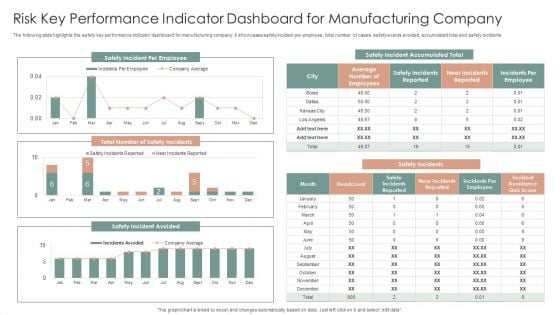
Risk Key Performance Indicator Dashboard For Manufacturing Company Ppt Gallery Graphics Design PDF
The following slide highlights the safety key performance indicator dashboard for manufacturing company. It showcases safety incident per employee, total number of cases, safety events avoided, accumulated total and safety incidents. Pitch your topic with ease and precision using this Risk Key Performance Indicator Dashboard For Manufacturing Company Ppt Gallery Graphics Design PDF. This layout presents information on Safety Incidents, Safety Incident Avoided, Safety Incident Accumulated. It is also available for immediate download and adjustment. So, changes can be made in the color, design, graphics or any other component to create a unique layout.
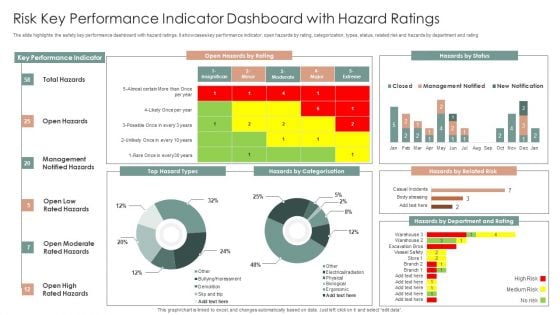
Risk Key Performance Indicator Dashboard With Hazard Ratings Ppt Layouts Slideshow PDF
The slide highlights the safety key performance dashboard with hazard ratings. It showcases key performance indicator, open hazards by rating, categorization, types, status, related risk and hazards by department and rating. Showcasing this set of slides titled Risk Key Performance Indicator Dashboard With Hazard Ratings Ppt Layouts Slideshow PDF. The topics addressed in these templates are Key Performance Indicator, Open Hazards, Hazards By Status. All the content presented in this PPT design is completely editable. Download it and make adjustments in color, background, font etc. as per your unique business setting.
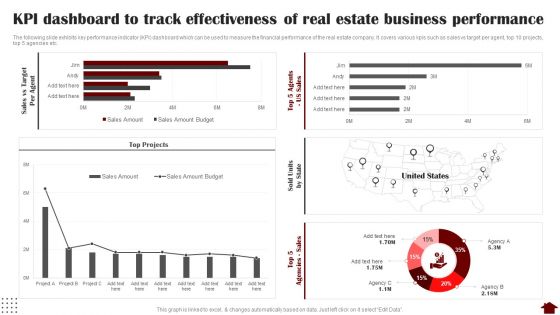
KPI Dashboard To Track Effectiveness Of Real Estate Business Performance Slides PDF
The following slide exhibits key performance indicator KPI dashboard which can be used to measure the financial performance of the real estate company. It covers various kpis such as sales vs target per agent, top 10 projects, top 5 agencies etc. Deliver an awe inspiring pitch with this creative KPI Dashboard To Track Effectiveness Of Real Estate Business Performance Slides PDF bundle. Topics like KPI Dashboard, Track Effectiveness, Real Estate Business Performance can be discussed with this completely editable template. It is available for immediate download depending on the needs and requirements of the user.
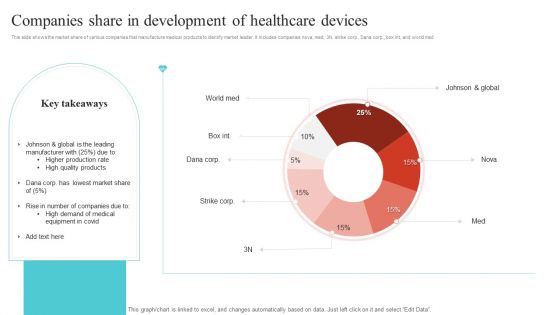
Companies Share In Development Of Healthcare Devices Ppt Summary Infographics PDF
This slide shows the market share of various companies that manufacture medical products to identify market leader. It includes companies nova, med, 3N, strike corp., Dana corp., box int, and world med. Showcasing this set of slides titled Companies Share In Development Of Healthcare Devices Ppt Summary Infographics PDF. The topics addressed in these templates are Johnson And Global, High Quality Products, Higher Production Rate. All the content presented in this PPT design is completely editable. Download it and make adjustments in color, background, font etc. as per your unique business setting.
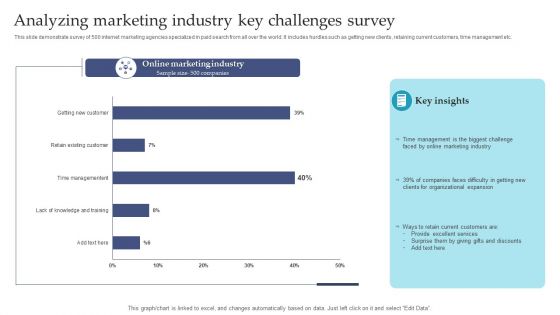
Analyzing Marketing Industry Key Challenges Survey Ppt Inspiration Skills PDF
This slide demonstrate survey of 500 internet marketing agencies specialized in paid search from all over the world. It includes hurdles such as getting new clients, retaining current customers, time management etc. Showcasing this set of slides titled Analyzing Marketing Industry Key Challenges Survey Ppt Inspiration Skills PDF. The topics addressed in these templates are Online Marketing Industry, Time Management, Online Marketing Industry. All the content presented in this PPT design is completely editable. Download it and make adjustments in color, background, font etc. as per your unique business setting.
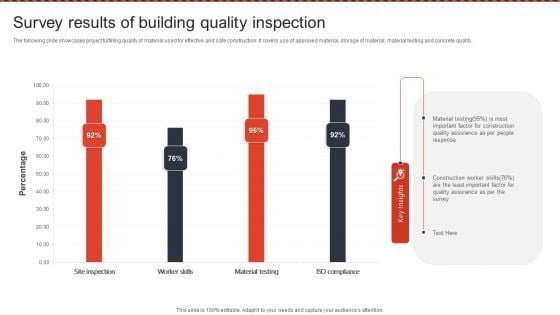
Survey Results Of Building Quality Inspection Ppt PowerPoint Presentation File Show PDF
The following slide showcases project fulfilling quality of material used for effective and safe construction. It covers use of approved material, storage of material, material testing and concrete quality. Pitch your topic with ease and precision using this Survey Results Of Building Quality Inspection Ppt PowerPoint Presentation File Show PDF. This layout presents information on Material Testing, Quality Assurance, Construction Worker Skills. It is also available for immediate download and adjustment. So, changes can be made in the color, design, graphics or any other component to create a unique layout.
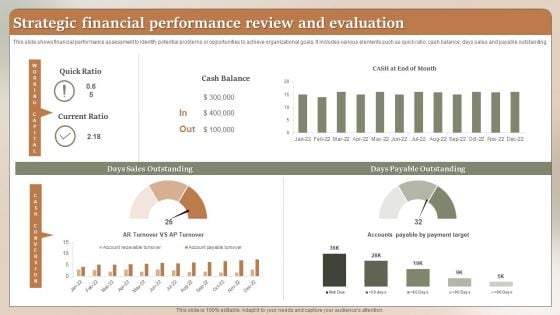
Strategic Financial Performance Review And Evaluation Ppt Layouts Styles PDF
This slide shows financial performance assessment to identify potential problems or opportunities to achieve organizational goals. It includes various elements such as quick ratio, cash balance, days sales and payable outstanding. Showcasing this set of slides titled Strategic Financial Performance Review And Evaluation Ppt Layouts Styles PDF. The topics addressed in these templates are Cash Balance, Quick Ratio, Current Ratio. All the content presented in this PPT design is completely editable. Download it and make adjustments in color, background, font etc. as per your unique business setting.
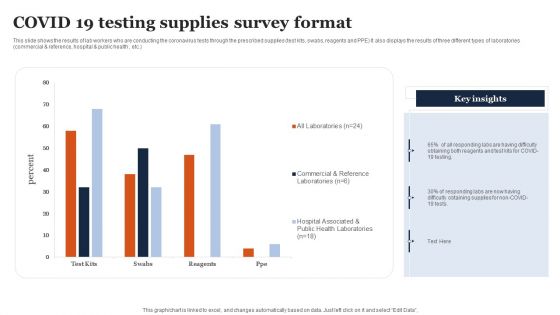
COVID 19 Testing Supplies Survey Format Ppt Infographic Template Slide PDF
This slide shows the results of lab workers who are conducting the coronavirus tests through the prescribed supplies test kits, swabs, reagents and PPE It also displays the results of three different types of laboratories commercial and reference, hospital and public health , etc. Showcasing this set of slides titled COVID 19 Testing Supplies Survey Format Ppt Infographic Template Slide PDF. The topics addressed in these templates are All Laboratories, Commercial And Reference, Hospital Associated. All the content presented in this PPT design is completely editable. Download it and make adjustments in color, background, font etc. as per your unique business setting.
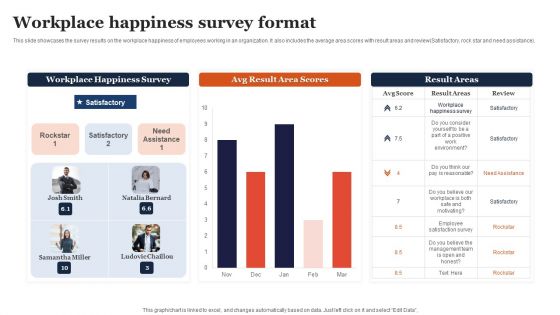
Workplace Happiness Survey Format Ppt Model Brochure PDF
This slide showcases the survey results on the workplace happiness of employees working in an organization. It also includes the average area scores with result areas and review Satisfactory, rock star and need. Pitch your topic with ease and precision using this Workplace Happiness Survey Format Ppt Model Brochure PDF. This layout presents information on Workplace Happiness Survey, Avg Result, Area Scores. It is also available for immediate download and adjustment. So, changes can be made in the color, design, graphics or any other component to create a unique layout.
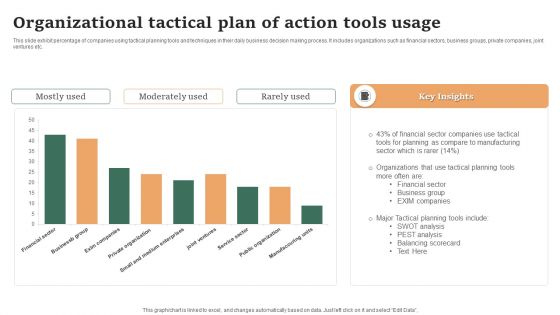
Organizational Tactical Plan Of Action Tools Usage Ppt Show Ideas PDF
This slide exhibit percentage of companies using tactical planning tools and techniques in their daily business decision making process. It includes organizations such as financial sectors, business groups, private companies, joint ventures etc. Showcasing this set of slides titled Organizational Tactical Plan Of Action Tools Usage Ppt Show Ideas PDF. The topics addressed in these templates are Mostly Used, Moderately Used, Rarely Used. All the content presented in this PPT design is completely editable. Download it and make adjustments in color, background, font etc. as per your unique business setting.
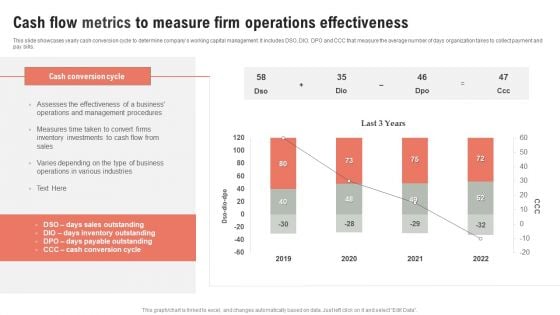
Cash Flow Metrics To Measure Firm Operations Effectiveness Ppt Outline Infographic Template PDF
This slide showcases yearly cash conversion cycle to determine companys working capital management. It includes DSO, DIO, DPO and CCC that measure the average number of days organization takes to collect payment and pay bills. Pitch your topic with ease and precision using this Cash Flow Metrics To Measure Firm Operations Effectiveness Ppt Outline Infographic Template PDF. This layout presents information on Cash Conversion Cycle, 2019 To 2022, Cash Flow. It is also available for immediate download and adjustment. So, changes can be made in the color, design, graphics or any other component to create a unique layout.
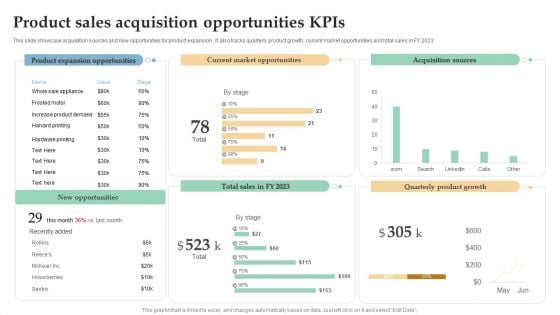
Product Sales Acquisition Opportunities Kpis Ppt Pictures Slide PDF
This slide showcase acquisition sources and new opportunities for product expansion . It also tracks quarterly product growth, current market opportunities and total sales in FY 2023. Pitch your topic with ease and precision using this Product Sales Acquisition Opportunities Kpis Ppt Pictures Slide PDF. This layout presents information on Product Expansion Opportunities, Current Market Opportunities, Acquisition Sources. It is also available for immediate download and adjustment. So, changes can be made in the color, design, graphics or any other component to create a unique layout.
Product Sales Kpis With Website Traffic Ppt Icon Smartart
This slide showcase different strategies through which product is marketize to increase the product reach to the consumer and increase the market share. It includes total product revenue, sales comparison of online and in store sales, marketing campaigning and website traffic. Showcasing this set of slides titled Product Sales Kpis With Website Traffic Ppt Icon Smartart. The topics addressed in these templates are Website Traffic, Product Sales Increment, Total Product Revenue. All the content presented in this PPT design is completely editable. Download it and make adjustments in color, background, font etc. as per your unique business setting.
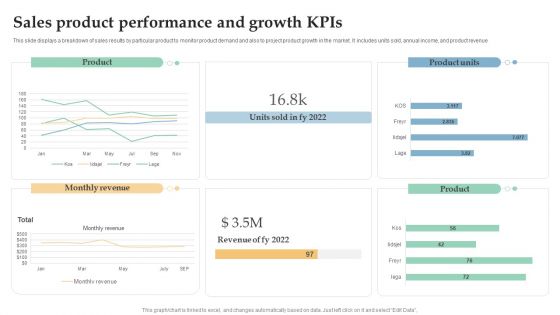
Sales Product Performance And Growth Kpis Ppt Layouts Mockup PDF
This slide displays a breakdown of sales results by particular product to monitor product demand and also to project product growth in the market. It includes units sold, annual income, and product revenue. Pitch your topic with ease and precision using this Sales Product Performance And Growth Kpis Ppt Layouts Mockup PDF. This layout presents information on Monthly Revenue, Product, Product Units. It is also available for immediate download and adjustment. So, changes can be made in the color, design, graphics or any other component to create a unique layout.
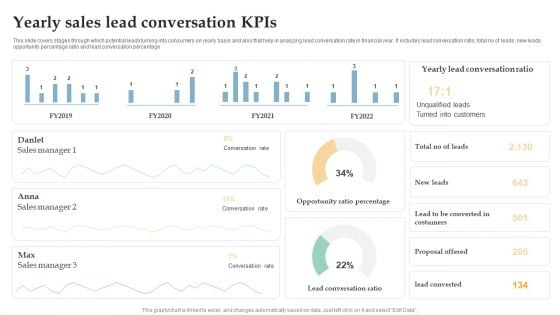
Yearly Sales Lead Conversation Kpis Ppt Inspiration Brochure PDF
This slide covers stages through which potential leads turning into consumers on yearly basis and also that help in analyzing lead conversation rate in financial year. It includes lead conversation ratio, total no of leads, new leads opportunity percentage ratio and lead conversation percentage. Pitch your topic with ease and precision using this Yearly Sales Lead Conversation Kpis Ppt Inspiration Brochure PDF. This layout presents information on Sales Manager, Conversation Rate, Opportunity Ratio Percentage. It is also available for immediate download and adjustment. So, changes can be made in the color, design, graphics or any other component to create a unique layout.
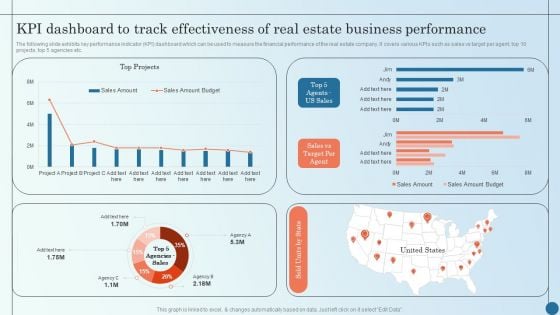
KPI Dashboard To Track Effectiveness Of Real Estate Business Managing Commercial Property Risks Demonstration PDF
The following slide exhibits key performance indicator KPI dashboard which can be used to measure the financial performance of the real estate company. It covers various KPIs such as sales vs target per agent, top 10 projects, top 5 agencies etc.Deliver an awe inspiring pitch with this creative KPI Dashboard To Track Effectiveness Of Real Estate Business Managing Commercial Property Risks Demonstration PDF bundle. Topics like Kpi Dashboard, Track Effectiveness, Estate Business can be discussed with this completely editable template. It is available for immediate download depending on the needs and requirements of the user.
Consumer Journey Mapping Techniques Dashboard For Tracking Customer Service Team Performance Summary PDF
This slide covers the KPI dashboard for analyzing the performance of client support department. It includes metrics such as first call resolution, unresolved calls, average response rate, the best day to call, average time to solve issues, etc. Pitch your topic with ease and precision using this Consumer Journey Mapping Techniques Dashboard For Tracking Customer Service Team Performance Summary PDF. This layout presents information on Dashboard For Tracking Customer, Service Team Performance. It is also available for immediate download and adjustment. So, changes can be made in the color, design, graphics or any other component to create a unique layout.
Consumer Journey Mapping Techniques Dashboard For Tracking Digital Content Performance Clipart PDF
This slide covers the KPI dashboard for analyzing online content. It includes metrics such as blog visitors, pageviews, newsletter conversion rate, new signups, new customers, etc. Showcasing this set of slides titled Consumer Journey Mapping Techniques Dashboard For Tracking Digital Content Performance Clipart PDF. The topics addressed in these templates are Purchase Amount, Customers, Tracking Digital Content Performance. All the content presented in this PPT design is completely editable. Download it and make adjustments in color, background, font etc. as per your unique business setting.
Consumer Journey Mapping Techniques Dashboard For Tracking Social Media Platforms Introduction PDF
This slide covers the KPI dashboard for analyzing social media channels. It includes metrics such as social media followers, Facebook daily reach, Facebook engaged users and page impressions, etc. Pitch your topic with ease and precision using this Consumer Journey Mapping Techniques Dashboard For Tracking Social Media Platforms Introduction PDF. This layout presents information on Linkedin Key Metrics, Social Media Followers, Awareness. It is also available for immediate download and adjustment. So, changes can be made in the color, design, graphics or any other component to create a unique layout.
Dashboard For Tracking Customer Service Team Performance Information PDF
This slide covers the KPI dashboard for analyzing the performance of client support department. It includes metrics such as first call resolution, unresolved calls, average response rate, the best day to call, average time to solve issues, etc. Deliver an awe inspiring pitch with this creative Dashboard For Tracking Customer Service Team Performance Information PDF bundle. Topics like Dashboard For Tracking Customer, Service Team Performance can be discussed with this completely editable template. It is available for immediate download depending on the needs and requirements of the user.
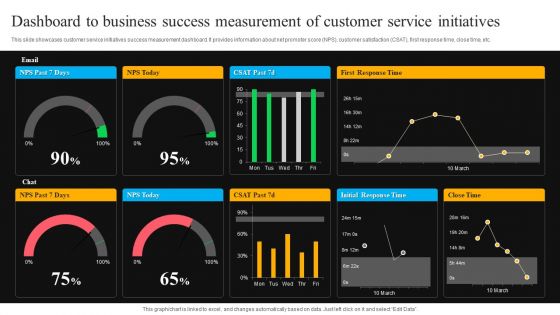
Dashboard To Business Success Measurement Of Customer Service Initiatives Microsoft PDF
This slide showcases customer service initiatives success measurement dashboard. It provides information about net promoter score NPS, customer satisfaction CSAT, first response time, close time, etc. Showcasing this set of slides titled Dashboard To Business Success Measurement Of Customer Service Initiatives Microsoft PDF. The topics addressed in these templates are Initial Response Time, Close Time, First Response Time. All the content presented in this PPT design is completely editable. Download it and make adjustments in color, background, font etc. as per your unique business setting.
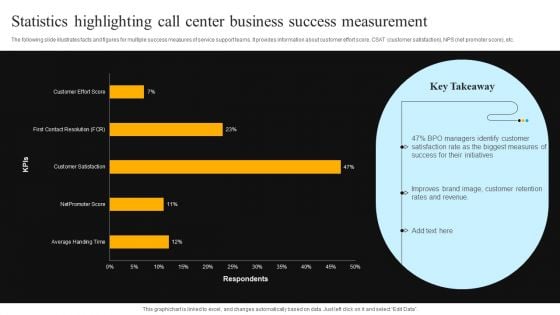
Statistics Highlighting Call Center Business Success Measurement Introduction PDF
The following slide illustrates facts and figures for multiple success measures of service support teams. It provides information about customer effort score, CSAT customer satisfaction, NPS net promoter score, etc. Showcasing this set of slides titled Statistics Highlighting Call Center Business Success Measurement Introduction PDF. The topics addressed in these templates are BPO Managers, Customer Satisfaction Rate, Biggest Measure. All the content presented in this PPT design is completely editable. Download it and make adjustments in color, background, font etc. as per your unique business setting.
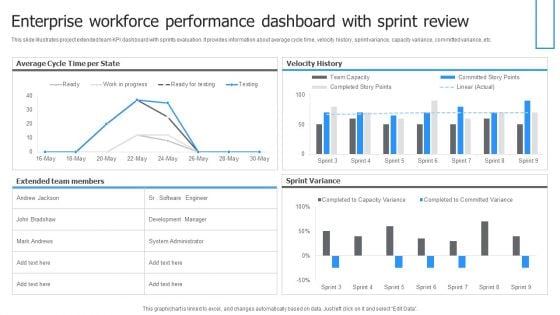
Enterprise Workforce Performance Dashboard With Sprint Review Themes PDF
This slide illustrates project extended team KPI dashboard with sprints evaluation. It provides information about average cycle time, velocity history, sprint variance, capacity variance, committed variance, etc. Showcasing this set of slides titled Enterprise Workforce Performance Dashboard With Sprint Review Themes PDF. The topics addressed in these templates are Velocity History, Sprint Variance, Average Cycle, Time Per State. All the content presented in this PPT design is completely editable. Download it and make adjustments in color, background, font etc. as per your unique business setting.
Customer Service Request Tickets Administration Dashboard Icons PDF
This slide covers division of tickets into different groups. It also includes a pie chart dividing tickets in multiple categories such as status, tech groups, alert level, request type and alert condition. Pitch your topic with ease and precision using this Customer Service Request Tickets Administration Dashboard Icons PDF. This layout presents information on Tickets Activity, Tickets Alert Level, Tickets Teach Group. It is also available for immediate download and adjustment. So, changes can be made in the color, design, graphics or any other component to create a unique layout.
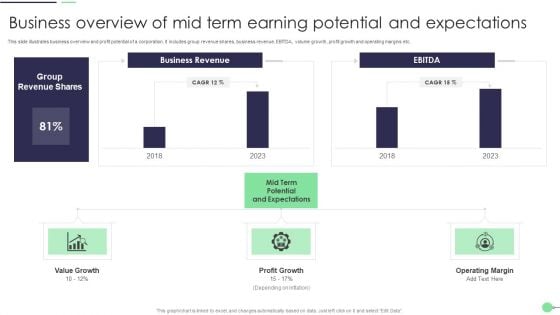
Business Overview Of Mid Term Earning Potential And Expectations Slides PDF
This slide illustrates business overview and profit potential of a corporation. It includes group revenue shares, business revenue, EBITDA, volume growth, profit growth and operating margins etc. Showcasing this set of slides titled Business Overview Of Mid Term Earning Potential And Expectations Slides PDF. The topics addressed in these templates are Value Growth, Profit Growth, Operating Margin. All the content presented in this PPT design is completely editable. Download it and make adjustments in color, background, font etc. as per your unique business setting.


 Continue with Email

 Home
Home


