Banking Technology
Dashboard For Tracking Sales Order Processing Rate Inspiration PDF
The following slide showcases sales order fulfilment rate dashboard to measure efficiency of shipping, process and packaging. It includes components such as partially fulfilled orders, pending orders, total number of orders etc. Showcasing this set of slides titled Dashboard For Tracking Sales Order Processing Rate Inspiration PDF. The topics addressed in these templates are Order Fulfilment, Partially Fulfilled, Pending. All the content presented in this PPT design is completely editable. Download it and make adjustments in color, background, font etc. as per your unique business setting.
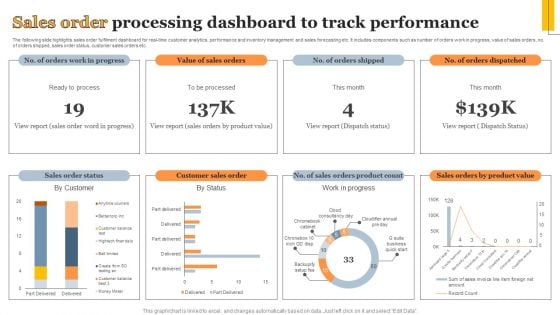
Sales Order Processing Dashboard To Track Performance Information PDF
The following slide highlights sales order fulfilment dashboard for real-time customer analytics, performance and inventory management and sales forecasting etc. It includes components such as number of orders work in progress, value of sales orders, no. of orders shipped, sales order status, customer sales orders etc. Showcasing this set of slides titled Sales Order Processing Dashboard To Track Performance Information PDF. The topics addressed in these templates are Sales Order Status, Customer Sales Order, Work Progress. All the content presented in this PPT design is completely editable. Download it and make adjustments in color, background, font etc. as per your unique business setting.
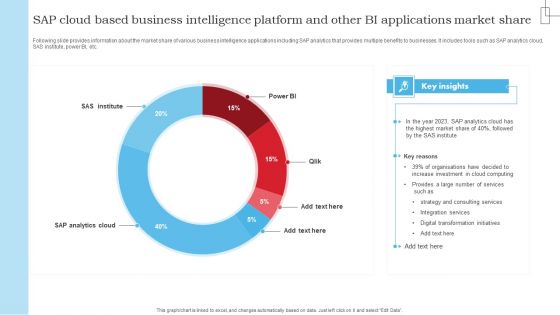
SAP Cloud Based Business Intelligence Platform And Other BI Applications Market Share Structure PDF
Following slide provides information about the market share of various business intelligence applications including SAP analytics that provides multiple benefits to businesses. It includes tools such as SAP analytics cloud, SAS institute, power BI, etc. Showcasing this set of slides titled SAP Cloud Based Business Intelligence Platform And Other BI Applications Market Share Structure PDF. The topics addressed in these templates are Strategy Consulting Services, Integration Services, Digital Transformation Initiatives. All the content presented in this PPT design is completely editable. Download it and make adjustments in color, background, font etc. as per your unique business setting.
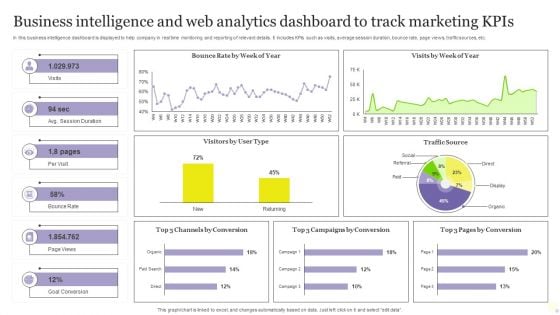
Business Intelligence And Web Analytics Dashboard To Track Marketing Kpis Inspiration PDF
In this business intelligence dashboard is displayed to help company in real time monitoring and reporting of relevant details. It includes KPIs such as visits, average session duration, bounce rate, page views, traffic sources, etc. Showcasing this set of slides titled Business Intelligence And Web Analytics Dashboard To Track Marketing Kpis Inspiration PDF. The topics addressed in these templates are Goal Conversion, Track Marketing Kpis, Web Analytics Dashboard. All the content presented in this PPT design is completely editable. Download it and make adjustments in color, background, font etc. as per your unique business setting.
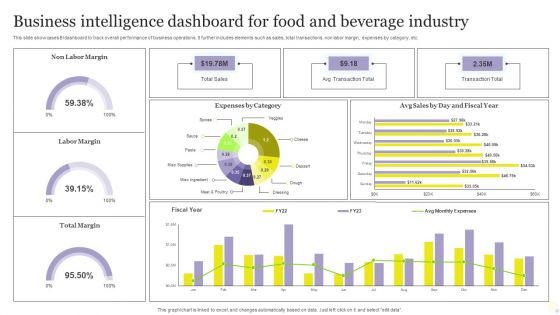
Business Intelligence Dashboard For Food And Beverage Industry Diagrams PDF
This slide showcases BI dashboard to track overall performance of business operations. It further includes elements such as sales, total transactions, non labor margin, expenses by category, etc. Pitch your topic with ease and precision using this Business Intelligence Dashboard For Food And Beverage Industry Diagrams PDF. This layout presents information on Expenses, Sales, Business Intelligence Dashboard. It is also available for immediate download and adjustment. So, changes can be made in the color, design, graphics or any other component to create a unique layout.
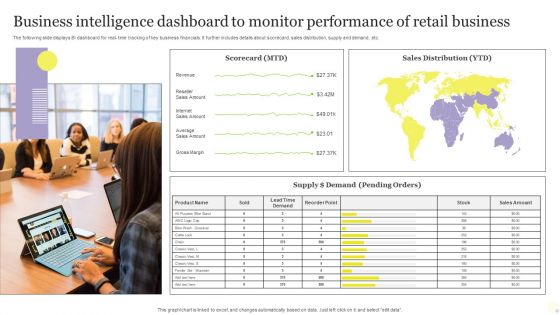
Business Intelligence Dashboard To Monitor Performance Of Retail Business Infographics PDF
The following slide displays BI dashboard for real time tracking of key business financials. It further includes details about scorecard, sales distribution, supply and demand, etc. Pitch your topic with ease and precision using this Business Intelligence Dashboard To Monitor Performance Of Retail Business Infographics PDF. This layout presents information on Business Intelligence Dashboard, Monitor Performance, Retail Business. It is also available for immediate download and adjustment. So, changes can be made in the color, design, graphics or any other component to create a unique layout.
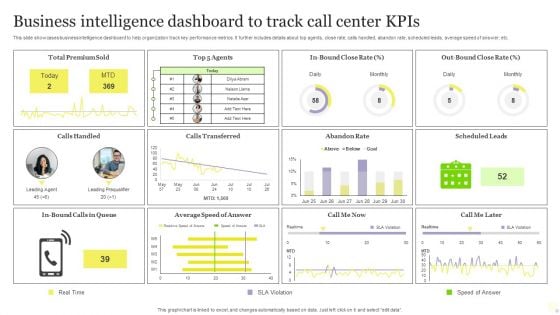
Business Intelligence Dashboard To Track Call Center Kpis Download PDF
This slide showcases business intelligence dashboard to help organization track key performance metrics. It further includes details about top agents, close rate, calls handled, abandon rate, scheduled leads, average speed of answer, etc. Pitch your topic with ease and precision using this Business Intelligence Dashboard To Track Call Center Kpis Download PDF. This layout presents information on Business Intelligence Dashboard, Track Call Center Kpis. It is also available for immediate download and adjustment. So, changes can be made in the color, design, graphics or any other component to create a unique layout.
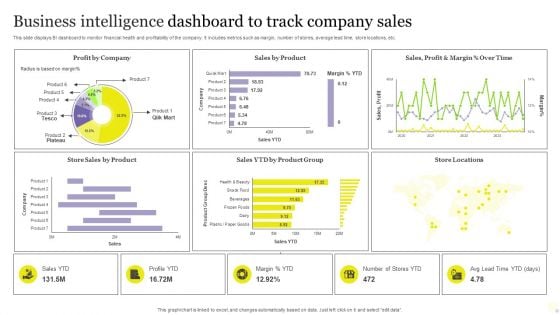
Business Intelligence Dashboard To Track Company Sales Rules PDF
This slide displays BI dashboard to monitor financial health and profitability of the company. It includes metrics such as margin, number of stores, average lead time, store locations, etc. Showcasing this set of slides titled Business Intelligence Dashboard To Track Company Sales Rules PDF. The topics addressed in these templates are Business Intelligence Dashboard, Track Company Sales. All the content presented in this PPT design is completely editable. Download it and make adjustments in color, background, font etc. as per your unique business setting.
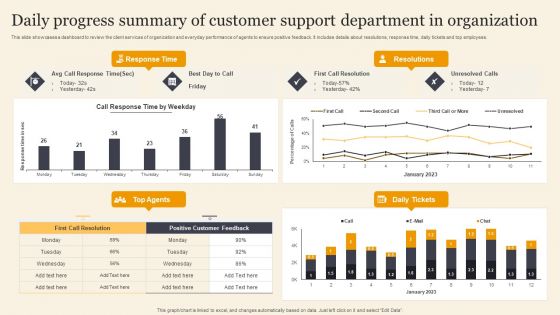
Daily Progress Summary Of Customer Support Department In Organization Portrait PDF
This slide showcases a dashboard to review the client services of organization and everyday performance of agents to ensure positive feedback. It includes details about resolutions, response time, daily tickets and top employees. Showcasing this set of slides titled Daily Progress Summary Of Customer Support Department In Organization Portrait PDF. The topics addressed in these templates are Daily Progress Summary, Customer Support, Department In Organization. All the content presented in this PPT design is completely editable. Download it and make adjustments in color, background, font etc. as per your unique business setting.
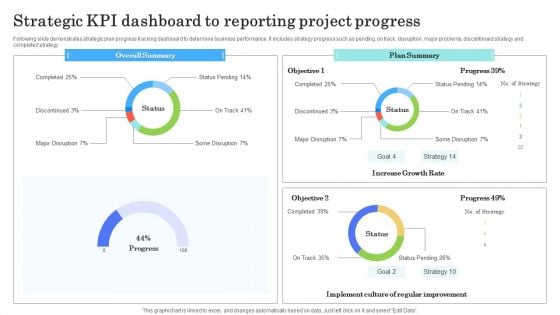
Strategic Kpi Dashboard To Reporting Project Progress Sample PDF
Following slide demonstrates strategic plan progress tracking dashboard to determine business performance. It includes strategy progress such as pending, on track, disruption, major problems, discontinued strategy and completed strategy Pitch your topic with ease and precision using this Strategic Kpi Dashboard To Reporting Project Progress Sample PDF. This layout presents information on Overall Summary, Plan Summary, Growth Rate. It is also available for immediate download and adjustment. So, changes can be made in the color, design, graphics or any other component to create a unique layout.
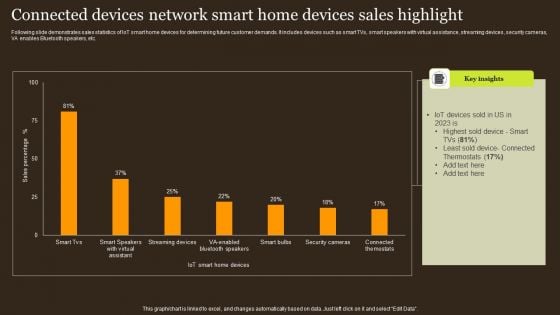
Connected Devices Network Smart Home Devices Sales Highlight Structure PDF
Following slide demonstrates sales statistics of IoT smart home devices for determining future customer demands. It includes devices such as smart TVs, smart speakers with virtual assistance, streaming devices, security cameras, VA enables Bluetooth speakers, etc. Showcasing this set of slides titled Connected Devices Network Smart Home Devices Sales Highlight Structure PDF. The topics addressed in these templates are Iot Devices, Least Sold Device, Thermostats. All the content presented in this PPT design is completely editable. Download it and make adjustments in color, background, font etc. as per your unique business setting.
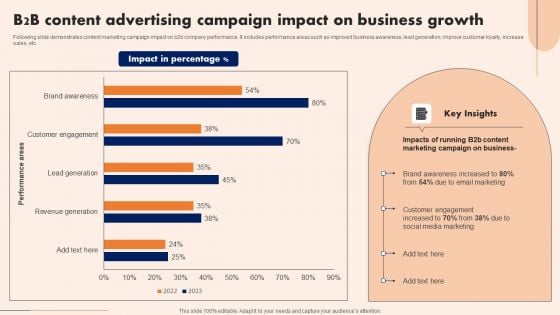
B2B Content Advertising Campaign Impact On Business Growth Sample PDF
Following slide demonstrates content marketing campaign impact on b2b company performance. It includes performance areas such as improved business awareness, lead generation, improve customer loyalty, increase sales, etc. Pitch your topic with ease and precision using this B2B Content Advertising Campaign Impact On Business Growth Sample PDF. This layout presents information on Key Insights, Growth, Marketing . It is also available for immediate download and adjustment. So, changes can be made in the color, design, graphics or any other component to create a unique layout.
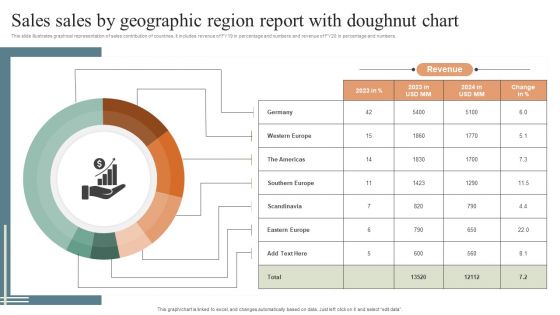
Sales Sales By Geographic Region Report With Doughnut Chart Themes PDF
This slide illustrates graphical representation of sales contribution of countries. It includes revenue of FY19 in percentage and numbers and revenue of FY20 in percentage and numbers. Showcasing this set of slides titled Sales Sales By Geographic Region Report With Doughnut Chart Themes PDF. The topics addressed in these templates are Revenue, Doughnut Chart, Geographic Region Report. All the content presented in this PPT design is completely editable. Download it and make adjustments in color, background, font etc. as per your unique business setting.
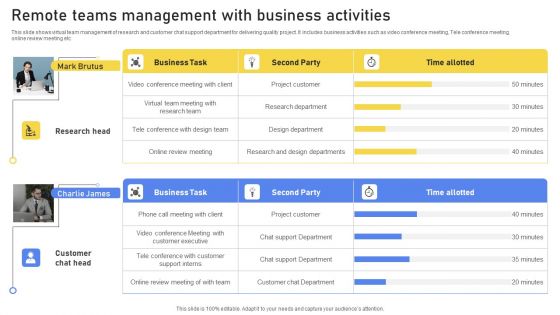
Remote Teams Management With Business Activities Graphics PDF
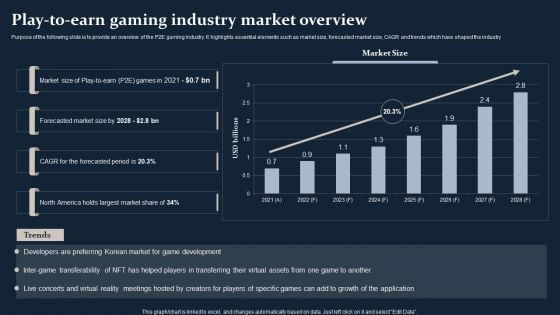
Smartphone Game Development And Advertising Technique Play To Earn Gaming Industry Market Overview Themes PDF
This Smartphone Game Development And Advertising Technique Play To Earn Gaming Industry Market Overview Themes PDF is perfect for any presentation, be it in front of clients or colleagues. It is a versatile and stylish solution for organizing your meetings. The Smartphone Game Development And Advertising Technique Play To Earn Gaming Industry Market Overview Themes PDF features a modern design for your presentation meetings. The adjustable and customizable slides provide unlimited possibilities for acing up your presentation. Slidegeeks has done all the homework before launching the product for you. So, do not wait, grab the presentation templates today
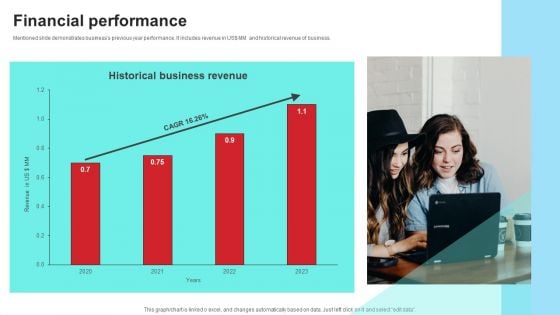
Community Engagement Platform Fundraising Pitch Deck Financial Performance Designs PDF
Mentioned slide demonstrates businesss previous year performance. It includes revenue in US MM and historical revenue of business. Are you looking for something that will make your presentation stand out from the rest Look no further than Community Engagement Platform Fundraising Pitch Deck Financial Performance Designs PDF. With our professional designs, you can trust that your presentation will pop and make delivering it a smooth process. And with Slidegeeks, you can trust that your presentation will be unique and memorable. So why wait Grab Community Engagement Platform Fundraising Pitch Deck Financial Performance Designs PDF today and make your presentation stand out from the rest.
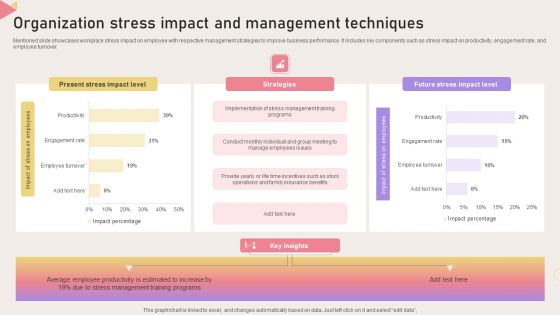
Organization Stress Impact And Management Techniques Sample PDF
Mentioned slide showcases workplace stress impact on employee with respective management strategies to improve business performance. It includes key components such as stress impact on productivity, engagement rate, and employee turnover. Pitch your topic with ease and precision using this Organization Stress Impact And Management Techniques Sample PDF. This layout presents information on Strategies, Impact Level, Technique. It is also available for immediate download and adjustment. So, changes can be made in the color, design, graphics or any other component to create a unique layout.
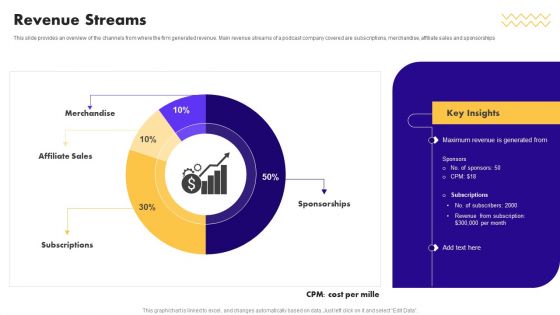
Audio Centric Firm Capital Raising Pitch Deck Revenue Streams Background PDF
This slide provides an overview of the channels from where the firm generated revenue. Main revenue streams of a podcast company covered are subscriptions, merchandise, affiliate sales and sponsorships. This Audio Centric Firm Capital Raising Pitch Deck Revenue Streams Background PDF is perfect for any presentation, be it in front of clients or colleagues. It is a versatile and stylish solution for organizing your meetings. The product features a modern design for your presentation meetings. The adjustable and customizable slides provide unlimited possibilities for acing up your presentation. Slidegeeks has done all the homework before launching the product for you. So, do not wait, grab the presentation templates today
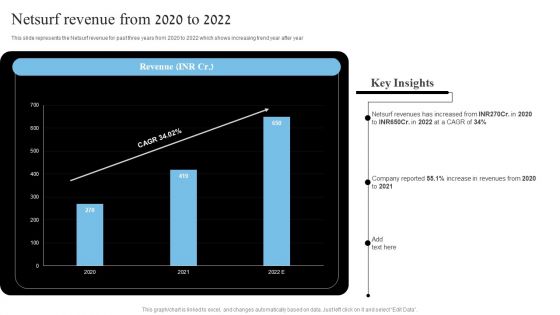
Network Marketing Company Profile Netsurf Revenue From 2020 To 2022 Elements PDF
This slide represents the Netsurf revenue for past three years from 2020 to 2022 which shows increasing trend year after year Get a simple yet stunning designed Network Marketing Company Profile Netsurf Revenue From 2020 To 2022 Elements PDF. It is the best one to establish the tone in your meetings. It is an excellent way to make your presentations highly effective. So, download this PPT today from Slidegeeks and see the positive impacts. Our easy to edit Network Marketing Company Profile Netsurf Revenue From 2020 To 2022 Elements PDF can be your go to option for all upcoming conferences and meetings. So, what are you waiting for Grab this template today.
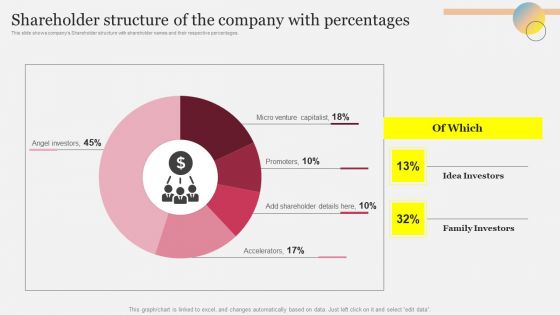
Shareholder Structure Of The Company With Percentages Ppt Pictures Slide Portrait PDF
This slide shows companys Shareholder structure with shareholder names and their respective percentages. This Shareholder Structure Of The Company With Percentages Ppt Pictures Slide Portrait PDF is perfect for any presentation, be it in front of clients or colleagues. It is a versatile and stylish solution for organizing your meetings. The product features a modern design for your presentation meetings. The adjustable and customizable slides provide unlimited possibilities for acing up your presentation. Slidegeeks has done all the homework before launching the product for you. So, do not wait, grab the presentation templates today
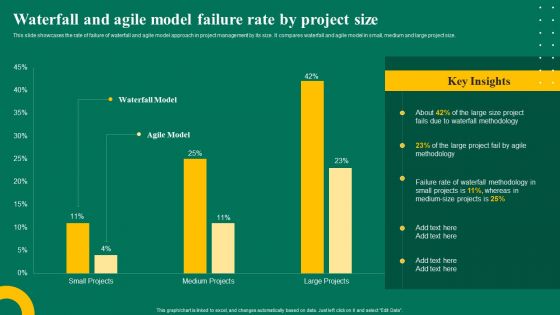
Waterfall And Agile Model Failure Rate By Project Size Ppt Pictures Gallery PDF
This slide showcases the rate of failure of waterfall and agile model approach in project management by its size. It compares waterfall and agile model in small, medium and large project size. Make sure to capture your audiences attention in your business displays with our gratis customizable Waterfall And Agile Model Failure Rate By Project Size Ppt Pictures Gallery PDF. These are great for business strategies, office conferences, capital raising or task suggestions. If you desire to acquire more customers for your tech business and ensure they stay satisfied, create your own sales presentation with these plain slides.
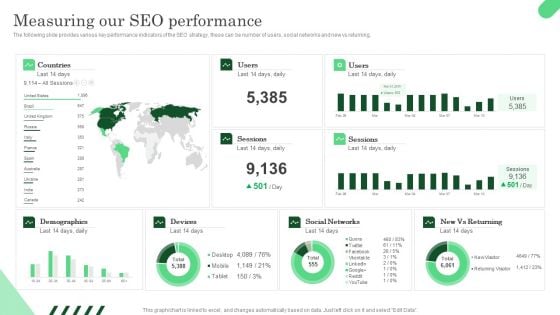
Measuring Our SEO Performance Ppt PowerPoint Presentation File Gallery PDF
The following slide provides various key performance indicators of the SEO strategy, these can be number of users, social networks and new vs returning. This Measuring Our SEO Performance Ppt PowerPoint Presentation File Gallery PDF is perfect for any presentation, be it in front of clients or colleagues. It is a versatile and stylish solution for organizing your meetings. The Measuring Our SEO Performance Ppt PowerPoint Presentation File Gallery PDF features a modern design for your presentation meetings. The adjustable and customizable slides provide unlimited possibilities for acing up your presentation. Slidegeeks has done all the homework before launching the product for you. So, do not wait, grab the presentation templates today
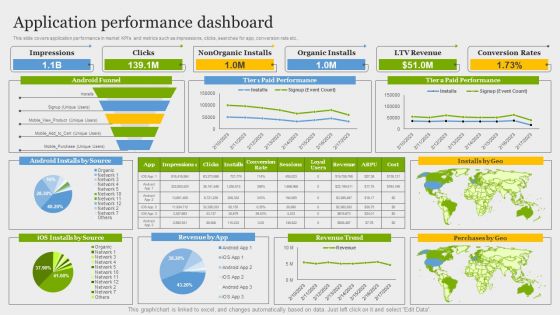
Online Application Development Application Performance Dashboard Information PDF
This slide covers application performance in market KPIs and metrics such as impressions, clicks, searches for app, conversion rate etc. Get a simple yet stunning designed Online Application Development Application Performance Dashboard Information PDF. It is the best one to establish the tone in your meetings. It is an excellent way to make your presentations highly effective. So, download this PPT today from Slidegeeks and see the positive impacts. Our easy to edit Online Application Development Application Performance Dashboard Information PDF can be your go to option for all upcoming conferences and meetings. So, what are you waiting for Grab this template today.
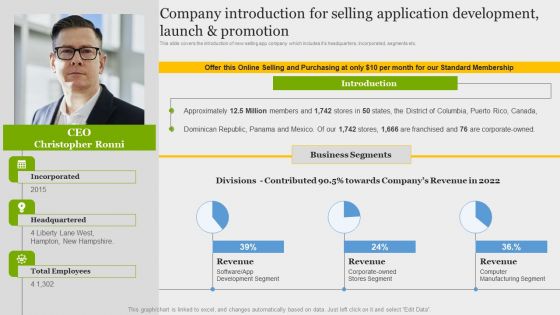
Online Application Development Company Introduction Selling Application Development Launch Professional PDF
This slide covers the introduction of new selling app company which includes its headquarters, Incorporated, segments etc. Do you have an important presentation coming up Are you looking for something that will make your presentation stand out from the rest Look no further than Online Application Development Company Introduction Selling Application Development Launch Professional PDF. With our professional designs, you can trust that your presentation will pop and make delivering it a smooth process. And with Slidegeeks, you can trust that your presentation will be unique and memorable. So why wait Grab Online Application Development Company Introduction Selling Application Development Launch Professional PDF today and make your presentation stand out from the rest.

Online Application Development Product Requirement Priority Graphical Representation Topics PDF
This slide covers the product features prioritization tool which depicts the low value features, features to cut, development priorities and low hanging features. This Online Application Development Product Requirement Priority Graphical Representation Topics PDF is perfect for any presentation, be it in front of clients or colleagues. It is a versatile and stylish solution for organizing your meetings. The Online Application Development Product Requirement Priority Graphical Representation Topics PDF features a modern design for your presentation meetings. The adjustable and customizable slides provide unlimited possibilities for acing up your presentation. Slidegeeks has done all the homework before launching the product for you. So, do not wait, grab the presentation templates today
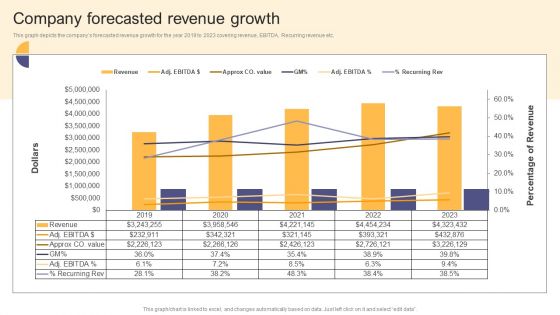
Per Device Pricing Strategy For Managed Solutions Company Forecasted Revenue Growth Themes PDF
This graph depicts the companys forecasted revenue growth for the year 2019 to 2023 covering revenue, EBITDA, Recurring revenue etc. Get a simple yet stunning designed Per Device Pricing Strategy For Managed Solutions Company Forecasted Revenue Growth Themes PDF. It is the best one to establish the tone in your meetings. It is an excellent way to make your presentations highly effective. So, download this PPT today from Slidegeeks and see the positive impacts. Our easy to edit Per Device Pricing Strategy For Managed Solutions Company Forecasted Revenue Growth Themes PDF can be your go to option for all upcoming conferences and meetings. So, what are you waiting for Grab this template today.
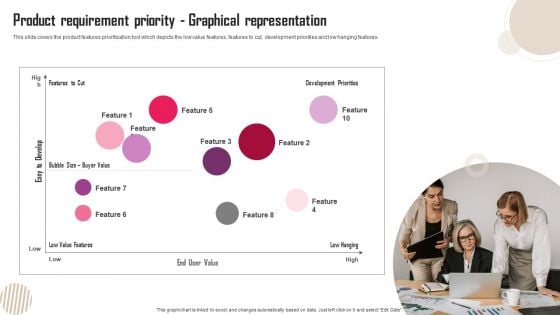
Product Requirement Priority Graphical Representation Template PDF
This slide covers the product features prioritization tool which depicts the low value features, features to cut, development priorities and low hanging features. Get a simple yet stunning designed Product Requirement Priority Graphical Representation Template PDF. It is the best one to establish the tone in your meetings. It is an excellent way to make your presentations highly effective. So, download this PPT today from Slidegeeks and see the positive impacts. Our easy to edit Product Requirement Priority Graphical Representation Template PDF can be your go to option for all upcoming conferences and meetings. So, what are you waiting for Grab this template today.
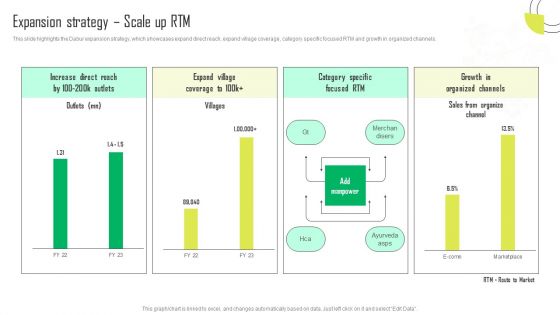
Herbal Products Company Profile Expansion Strategy Scale Up RTM Download PDF
This slide highlights the Dabur expansion strategy, which showcases expand direct reach, expand village coverage, category specific focused RTM and growth in organized channels. Get a simple yet stunning designed Herbal Products Company Profile Expansion Strategy Scale Up RTM Download PDF. It is the best one to establish the tone in your meetings. It is an excellent way to make your presentations highly effective. So, download this PPT today from Slidegeeks and see the positive impacts. Our easy to edit Herbal Products Company Profile Expansion Strategy Scale Up RTM Download PDF can be your go to option for all upcoming conferences and meetings. So, what are you waiting for Grab this template today.
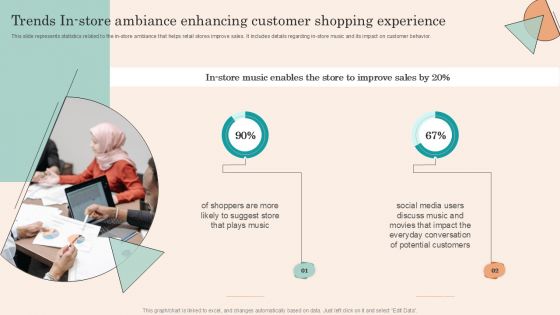
Retail Promotion Strategies To Elevate Shopper Trends In Store Ambiance Enhancing Customer Infographics PDF
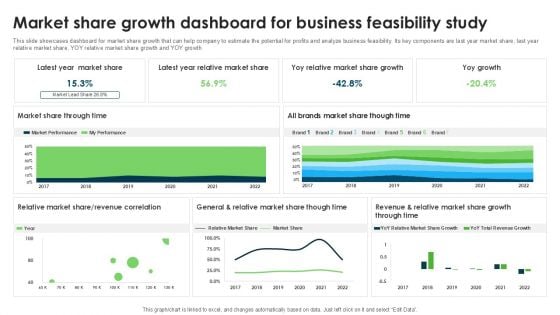
Market Share Growth Dashboard For Business Feasibility Study Demonstration PDF
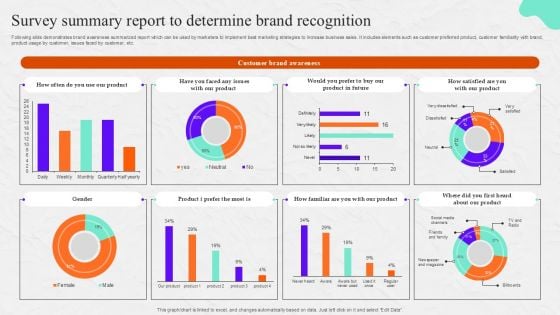
Survey Summary Report To Determine Brand Recognition Survey SS
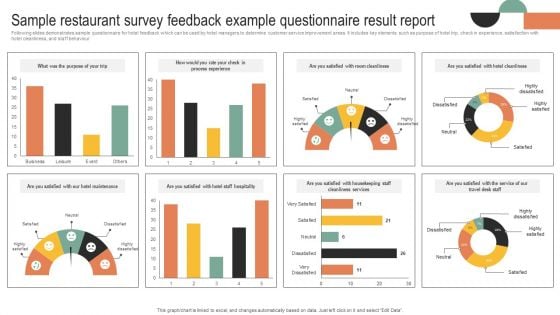
Sample Restaurant Survey Feedback Example Questionnaire Result Report Survey SS
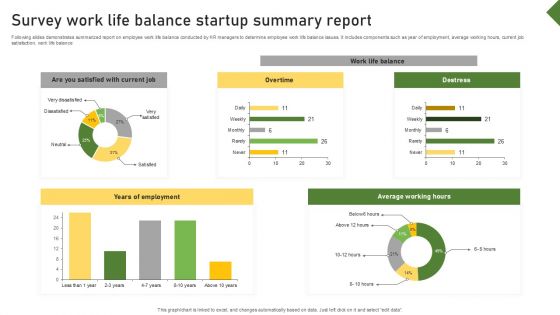
Survey Work Life Balance Startup Summary Report Survey SS
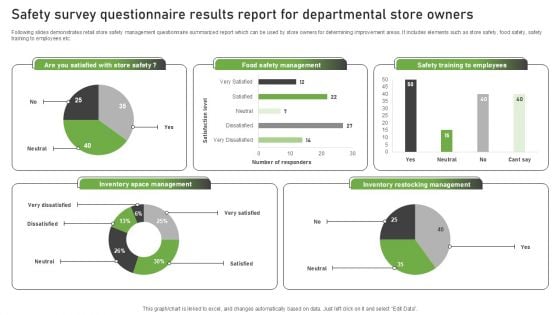
Safety Survey Questionnaire Results Report For Departmental Store Owners Survey SS
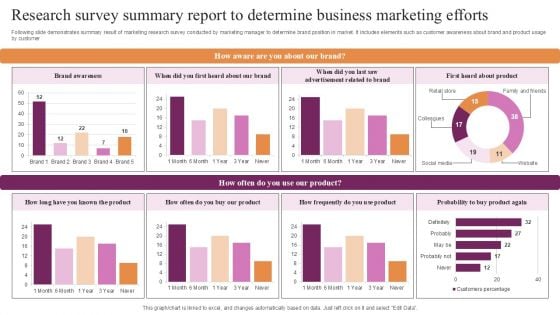
Research Survey Summary Report To Determine Business Marketing Efforts Survey SS
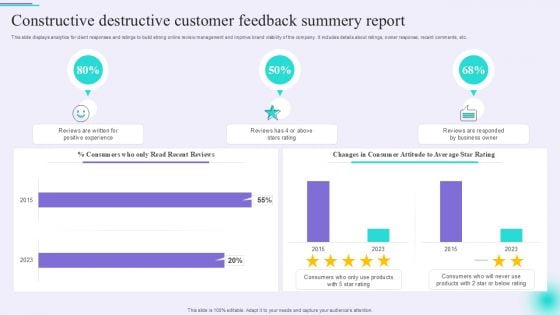
Constructive Destructive Customer Feedback Summery Report Inspiration PDF
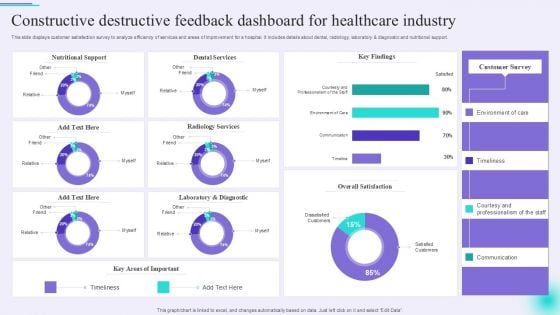
Constructive Destructive Feedback Dashboard For Healthcare Industry Guidelines PDF
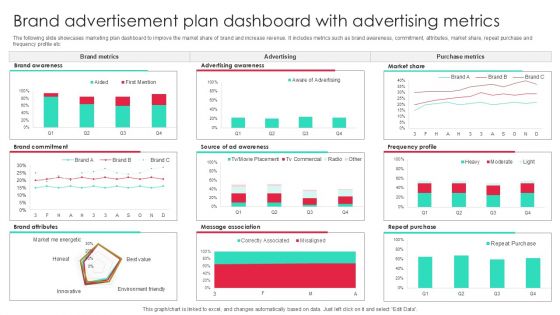
Brand Advertisement Plan Dashboard With Advertising Metrics Inspiration PDF
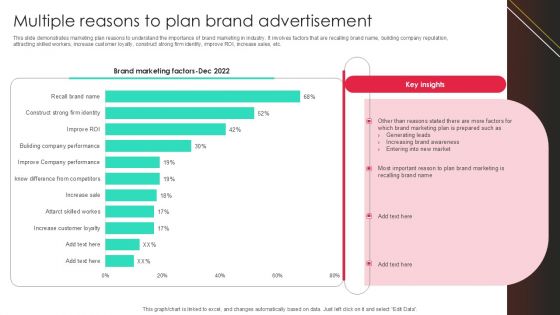
Multiple Reasons To Plan Brand Advertisement Clipart PDF
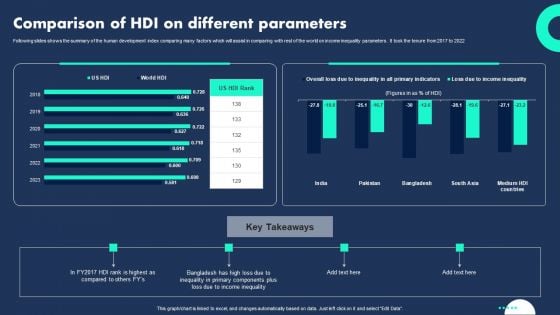
Comparison Of HDI On Different Parameters Diagrams PDF
Following slides shows the summary of the human development index comparing many factors which will assist in comparing with rest of the world on income inequality parameters . It took the tenure from 2017 to 2022. Showcasing this set of slides titled Comparison Of HDI On Different Parameters Diagrams PDF. The topics addressed in these templates are Inequality Primary Components, Plus Loss Income Inequality, Different Parameters . All the content presented in this PPT design is completely editable. Download it and make adjustments in color, background, font etc. as per your unique business setting.
Dashboard For Enterprise Recruitment With Time To Hire And Fill Icons PDF
In this slide corporate staffing dashboard highlights important recruitment KPIs to review application trends and candidate response to job vacancy. It further includes details about application, review, assessment, interview, etc. Showcasing this set of slides titled Dashboard For Enterprise Recruitment With Time To Hire And Fill Icons PDF. The topics addressed in these templates are Key Metrics, Experienced Ratio, Applicants. All the content presented in this PPT design is completely editable. Download it and make adjustments in color, background, font etc. as per your unique business setting.
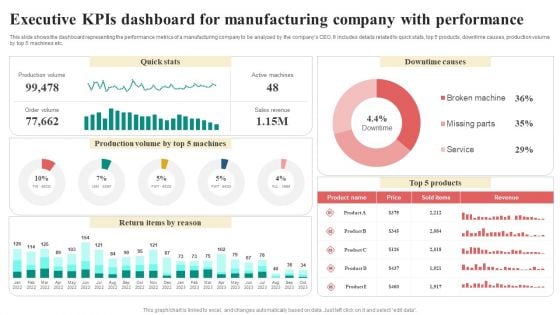
Executive Kpis Dashboard For Manufacturing Company With Performance Infographics PDF
This slide shows the dashboard representing the performance metrics of a manufacturing company to be analyzed by the companys CEO. It includes details related to quick stats, top 5 products, downtime causes, production volume by top 5 machines etc. Showcasing this set of slides titled Executive Kpis Dashboard For Manufacturing Company With Performance Infographics PDF. The topics addressed in these templates are Return Items By Reason, Quick Stats, Downtime Causes, Revenue. All the content presented in this PPT design is completely editable. Download it and make adjustments in color, background, font etc. as per your unique business setting.
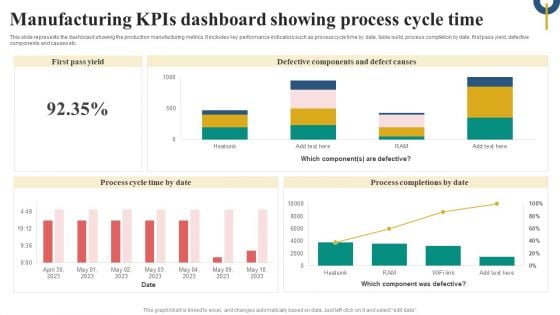
Manufacturing Kpis Dashboard Showing Process Cycle Time Microsoft PDF
This slide represents the dashboard showing the production manufacturing metrics. It includes key performance indicators such as process cycle time by date, table build, process completion by date, first pass yield, defective components and causes etc. Pitch your topic with ease and precision using this Manufacturing Kpis Dashboard Showing Process Cycle Time Microsoft PDF. This layout presents information on Defective Components Defect Causes, Process Cycle, Time By Date, Process Completions By Date. It is also available for immediate download and adjustment. So, changes can be made in the color, design, graphics or any other component to create a unique layout.
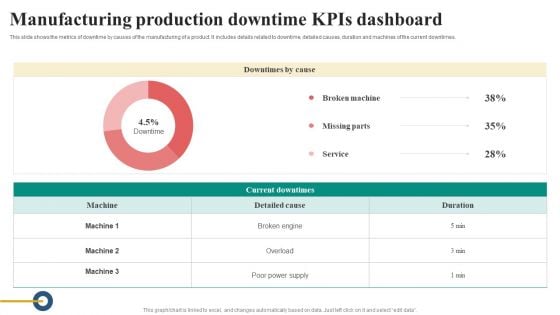
Manufacturing Production Downtime Kpis Dashboard Diagrams PDF
This slide shows the metrics of downtime by causes of the manufacturing of a product. It includes details related to downtime, detailed causes, duration and machines of the current downtimes. Pitch your topic with ease and precision using this Manufacturing Production Downtime Kpis Dashboard Diagrams PDF. This layout presents information on Details Related To Downtime, Detailed Causes, Duration And Machines, Current Downtimes. It is also available for immediate download and adjustment. So, changes can be made in the color, design, graphics or any other component to create a unique layout.
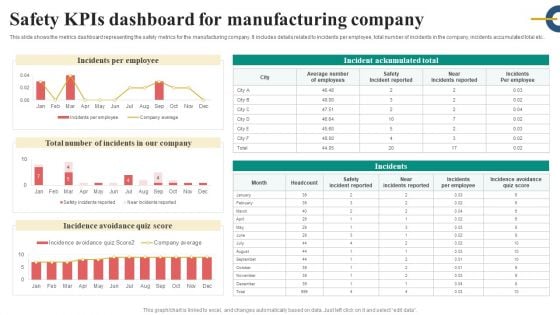
Safety Kpis Dashboard For Manufacturing Company Slides PDF
This slide shows the metrics dashboard representing the safety metrics for the manufacturing company. It includes details related to incidents per employee, total number of incidents in the company, incidents accumulated total etc.. Pitch your topic with ease and precision using this Safety Kpis Dashboard For Manufacturing Company Slides PDF. This layout presents information on Incidents Per Employee, Safety Incident Reported, Incidence Avoidance Quiz Score. It is also available for immediate download and adjustment. So, changes can be made in the color, design, graphics or any other component to create a unique layout.
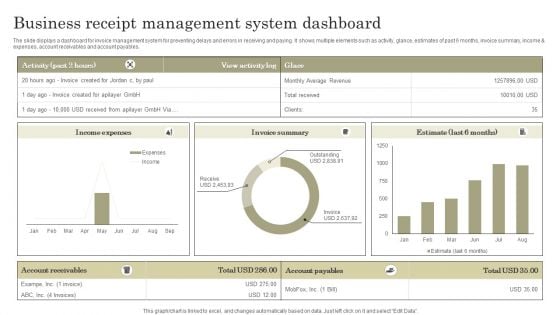
Business Receipt Management System Dashboard Portrait PDF
The slide displays a dashboard for invoice management system for preventing delays and errors in receiving and paying. It shows multiple elements such as activity, glance, estimates of past 6 months, invoice summary, income and expenses, account receivables and account payables. Showcasing this set of slides titled Business Receipt Management System Dashboard Portrait PDF. The topics addressed in these templates are Income expenses, Invoice summary, Estimate. All the content presented in this PPT design is completely editable. Download it and make adjustments in color, background, font etc. as per your unique business setting.
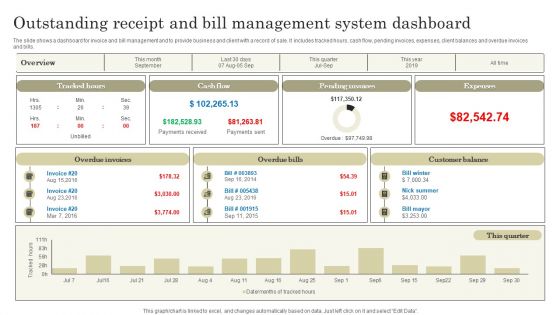
Outstanding Receipt And Bill Management System Dashboard Pictures PDF
The slide shows a dashboard for invoice and bill management and to provide business and client with a record of sale. It includes tracked hours, cash flow, pending invoices, expenses, client balances and overdue invoices and bills. Showcasing this set of slides titled Outstanding Receipt And Bill Management System Dashboard Pictures PDF. The topics addressed in these templates are Tracked hours, Cash flow, Pending invoices, Expenses. All the content presented in this PPT design is completely editable. Download it and make adjustments in color, background, font etc. as per your unique business setting.

Call Center Kpis Agent Performance Dashboard Clipart PDF
This slide covers contact center agent performance metrics KPI dashboard. It involves metrics such as number of calls, average response time, average hold time, daily average transfer rate and agents with most hold time and transfer rate. Showcasing this set of slides titled Call Center Kpis Agent Performance Dashboard Clipart PDF. The topics addressed in these templates are Transfer Rate, Call Center, Hold Time. All the content presented in this PPT design is completely editable. Download it and make adjustments in color, background, font etc. as per your unique business setting.
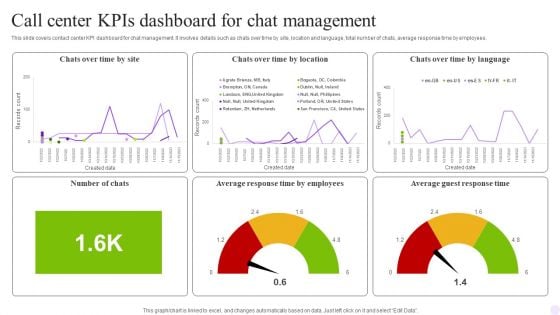
Call Center Kpis Dashboard For Chat Management Graphics PDF
This slide covers contact center KPI dashboard for chat management. It involves details such as chats over time by site, location and language, total number of chats, average response time by employees. Showcasing this set of slides titled Call Center Kpis Dashboard For Chat Management Graphics PDF. The topics addressed in these templates are Management, Employees, Chats. All the content presented in this PPT design is completely editable. Download it and make adjustments in color, background, font etc. as per your unique business setting.
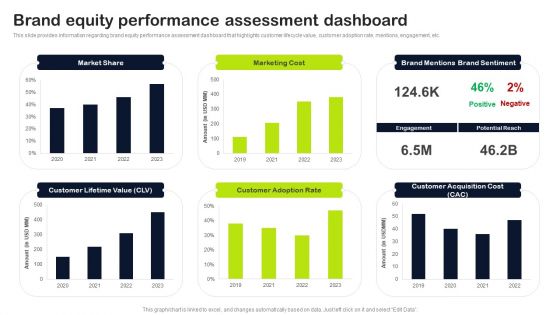
Key Elements Of Strategic Brand Administration Brand Equity Performance Assessment Dashboard Elements PDF
This slide provides information regarding brand equity performance assessment dashboard that highlights customer lifecycle value, customer adoption rate, mentions, engagement, etc. Get a simple yet stunning designed Key Elements Of Strategic Brand Administration Brand Equity Performance Assessment Dashboard Elements PDF. It is the best one to establish the tone in your meetings. It is an excellent way to make your presentations highly effective. So, download this PPT today from Slidegeeks and see the positive impacts. Our easy-to-edit Key Elements Of Strategic Brand Administration Brand Equity Performance Assessment Dashboard Elements PDF can be your go-to option for all upcoming conferences and meetings. So, what are you waiting for Grab this template today.
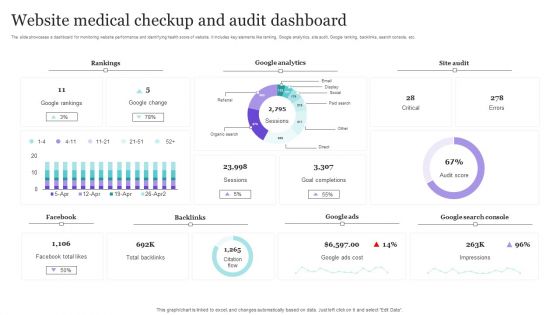
Website Medical Checkup And Audit Dashboard Background PDF
The slide showcases a dashboard for monitoring website performance and identifying health score of website. It includes key elements like ranking, Google analytics, site audit, Google ranking, backlinks, search console, etc. Showcasing this set of slides titled Website Medical Checkup And Audit Dashboard Background PDF. The topics addressed in these templates are Rankings, Google Analytics, Site Audit. All the content presented in this PPT design is completely editable. Download it and make adjustments in color, background, font etc. as per your unique business setting.
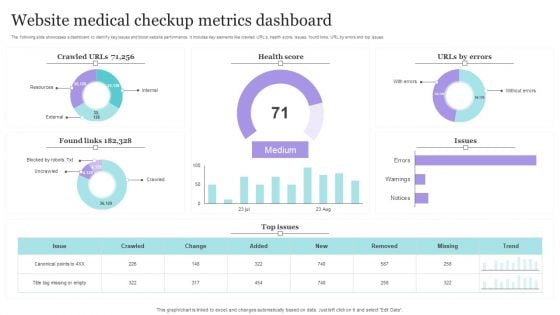
Website Medical Checkup Metrics Dashboard Introduction PDF
The following slide showcases a dashboard to identify key issues and boost website performance. It includes key elements like crawled URLs, health score, issues, found links, URL by errors and top issues. Showcasing this set of slides titled Website Medical Checkup Metrics Dashboard Introduction PDF. The topics addressed in these templates are Website Medical Checkup, Metrics Dashboard. All the content presented in this PPT design is completely editable. Download it and make adjustments in color, background, font etc. as per your unique business setting.
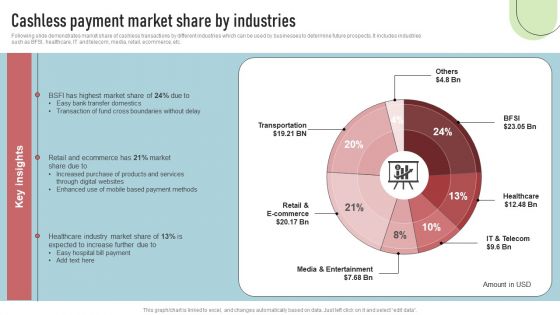
Cashless Payment Strategies To Enhance Business Performance Cashless Payment Market Share By Industries Clipart PDF
Following slide demonstrates market share of cashless transactions by different industries which can be used by businesses to determine future prospects. It includes industries such as BFSI, healthcare, IT and telecom, media, retail, ecommerce, etc. Find a pre-designed and impeccable Cashless Payment Strategies To Enhance Business Performance Cashless Payment Market Share By Industries Clipart PDF. The templates can ace your presentation without additional effort. You can download these easy-to-edit presentation templates to make your presentation stand out from others. So, what are you waiting for Download the template from Slidegeeks today and give a unique touch to your presentation.
Optimizing Brand Equity Through Strategic Management Dashboard Showcasing Relative Increase Brands Market Share Icons PDF
This slide represents the market share growth of the brand and its relative performance in the market. It includes current market share, close market share, year-on-year share, year-on-year growth, etc. From laying roadmaps to briefing everything in detail, our templates are perfect for you. You can set the stage with your presentation slides. All you have to do is download these easy-to-edit and customizable templates. Optimizing Brand Equity Through Strategic Management Dashboard Showcasing Relative Increase Brands Market Share Icons PDF will help you deliver an outstanding performance that everyone would remember and praise you for. Do download this presentation today.
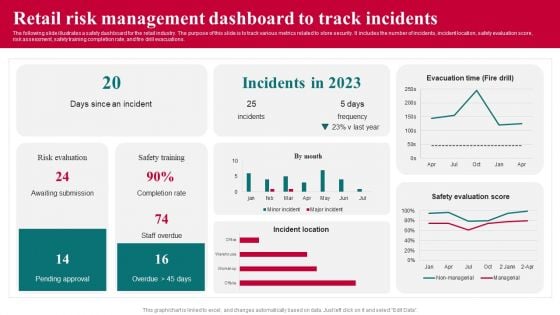
Retail Risk Management Dashboard To Track Incidents Professional PDF
The following slide illustrates a safety dashboard for the retail industry. The purpose of this slide is to track various metrics related to store security. It includes the number of incidents, incident location, safety evaluation score,risk assessment, safety training completion rate, and fire drill evacuations. Showcasing this set of slides titled Retail Risk Management Dashboard To Track Incidents Professional PDF. The topics addressed in these templates are Risk Evaluation, Retail Risk Management Dashboard, Track Incidents. All the content presented in this PPT design is completely editable. Download it and make adjustments in color, background, font etc. as per your unique business setting.

Vendor Performance KPI With Rejection Rate Inspiration PDF
This slide exhibits supplier dashboard which allows organisation to monitor level of dependency towards supplier and analyse the quality of each of them. It includes elements such as number of suppliers currently, compliance rate, rejection rate, etc. Pitch your topic with ease and precision using this Vendor Performance KPI With Rejection Rate Inspiration PDF. This layout presents information on Vendor Performance KPI, Rejection Rate. It is also available for immediate download and adjustment. So, changes can be made in the color, design, graphics or any other component to create a unique layout.
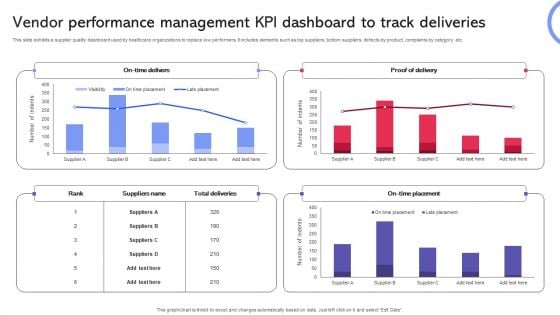
Vendor Performance Management KPI Dashboard To Track Deliveries Graphics PDF
This slide exhibits a supplier quality dashboard used by healthcare organizations to replace low performers. It includes elements such as top suppliers, bottom suppliers, defects by product, complaints by category, etc. Showcasing this set of slides titled Vendor Performance Management KPI Dashboard To Track Deliveries Graphics PDF. The topics addressed in these templates are Vendor Performance Management, KPI Dashboard, Track Deliveries. All the content presented in this PPT design is completely editable. Download it and make adjustments in color, background, font etc. as per your unique business setting.
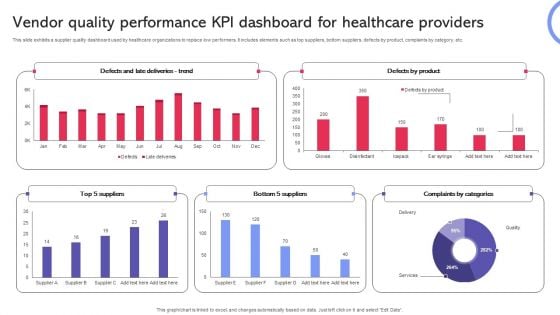
Vendor Quality Performance KPI Dashboard For Healthcare Providers Introduction PDF
This slide exhibits a supplier quality dashboard used by healthcare organizations to replace low performers. It includes elements such as top suppliers, bottom suppliers, defects by product, complaints by category, etc. Showcasing this set of slides titled Vendor Quality Performance KPI Dashboard For Healthcare Providers Introduction PDF. The topics addressed in these templates are Vendor Quality, Performance KPI Dashboard, Healthcare Providers. All the content presented in this PPT design is completely editable. Download it and make adjustments in color, background, font etc. as per your unique business setting.
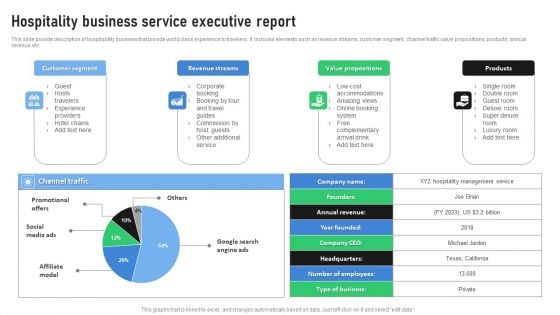
Hospitality Business Service Executive Report Demonstration PDF
This slide provide description of hospitability business that provide world class experience to travelers. It includes elements such as revenue streams, customer segment , channel traffic value propositions, products, annual revenue etc. Showcasing this set of slides titled Hospitality Business Service Executive Report Demonstration PDF. The topics addressed in these templates are Customer Segment, Revenue Streams, Value Propositions. All the content presented in this PPT design is completely editable. Download it and make adjustments in color, background, font etc. as per your unique business setting.
KPI Dashboard For Tracking Multiverse Market Growth Background PDF
Following slide demonstrates KPI dashboard for predicting metaverse market share growth to determine business development opportunities. It includes elements such as total addressable market insights, global market share, monthly active users on metaverse and market size growth. Showcasing this set of slides titled KPI Dashboard For Tracking Multiverse Market Growth Background PDF. The topics addressed in these templates are Addressable Market Insights, Global Market Share, Growth Prediction. All the content presented in this PPT design is completely editable. Download it and make adjustments in color, background, font etc. as per your unique business setting.


 Continue with Email

 Home
Home


