Bar Chart Comparison
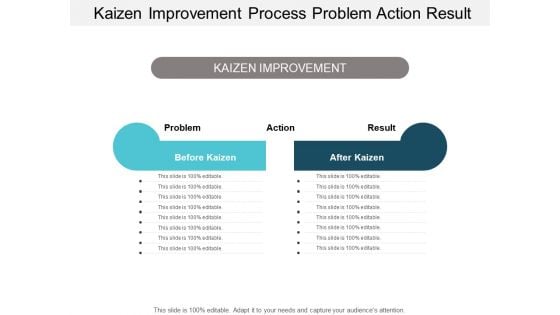
Kaizen Improvement Process Problem Action Result Ppt PowerPoint Presentation Portfolio Example File
This is a kaizen improvement process problem action result ppt powerpoint presentation portfolio example file. This is a two stage process. The stages in this process are before vs after, comparison, compare.

Collection Of Quality Assurance PPT Seven Basic Quality Control Tools Inspiration PDF
Following slide illustrates seven basic quality control tools that organization may use to maintain its product quality. Tools covered are fish bone, flow chart, control chart, pareto chart, check sheet, histogram and scatter plot. This is a collection of quality assurance ppt seven basic quality control tools inspiration pdf template with various stages. Focus and dispense information on seven stages using this creative set, that comes with editable features. It contains large content boxes to add your information on topics like control chart, flow charts, pareto chart, scatter plot, histogram. You can also showcase facts, figures, and other relevant content using this PPT layout. Grab it now.
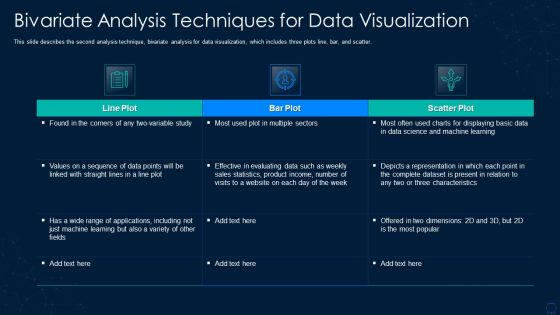
Graphical Representation Of Research IT Bivariate Analysis Techniques Formats PDF
This slide describes the second analysis technique, bivariate analysis for data visualization, which includes three plots line, bar, and scatter. Deliver and pitch your topic in the best possible manner with this graphical representation of research it bivariate analysis techniques formats pdf. Use them to share invaluable insights on bivariate analysis techniques for data visualization and impress your audience. This template can be altered and modified as per your expectations. So, grab it now.

Ppt Describing Blue Components Using Chevron Diagram PowerPoint Free Templates
PPT describing blue components using chevron diagram powerpoint free Templates-A chevron (also spelled cheveron, especially in older documents) is an inverted V-shaped pattern. It signifies badge, bar, beam, glove, insignia, mark, molding, stripe, zigzag etc. It is describing Blue part of whole Process. -Can be used for presentations on accounts, advice, arrow, art, attorney, background, bank, becoming, benefits, bills, chart, chevron, clip, clipart, diagram, drop, durable, estate, finances, financial, graphic, having, illustration, incapacitated, infographic, lawsuits, legal, loans, personal, plan, power, property, protection, real, shadow, slide, taxes, transparency, vector-PPT describing blue components using chevron diagram powerpoint free Templates Fight off critics with our Ppt Describing Blue Components Using Chevron Diagram PowerPoint Free Templates. Be confident and convinced of your assessment.
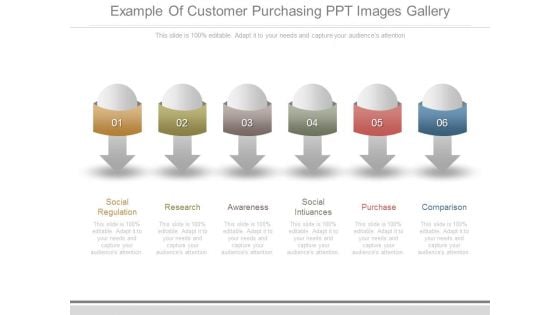
Example Of Customer Purchasing Ppt Images Gallery
This is a example of customer purchasing ppt images gallery. This is a six stage process. The stages in this process are social regulation, research, awareness, social intiuances, purchase, comparison.
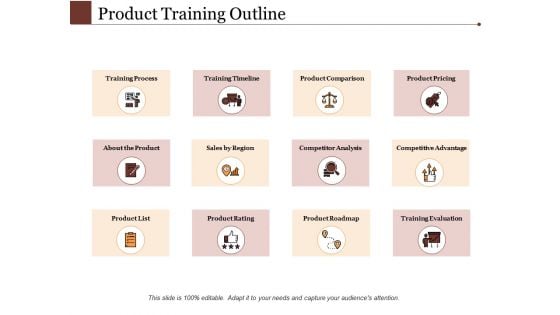
Product Training Outline Ppt PowerPoint Presentation Summary Inspiration
This is a product training outline ppt powerpoint presentation summary inspiration. This is a twelve stage process. The stages in this process are training process, competitor analysis, product comparison.
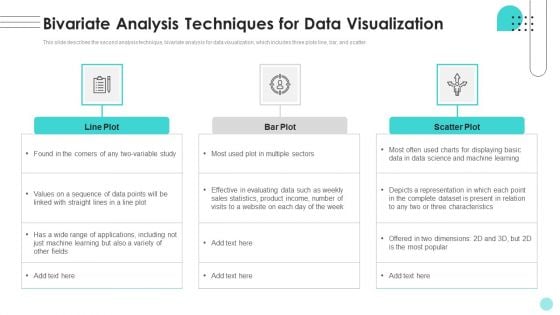
Branches For Visualization Research And Development Bivariate Analysis Techniques For Data Structure PDF
This slide describes the second analysis technique, bivariate analysis for data visualization, which includes three plots line, bar, and scatter. There are so many reasons you need a Branches For Visualization Research And Development Bivariate Analysis Techniques For Data Structure PDF. The first reason is you cant spend time making everything from scratch, Thus, Slidegeeks has made presentation templates for you too. You can easily download these templates from our website easily.
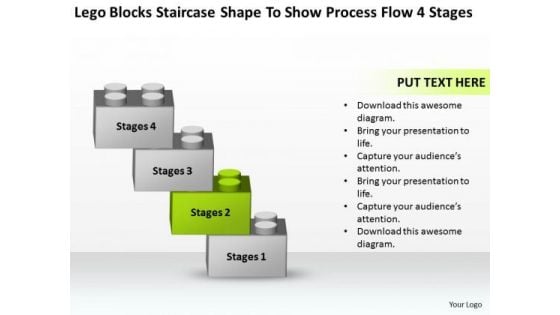
Blocks Staircase Shape To Show Process Flow 4 Stages Ppt Market Plan Example PowerPoint Slides
We present our blocks staircase shape to show process flow 4 stages ppt market plan example PowerPoint Slides.Present our Leadership PowerPoint Templates because Our PowerPoint Templates and Slides will weave a web of your great ideas. They are gauranteed to attract even the most critical of your colleagues. Download and present our Process and Flows PowerPoint Templates because Our PowerPoint Templates and Slides will give you great value for your money. Be assured of finding the best projection to highlight your words. Present our Shapes PowerPoint Templates because You can Channelise the thoughts of your team with our PowerPoint Templates and Slides. Urge them to focus on the goals you have set. Use our Business PowerPoint Templates because Our PowerPoint Templates and Slides will provide weight to your words. They will bring out the depth of your thought process. Use our Game PowerPoint Templates because Our PowerPoint Templates and Slides will fulfill your every need. Use them and effectively satisfy the desires of your audience.Use these PowerPoint slides for presentations relating to lego, building, concept, standard, isolated, electric, brick, economy, conservation, bar, eco, power, pollution, consumption, render, environmental, diagram, electricity, ecology, level, effectiveness, scale, idea, graph, protection, energy, comparison, object, efficiency, chart, protect, efficient, rating, norm, color, toy, home, house, friendly, saving, background, environment, ecological, construction, game, block, effective. The prominent colors used in the PowerPoint template are Green lime, Gray, White. Deserve the best with our Blocks Staircase Shape To Show Process Flow 4 Stages Ppt Market Plan Example PowerPoint Slides. You will come out on top.

Quality Assurance Templates Set 3 Seven Basic Quality Control Tools Template PDF
Following slide illustrates seven basic quality control tools that organization may use to maintain its product quality. Tools covered are fish bone, flow chart, control chart, pareto chart, check sheet, histogram and scatter plot. This is a quality assurance templates set 3 seven basic quality control tools template pdf template with various stages. Focus and dispense information on seven stages using this creative set, that comes with editable features. It contains large content boxes to add your information on topics like fish bone, flow charts, control chart, pareto chart, check sheets. You can also showcase facts, figures, and other relevant content using this PPT layout. Grab it now.
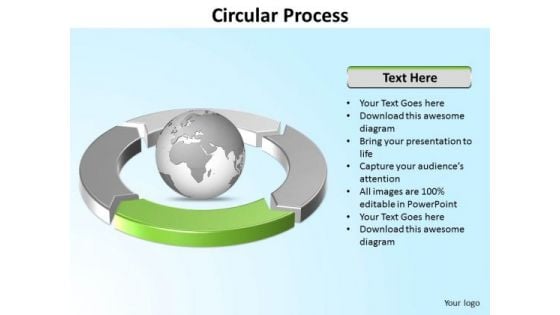
Ppt Four Segments Around Spinning Globe PowerPoint Template Circle Green Templates
PPT four segments around spinning globe powerpoint template circle green Templates-This PowerPoint Diagram can be used to represent worldwide issues such as Global warming, Acid Rain, Poverty, Racism,Obesity, overpopulation. It is illustrated by Green component. This Diagram will fit for Business Presentations.-Can be used for presentations on abstract, achievement, aim, arrow, background, business, chart, communication, company, competition, concept, design, development, diagram, direction, finance, financial, forecast, forward, goal, graph, graphic, growth, icon, illustration, increase, investment, leader, leadership, marketing, motion, moving, path, price, process, profit, progress, progress bar, shape, sign, success, symbol, target, team, teamwork, turquoise blue, up, upward-PPT four segments around spinning globe powerpoint template circle green Templates Compare products and services with our Ppt Four Segments Around Spinning Globe PowerPoint Template Circle Green Templates. You will come out on top.
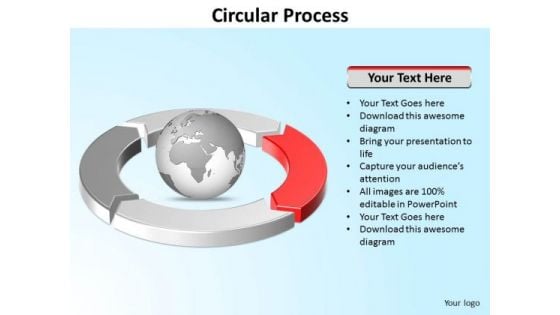
Ppt Four Segments Around Spinning Globe PowerPoint Template Circle Red Templates
PPT four segments around spinning globe powerpoint template circle red Templates-This PowerPoint Diagram can be used to represent worldwide issues such as Global warming, Acid Rain, Poverty, Racism,Obesity, overpopulation etc. It is illustrated by Red component. This Diagram will fit for Business Presentations.-Can be used for presentations on abstract, achievement, aim, arrow, background, business, chart, communication, company, competition, concept, design, development, diagram, direction, finance, financial, forecast, forward, goal, graph, graphic, growth, icon, illustration, increase, investment, leader, leadership, marketing, motion, moving, path, price, process, profit, progress, progress bar, shape, sign, success, symbol, target, team, teamwork, turquoise blue, up, upward-PPT four segments around spinning globe powerpoint template circle red Templates Enter the professional club with our Ppt Four Segments Around Spinning Globe PowerPoint Template Circle Red Templates. You will come out on top.

Ppt Four Segments Around Globe PowerPoint Presentation Circle Blue Templates
PPT four segments around globe powerpoint presentation circle blue Templates-This PowerPoint Diagram can be used to represent worldwide business issues such as financial data, stock market Exchange, increase in sales, corporate presentations and more. It illustrates the blue component of this worldwide PowerPoint Diagram.-Can be used for presentations on abstract, achievement, aim, arrow, background, business, chart, communication, company, competition, concept, design, development, diagram, direction, finance, financial, forecast, forward, goal, graph, graphic, growth, icon, illustration, increase, investment, leader, leadership, marketing, motion, moving, path, price, process, profit, progress, progress bar, shape, sign, success, symbol, target, team, teamwork, turquoise blue, up, upward-PPT four segments around globe powerpoint presentation circle blue Templates Add to your armoury with our Ppt Four Segments Around Globe PowerPoint Presentation Circle Blue Templates. Take up the contest with your thoughts.
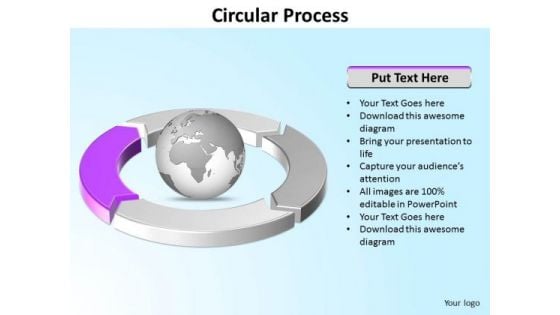
Ppt Four Segments Around Microsoft PowerPoint Backgrounds Circle Purple Templates
PPT four segments around microsoft powerpoint backgrounds circle purple Templates-This PowerPoint Diagram can be used to represent worldwide business issues such as financial data, stock market Exchange, increase in sales, corporate presentations and more. It illustrates the purple component. This Diagram will fit for Business Presentations.-Can be used for presentations on abstract, achievement, aim, arrow, background, business, chart, communication, company, competition, concept, design, development, diagram, direction, finance, financial, forecast, forward, goal, graph, graphic, growth, icon, illustration, increase, investment, leader, leadership, marketing, motion, moving, path, price, process, profit, progress, progress bar, shape, sign, success, symbol, target, team, teamwork, turquoise blue, up, upward-PPT four segments around microsoft powerpoint backgrounds circle purple Templates Handle a delicate situation with our Ppt Four Segments Around Microsoft PowerPoint Backgrounds Circle Purple Templates. Just download, type and present.
Chief Financial Officer PowerPoint Templates Cfo Ppt Slides
Chief Financial Officer PowerPoint templates CFO PPT Slides-These high quality powerpoint pre-designed slides and powerpoint templates have been carefully created by our professional team to help you impress your audience. All slides have been created and are 100% editable in powerpoint. Each and every property of any graphic - color, size, orientation, shading, outline etc. can be modified to help you build an effective powerpoint presentation. Any text can be entered at any point in the powerpoint template or slide. Simply DOWNLOAD, TYPE and PRESENT!These PowerPoint designs and slide layouts can be used to in presentations relating to --Achievement, analysis, arrow, bank, banking, bar, business, capital, chart, coin, concept, credit, currency, deposit, diagram, earn, earnings, economics, finance, financial, gain, gold, golden, graph, growth, idea, interest, investment, isolated, make, marketing, monetary, money, company,computer,funding,grid,growing,green,growth,precut,statistics,succeed,tradc, savings, stack, strategy, success Your ideas will feature amongst the best. Ensure their ascendancy with our Chief Financial Officer PowerPoint Templates Cfo Ppt Slides.
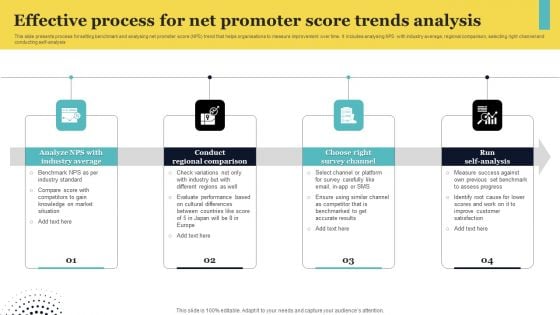
Effective Process For Net Promoter Score Trends Analysis Formats PDF
This slide presents process for setting benchmark and analysing net promoter score NPS trend that helps organisations to measure improvement over time. It includes analysing NPS with industry average, regional comparison, selecting right channel and conducting self-analysis Presenting Effective Process For Net Promoter Score Trends Analysis Formats PDF to dispense important information. This template comprises four stages. It also presents valuable insights into the topics including Industry Average, Regional Comparison, Survey Channel. This is a completely customizable PowerPoint theme that can be put to use immediately. So, download it and address the topic impactfully.
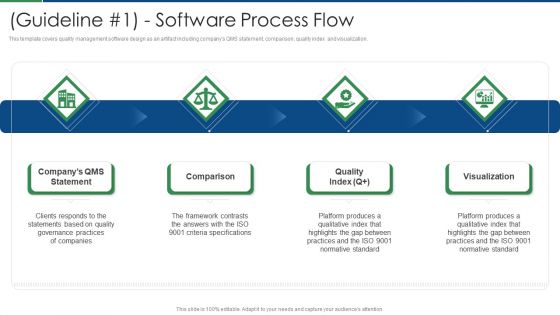
International Standard For Quality Management System Guideline 1 Software Process Flow Elements PDF
This template covers quality management software design as an artifact including companys QMS statement, comparison, quality index and visualization. This is a international standard for quality management system guideline 1 software process flow elements pdf template with various stages. Focus and dispense information on four stages using this creative set, that comes with editable features. It contains large content boxes to add your information on topics like companys qms statement, comparison, quality index, visualization. You can also showcase facts, figures, and other relevant content using this PPT layout. Grab it now.
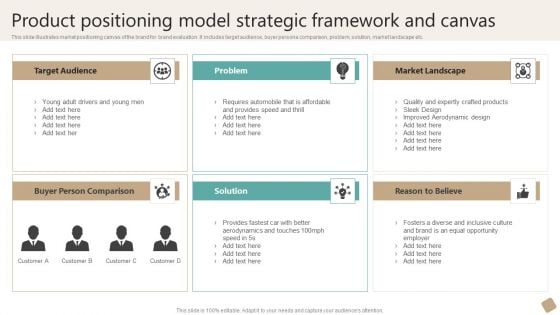
Product Positioning Model Strategic Framework And Canvas Demonstration PDF
This slide illustrates market positioning canvas of the brand for brand evaluation. It includes target audience, buyer persona comparison, problem, solution, market landscape etc. Persuade your audience using this Product Positioning Model Strategic Framework And Canvas Demonstration PDF. This PPT design covers six stages, thus making it a great tool to use. It also caters to a variety of topics including Buyer Person Comparison, Target Audience, Market Landscape. Download this PPT design now to present a convincing pitch that not only emphasizes the topic but also showcases your presentation skills.
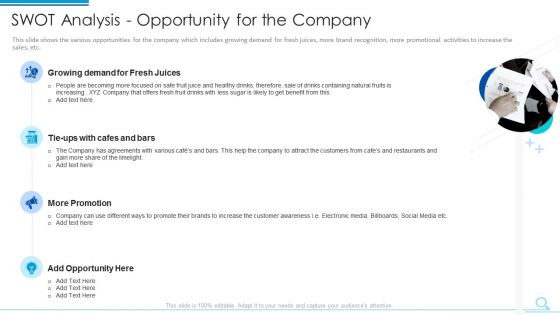
Swot Analysis Opportunity For The Company Formats PDF
This is a swot analysis opportunity for the company formats pdf template with various stages. Focus and dispense information on four stages using this creative set, that comes with editable features. It contains large content boxes to add your information on topics like growing demand for fresh juices, tie ups with cafes and bars, more promotion. You can also showcase facts, figures, and other relevant content using this PPT layout. Grab it now.
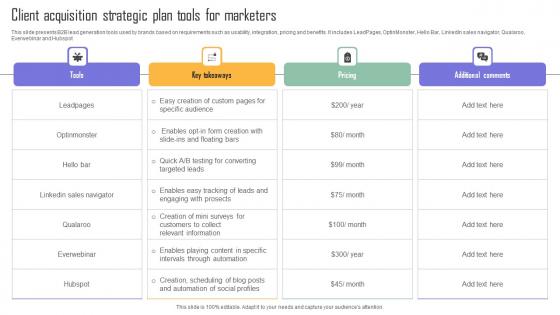
Client Acquisition Strategic Plan Tools For Marketers Graphics Pdf
This slide presents B2B lead generation tools used by brands based on requirements such as usability, integration, pricing and benefits. It includes LeadPages, OptinMonster, Hello Bar, LinkedIn sales navigator, Qualaroo, Everwebinar and Hubspot. Pitch your topic with ease and precision using this Client Acquisition Strategic Plan Tools For Marketers Graphics Pdf. This layout presents information on Tools, Key Takeaways, Pricing. It is also available for immediate download and adjustment. So, changes can be made in the color, design, graphics or any other component to create a unique layout. This slide presents B2B lead generation tools used by brands based on requirements such as usability, integration, pricing and benefits. It includes LeadPages, OptinMonster, Hello Bar, LinkedIn sales navigator, Qualaroo, Everwebinar and Hubspot.
Winning New Customers Strategies Why We Need A Customer Acquisition Strategy Plan Ppt Icon Slide Portrait PDF
Presenting this set of slides with name winning new customers strategies why we need a customer acquisition strategy plan ppt icon slide portrait pdf. This is a six stage process. The stages in this process are targeting, process, engagement, revenue, comparison. This is a completely editable PowerPoint presentation and is available for immediate download. Download now and impress your audience.
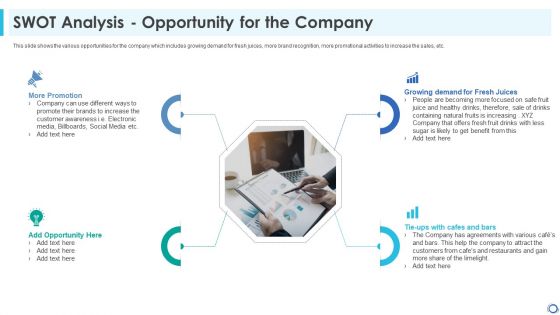
Swot Analysis Opportunity For The Company Media Pictures PDF
This is a swot analysis opportunity for the company media pictures pdf. template with various stages. Focus and dispense information on four stages using this creative set, that comes with editable features. It contains large content boxes to add your information on topics like more promotion, opportunity, growing demand for fresh juices, tie ups with cafes and bars. You can also showcase facts, figures, and other relevant content using this PPT layout. Grab it now.
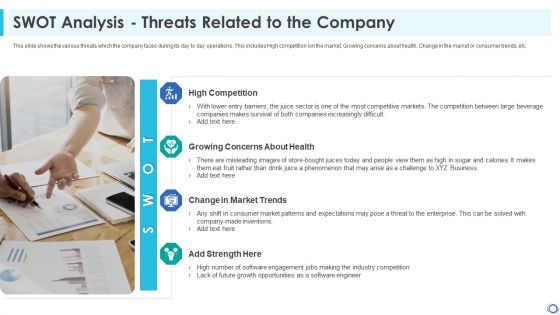
Swot Analysis Threats Related To The Company Sale Designs PDF
This is a swot analysis threats related to the company sale designs pdf. template with various stages. Focus and dispense information on four stages using this creative set, that comes with editable features. It contains large content boxes to add your information on topics like growing demand for fresh juices, tie ups with cafes and bars, more promotion, opportunity. You can also showcase facts, figures, and other relevant content using this PPT layout. Grab it now.
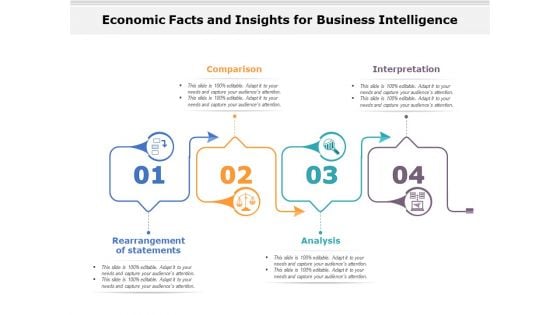
Economic Facts And Insights For Business Intelligence Ppt PowerPoint Presentation Slides File Formats PDF
Presenting economic facts and insights for business intelligence ppt powerpoint presentation slides file formats pdf to dispense important information. This template comprises four stages. It also presents valuable insights into the topics including comparison, interpretation, rearrangement of statements, analysis. This is a completely customizable PowerPoint theme that can be put to use immediately. So, download it and address the topic impactfully.

Improving Retention Rate By Implementing Why We Need A Customer Acquisition Strategy Plan Portrait PDF
Presenting this set of slides with name improving retention rate by implementing why we need a customer acquisition strategy plan portrait pdf. This is a six stage process. The stages in this process are targeting, process, engagement, revenue, comparison. This is a completely editable PowerPoint presentation and is available for immediate download. Download now and impress your audience.
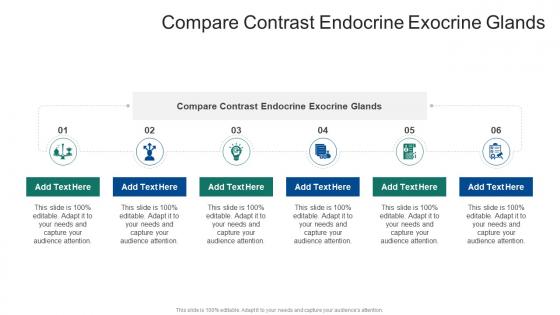
Compare Contrast Endocrine Exocrine Glands In Powerpoint And Google Slides Cpb
Presenting our innovatively-designed set of slides titled Compare Contrast Endocrine Exocrine Glands In Powerpoint And Google Slides Cpb. This completely editable PowerPoint graphic exhibits Compare Contrast Endocrine Exocrine Glands that will help you convey the message impactfully. It can be accessed with Google Slides and is available in both standard screen and widescreen aspect ratios. Apart from this, you can download this well-structured PowerPoint template design in different formats like PDF, JPG, and PNG. So, click the download button now to gain full access to this PPT design. Our Compare Contrast Endocrine Exocrine Glands In Powerpoint And Google Slides Cpb are topically designed to provide an attractive backdrop to any subject. Use them to look like a presentation pro.

Commodity Category Analysis Competitive Landscape Ppt Model Show PDF
Presenting commodity category analysis competitive landscape ppt model show pdf to provide visual cues and insights. Share and navigate important information on three stages that need your due attention. This template can be used to pitch topics like product competencies, product comparison, competitor analysis. In addtion, this PPT design contains high resolution images, graphics, etc, that are easily editable and available for immediate download.
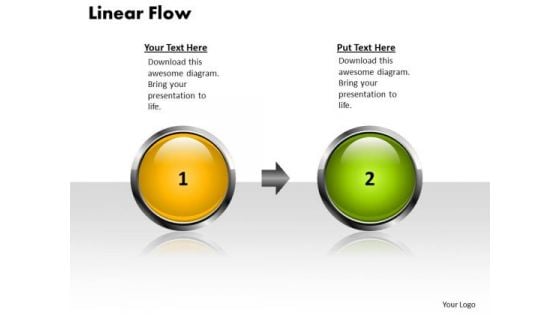
Editable Ppt Theme Linear Flow 2 States Diagram Project Management PowerPoint 1 Image
editable PPT Theme linear flow 2 states diagram project management powerpoint 1 Image-This PowerPoint diagram can be used for product comparison. You can easily edit the size, position, text, color and change any other background style. Create captivating presentations to deliver comparative and weighted arguments.-editable PPT Theme linear flow 2 states diagram project management powerpoint 1 Image-Aim, Arrow, Arrowheads, Badge, Border, Click, Connection, Curve, Design, Direction, Download, Element, Fuchsia, Icon, Illustration, Indicator, Internet, Magenta, Mark, Object, Orientation, Pointer, Shadow, Shape, Sign Our Editable Ppt Theme Linear Flow 2 States Diagram Project Management PowerPoint 1 Image are very falcon like. They keep a sharp eye on the target.
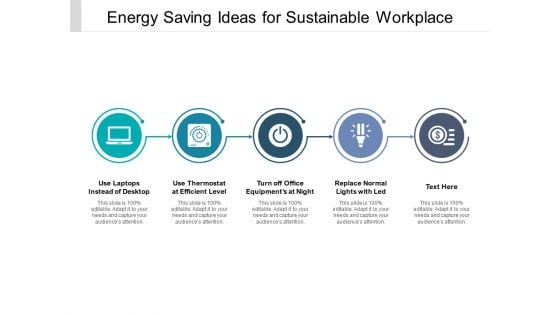
Energy Saving Ideas For Sustainable Workplace Ppt PowerPoint Presentation Professional Information
Presenting this set of slides with name energy saving ideas for sustainable workplace ppt powerpoint presentation professional information. This is a five stage process. The stages in this process are energy efficiency, energy comparison, electricity. This is a completely editable PowerPoint presentation and is available for immediate download. Download now and impress your audience.
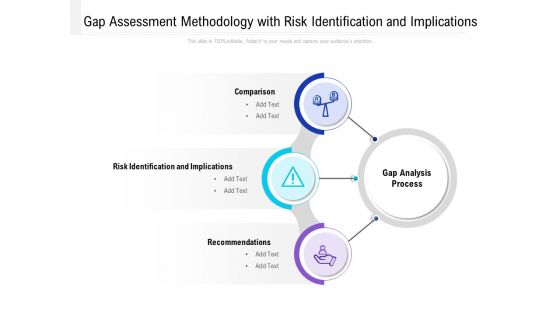
Gap Assessment Methodology With Risk Identification And Implications Ppt PowerPoint Presentation Ideas Graphic Tips PDF
Presenting this set of slides with name gap assessment methodology with risk identification and implications ppt powerpoint presentation ideas graphic tips pdf. This is a three stage process. The stages in this process are comparison, risk identification and implications, recommendations, gap analysis process. This is a completely editable PowerPoint presentation and is available for immediate download. Download now and impress your audience.

Departments Of Visualization Research Bivariate Analysis Techniques For Data Visualization Ideas PDF
This slide describes the second analysis technique, bivariate analysis for data visualization, which includes three plots line, bar, and scatter.This is a Departments Of Visualization Research Bivariate Analysis Techniques For Data Visualization Ideas PDF template with various stages. Focus and dispense information on three stages using this creative set, that comes with editable features. It contains large content boxes to add your information on topics like Effective In Evaluating, Displaying Basic, Range Of Applications, Including You can also showcase facts, figures, and other relevant content using this PPT layout. Grab it now.
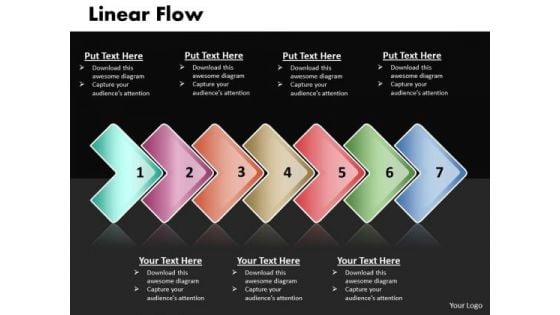
Ppt Linear Process Flow PowerPoint Template 7 Stage Templates
PPT linear process flow powerpoint template 7 stage Templates-Use this graphic to represent a continuing sequence of stages, tasks, or events and emphasizes the connection between all components-PPT linear process flow powerpoint template 7 stage Templates-Abstract, Arrow, Arrow Chart, Business, Design, Development, Diagram, Direction, Element, Flow, Flow Chart, Flow Diagram, Flowchart, Graph, Linear, Management, Model, Motion, Organization, Plan, Process, Process Arrows, Process Chart, Process Diagram, Process Flow, Program, Section, Segment, Set, Sign, Solution, Strategy, Symbol, Technology Enlist teams with our Ppt Linear Process Flow PowerPoint Template 7 Stage Templates. Download without worries with our money back guaranteee.
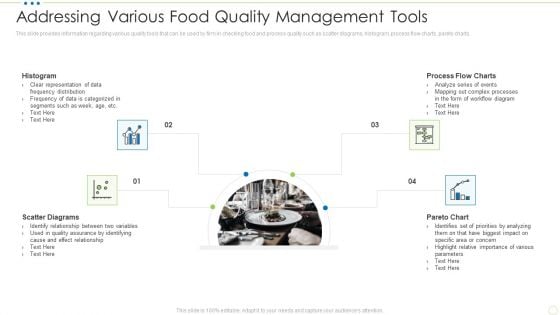
Addressing Various Food Quality Management Tools Food Security Excellence Ppt Inspiration Example PDF
This slide provides information regarding various quality tools that can be used by firm in checking food and process quality such as scatter diagrams, histogram, process flow charts, pareto charts. This is a addressing various food quality management tools food security excellence ppt inspiration example pdf template with various stages. Focus and dispense information on four stages using this creative set, that comes with editable features. It contains large content boxes to add your information on topics like scatter diagrams, histogram, process flow charts, pareto chart. You can also showcase facts, figures, and other relevant content using this PPT layout. Grab it now.
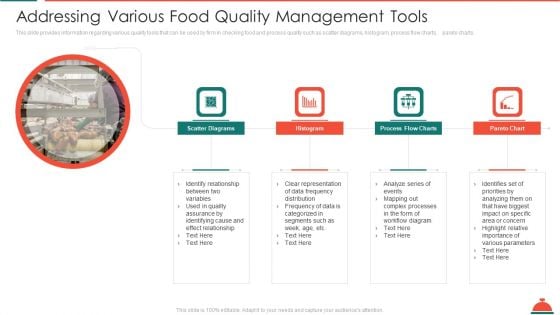
Addressing Various Food Quality Management Tools Increased Superiority For Food Products Graphics PDF
This slide provides information regarding various quality tools that can be used by firm in checking food and process quality such as scatter diagrams, histogram, process flow charts, pareto charts. This is a addressing various food quality management tools increased superiority for food products graphics pdf template with various stages. Focus and dispense information on four stages using this creative set, that comes with editable features. It contains large content boxes to add your information on topics like scatter diagrams, histogram, process flow charts, pareto chart. You can also showcase facts, figures, and other relevant content using this PPT layout. Grab it now.
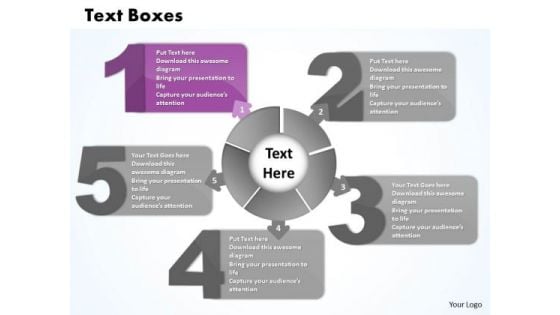
Ppt Five Text Align Boxes PowerPoint 2010 Connected With Circle Templates
PPT five text align boxes powerpoint 2010 connected with circle Templates-Use this Circular Process with five text Boxes to represent a continuing sequence of stages, tasks, or events in a circular flow and emphasize the connection between all components. You can change color, size and orientation of any icon to your liking.-PPT five text align boxes powerpoint 2010 connected with circle Templates Do not let complacency set in. Our Ppt Five Text Align Boxes PowerPoint 2010 Connected With Circle Templates will assist you in raising the bar.

Capital Funding Pitch Deck For Hospitality Services The Solution Investor Pitch Deck For Hotel Business Diagrams PDF
Purpose of this slide is to grab the attention of potential audience by addressing information about the solution. It also includes information about the key offerings of the product.This is a Capital Funding Pitch Deck For Hospitality Services The Solution Investor Pitch Deck For Hotel Business Diagrams PDF template with various stages. Focus and dispense information on four stages using this creative set, that comes with editable features. It contains large content boxes to add your information on topics like Economical Boutique, Restaurants And Bars, Aesthetic Design. You can also showcase facts, figures, and other relevant content using this PPT layout. Grab it now.
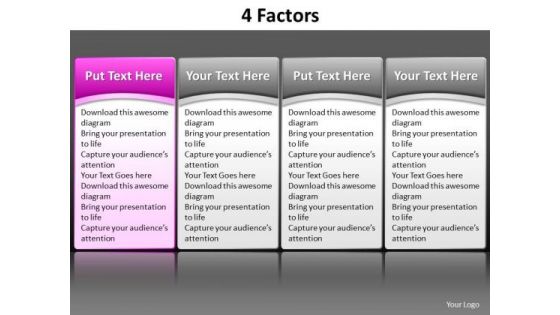
Ppt Pink PowerPoint Presentation Table Listing Its Factors Components Templates
PPT pink powerpoint presentation table listing its factors components Templates-Use this Table diagram to show activities that are related to the business plan metrics and monitor the results to determine if the business plan is proceeding as planned. This Pink Table illustrates the concept of Tabular Method.-Can be used for presentations on banner, bar, box, bullet, button, clean, cool, creative, design, editable, elements, empty, eps8, glossy, gradient, gray, green, hosting, interface, label, list, menu, metallic, modern, navigation, object, order, plan, price, red, select, shiny, sidebar, simple, site, sticker, style, support, tab, tariff, template, transparent, vector, web, webdesign, webpage, website, www, yellow-PPT pink powerpoint presentation table listing its factors components Templates Get enthusiastic with our Ppt Pink PowerPoint Presentation Table Listing Its Factors Components Templates. Encourage your team to better performances.
PowerPoint Themes Company Puzzle Matrix Ppt Designs
PowerPoint Themes Company Puzzle Matrix PPT Designs- It is all there in bits and pieces. Individual components well researched and understood in their place. Now you need to get it all together to form the complete picture and reach the goal. You have the ideas and plans on how to go about it. Use this template to illustrate your method, piece by piece, and interlock the whole process in the minds of your audience.-PowerPoint Themes Company Puzzle Matrix PPT Designs Your efforts will never fall short. Our PowerPoint Themes Company Puzzle Matrix Ppt Designs keep you above the bar.
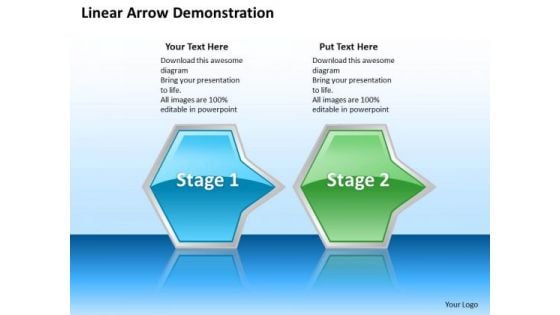
Ppt Horizontal Demonstration Of Octagonal Arrows 2 State Diagram PowerPoint Templates
PPT horizontal demonstration of octagonal arrows 2 state diagram PowerPoint Templates-This PowerPoint Diagram shows you the Horizontal Demonstration of Business Process using octagonal arrows. It consists of two approaches or factors or components.-PPT horizontal demonstration of octagonal arrows 2 state diagram PowerPoint Templates-Shapes, Designs, Arrows, Badge, Balloon, Bar, Blank, Blue, Bright, Bubbles, Buttons, Circle, Color, Cross, Design, Drop, Elements, Glossy, Glowing, Graphic, Hexagon, Icon, Illustration, Navigation, Octagon, Plus, Polygon, Rectangles, Round, Seals, Set, Shadow, Shiny, Sign, Speech, Squares, Stars, Stickers, Submit, Symbol Exhibit distinguished performance with our Ppt Horizontal Demonstration Of Octagonal Arrows 2 State Diagram PowerPoint Templates. They will make you look good.
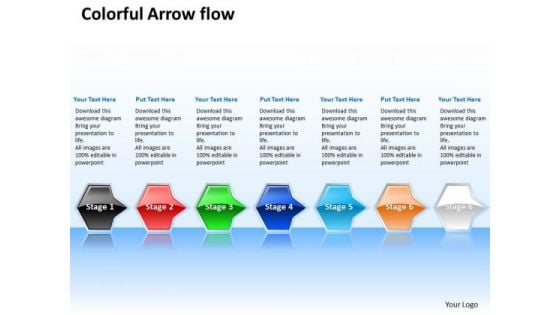
Ppt Sequential Flow Of Octagonal Shapes Arrows PowerPoint 7 State Diagram Templates
PPT sequential flow of octagonal shapes arrows powerpoint 7 state diagram Templates-This PowerPoint Diagram shows you the Sequential Flow of Business Process using octagonal arrows. It consists of seven stages or approaches or factors or components.-PPT sequential flow of octagonal shapes arrows powerpoint 7 state diagram Templates-Shapes, Designs, Arrows, Badge, Balloon, Bar, Blank, Blue, Bright, Bubbles, Buttons, Circle, Color, Cross, Design, Drop, Elements, Glossy, Glowing, Graphic, Hexagon, Icon, Illustration, Navigation, Octagon, Plus, Polygon, Rectangles, Round, Seals, Set, Shadow, Shiny, Sign, Speech, Squares, Stars, Stickers, Submit, Symbol Cheer to success with our Ppt Sequential Flow Of Octagonal Shapes Arrows PowerPoint 7 State Diagram Templates. You will come out on top.
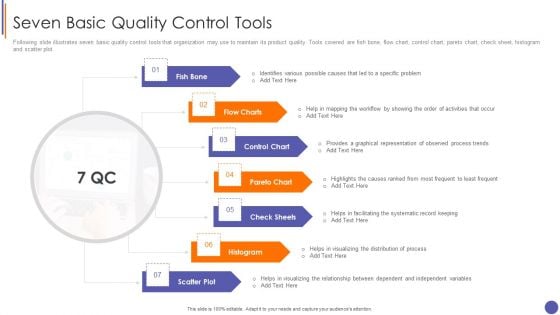
Contents For QA Plan And Process Set 3 Seven Basic Quality Control Tools Demonstration PDF
Following slide illustrates seven basic quality control tools that organization may use to maintain its product quality. Tools covered are fish bone, flow chart, control chart, pareto chart, check sheet, histogram and scatter plot.This is a Contents For QA Plan And Process Set 3 Seven Basic Quality Control Tools Demonstration PDF template with various stages. Focus and dispense information on seven stages using this creative set, that comes with editable features. It contains large content boxes to add your information on topics like Identifies Various, Graphical Representation, Facilitating The Systematic You can also showcase facts, figures, and other relevant content using this PPT layout. Grab it now.

Bivariate Analysis Techniques For Data Visualization Formats PDF
This slide describes the second analysis technique, bivariate analysis for data visualization, which includes three plots line, bar, and scatter. Are you in need of a template that can accommodate all of your creative concepts This one is crafted professionally and can be altered to fit any style. Use it with Google Slides or PowerPoint. Include striking photographs, symbols, depictions, and other visuals. Fill, move around, or remove text boxes as desired. Test out color palettes and font mixtures. Edit and save your work, or work with colleagues. Download Bivariate Analysis Techniques For Data Visualization Formats PDF and observe how to make your presentation outstanding. Give an impeccable presentation to your group and make your presentation unforgettable.
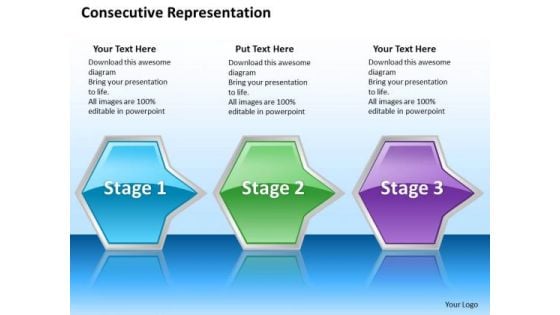
Ppt Successive Representation Of Octagonal Arrows PowerPoint Templates 3 Stages
PPT successive representation of octagonal arrows powerpoint templates 3 stages-This PowerPoint Diagram shows you the Successive Representation of Management Procedures using octagonal arrows. It consists of three stages or approaches or factors or components.-PPT successive representation of octagonal arrows powerpoint templates 3 stages-Shapes, Designs, Arrows, Badge, Balloon, Bar, Blank, Blue, Bright, Bubbles, Buttons, Circle, Color, Cross, Design, Drop, Elements, Glossy, Glowing, Graphic, Hexagon, Icon, Illustration, Navigation, Octagon, Plus, Polygon, Rectangles, Round, Seals, Set, Shadow, Shiny, Sign, Speech, Squares, Stars, Stickers, Submit, Symbol Accentuate the beauty of your thoughts with our Ppt Successive Representation Of Octagonal Arrows PowerPoint Templates 3 Stages. They will prove an apt adornment.
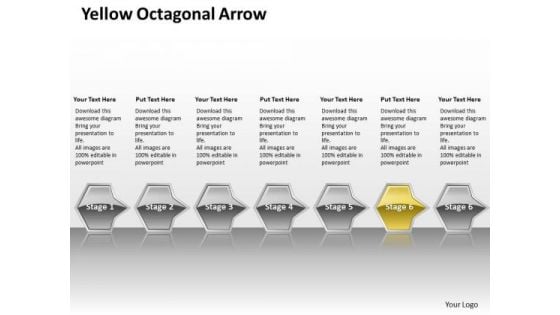
Ppt Direct Flow Of Yellow Octagonal Circular Arrows PowerPoint 2007 Stages Templates
PPT direct flow of yellow octagonal circular arrows powerpoint 2007 stages Templates-This PowerPoint Diagram shows you the Consecutive Representation of Business Process using octagonal arrows. It consists of seven approaches or factors or components but explaining the yellow approach here.-PPT direct flow of yellow octagonal circular arrows powerpoint 2007 stages Templates-Shapes, Designs, Arrows, Badge, Balloon, Bar, Blank, Blue, Bright, Bubbles, Buttons, Circle, Color, Cross, Design, Drop, Elements, Glossy, Glowing, Graphic, Hexagon, Icon, Illustration, Navigation, Octagon, Plus, Polygon, Rectangles, Round, Seals, Set, Shadow, Shiny, Sign, Speech, Squares, Stars, Stickers, Submit, Symbol Check the air with our Ppt Direct Flow Of Yellow Octagonal Circular Arrows PowerPoint 2007 Stages Templates. Your feelers will recieve appropriate responses.
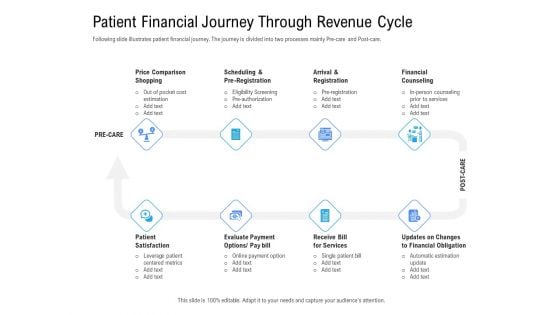
Revenue Cycle Management Deal Patient Financial Journey Through Revenue Cycle Designs PDF
This is a revenue cycle management deal patient financial journey through revenue cycle designs pdf template with various stages. Focus and dispense information on eight stages using this creative set, that comes with editable features. It contains large content boxes to add your information on topics like price comparison, financial counseling, evaluate payment, financial obligation, cost estimation. You can also showcase facts, figures, and other relevant content using this PPT layout. Grab it now.
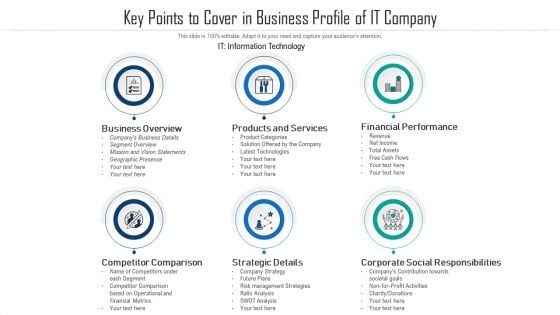
Key Points To Cover In Business Profile Of It Company Ppt PowerPoint Presentation Infographics Guidelines PDF
This is a key points to cover in business profile of it company ppt powerpoint presentation infographics guidelines pdf template with various stages. Focus and dispense information on six stages using this creative set, that comes with editable features. It contains large content boxes to add your information on topics like competitor comparison, strategic details, corporate social responsibilities. You can also showcase facts, figures, and other relevant content using this PPT layout. Grab it now.
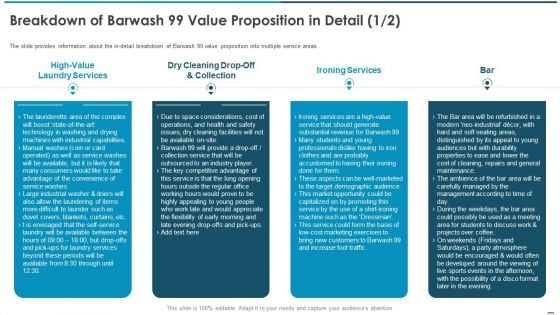
Sell Side Confidential Information Memorandum CIM Pitch Book Breakdown Of Barwash 99 Value Proposition Mockup PDF
The slide provides information about the in-detail breakdown of Barwash 99 value proposition into multiple service areas. This is a sell side confidential information memorandum cim pitch book breakdown of barwash 99 value proposition mockup pdf template with various stages. Focus and dispense information on four stages using this creative set, that comes with editable features. It contains large content boxes to add your information on topics like high value laundry services, dry cleaning drop off and collection, ironing services, bar. You can also showcase facts, figures, and other relevant content using this PPT layout. Grab it now.
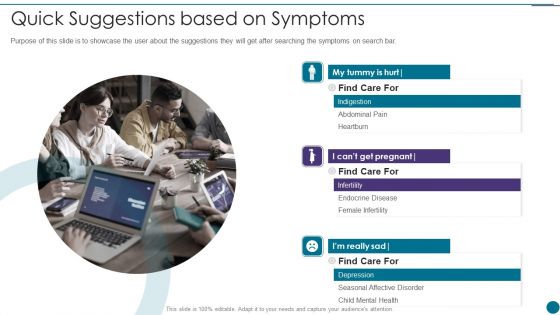
Oscar Capital Raising Pitch Deck Total Amount Owed Oscar Pitch Deck Sample PDF
Purpose of this slide is to showcase the user about the suggestions they will get after searching the symptoms on search bar. This is a oscar capital raising pitch deck quick suggestions based on symptoms background pdf template with various stages. Focus and dispense information on four stages using this creative set, that comes with editable features. It contains large content boxes to add your information on topics like quick suggestions based on symptoms. You can also showcase facts, figures, and other relevant content using this PPT layout. Grab it now.
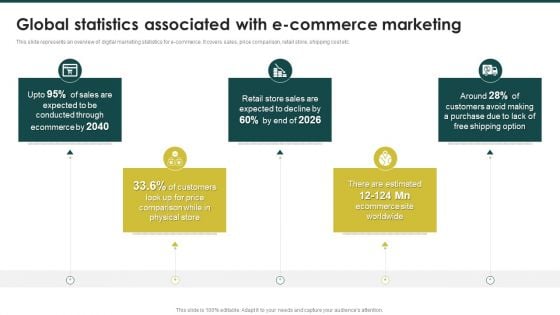
Global Statistics Associated With Ecommerce Marketing Ecommerce Marketing Plan To Enhance Diagrams PDF
This slide represents an overview of digital marketing statistics for e-commerce. It covers sales, price comparison, retail store, shipping cost etc.From laying roadmaps to briefing everything in detail, our templates are perfect for you. You can set the stage with your presentation slides. All you have to do is download these easy-to-edit and customizable templates. Global Statistics Associated With Ecommerce Marketing Ecommerce Marketing Plan To Enhance Diagrams PDF will help you deliver an outstanding performance that everyone would remember and praise you for. Do download this presentation today.
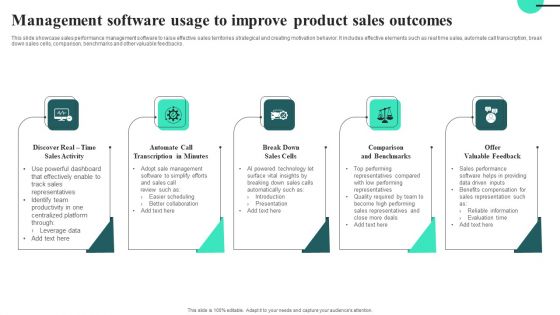
Management Software Usage To Improve Product Sales Outcomes Themes PDF
This slide showcase sales performance management software to raise effective sales territories strategical and creating motivation behavior. It includes effective elements such as real time sales, automate call transcription, break down sales cells, comparison, benchmarks and other valuable feedbacks.Presenting Management Software Usage To Improve Product Sales Outcomes Themes PDF to dispense important information. This template comprises five stages. It also presents valuable insights into the topics including Automate Call, Transcription In Minutes. This is a completely customizable PowerPoint theme that can be put to use immediately. So, download it and address the topic impactfully.
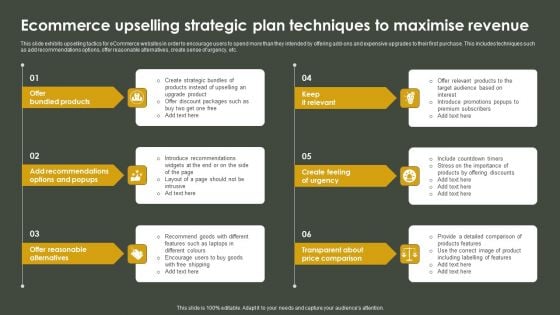
Ecommerce Upselling Strategic Plan Techniques To Maximise Revenue Brochure PDF
This slide exhibits upselling tactics for eCommerce websites in order to encourage users to spend more than they intended by offering add-ons and expensive upgrades to their first purchase. This includes techniques such as add recommendations options, offer reasonable alternatives, create sense of urgency, etc. Presenting Ecommerce Upselling Strategic Plan Techniques To Maximise Revenue Brochure PDF to dispense important information. This template comprises six stages. It also presents valuable insights into the topics including Bundled Products, Alternatives, Comparison. This is a completely customizable PowerPoint theme that can be put to use immediately. So, download it and address the topic impactfully.
Steps To Achieve ISO 9001 Certification Guideline 1 Software Process Flow Icons PDF
This template covers quality management software design as an artifact including companys QMS statement, comparison, quality index and visualization. This is a Steps To Achieve ISO 9001 Certification Guideline 1 Software Process Flow Icons PDF template with various stages. Focus and dispense information on four stages using this creative set, that comes with editable features. It contains large content boxes to add your information on topics like Quality Index, Visualization, Software Process Flow. You can also showcase facts, figures, and other relevant content using this PPT layout. Grab it now.
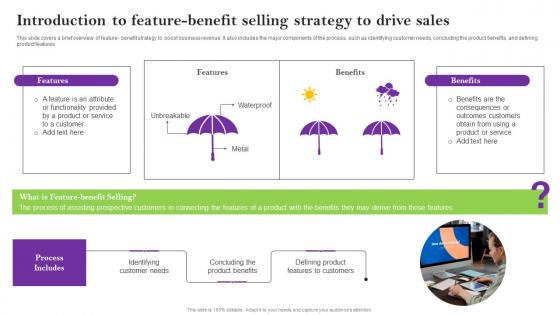
Introduction To Feature Benefit Selling Strategy Sales Techniques For Achieving Template Pdf
This slide covers a brief overview of feature benefit strategy to boost business revenue. It also includes the major components of the process, such as identifying customer needs, concluding the product benefits, and defining product features. Make sure to capture your audiences attention in your business displays with our gratis customizable Introduction To Feature Benefit Selling Strategy Sales Techniques For Achieving Template Pdf. These are great for business strategies, office conferences, capital raising or task suggestions. If you desire to acquire more customers for your tech business and ensure they stay satisfied, create your own sales presentation with these plain slides. This slide covers a brief overview of feature benefit strategy to boost business revenue. It also includes the major components of the process, such as identifying customer needs, concluding the product benefits, and defining product features.
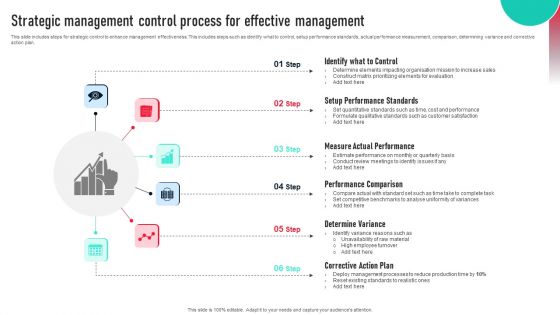
Strategic Management Control Process For Effective Management Structure PDF
This slide includes steps for strategic control to enhance management effectiveness. This includes steps such as identify what to control, setup performance standards, actual performance measurement, comparison, determining variance and corrective action plan. Presenting Strategic Management Control Process For Effective Management Structure PDF to dispense important information. This template comprises six stages. It also presents valuable insights into the topics including Identify Control, Setup Performance Standards, Measure Actual Performance. This is a completely customizable PowerPoint theme that can be put to use immediately. So, download it and address the topic impactfully.
Spurious Correlation In Powerpoint And Google Slides Cpb
Presenting our innovatively designed set of slides titled Spurious Correlation In Powerpoint And Google Slides Cpb This completely editable PowerPoint graphic exhibits Spurious Correlation that will help you convey the message impactfully. It can be accessed with Google Slides and is available in both standard screen and widescreen aspect ratios. Apart from this, you can download this well structured PowerPoint template design in different formats like PDF, JPG, and PNG. So, click the download button now to gain full access to this PPT design. Our Spurious Correlation In Powerpoint And Google Slides Cpb are topically designed to provide an attractive backdrop to any subject. Use them to look like a presentation pro.
Spurious Correlations In Powerpoint And Google Slides Cpb
Presenting our innovatively designed set of slides titled Spurious Correlations In Powerpoint And Google Slides Cpb. This completely editable PowerPoint graphic exhibits Spurious Correlations that will help you convey the message impactfully. It can be accessed with Google Slides and is available in both standard screen and widescreen aspect ratios. Apart from this, you can download this well-structured PowerPoint template design in different formats like PDF, JPG, and PNG. So, click the download button now to gain full access to this PPT design. Our Spurious Correlations In Powerpoint And Google Slides Cpb are topically designed to provide an attractive backdrop to any subject. Use them to look like a presentation pro.
Correlation Analysis In Powerpoint And Google Slides Cpb
Presenting our innovatively designed set of slides titled Correlation Analysis In Powerpoint And Google Slides Cpb. This completely editable PowerPoint graphic exhibits Correlation Analysis that will help you convey the message impactfully. It can be accessed with Google Slides and is available in both standard screen and widescreen aspect ratios. Apart from this, you can download this well structured PowerPoint template design in different formats like PDF, JPG, and PNG. So, click the download button now to gain full access to this PPT design. Our Correlation Analysis In Powerpoint And Google Slides Cpb are topically designed to provide an attractive backdrop to any subject. Use them to look like a presentation pro.
Correlation Coefficient In Powerpoint And Google Slides Cpb
Presenting our innovatively designed set of slides titled Correlation Coefficient In Powerpoint And Google Slides Cpb. This completely editable PowerPoint graphic exhibits Correlation Coefficient that will help you convey the message impactfully. It can be accessed with Google Slides and is available in both standard screen and widescreen aspect ratios. Apart from this, you can download this well structured PowerPoint template design in different formats like PDF, JPG, and PNG. So, click the download button now to gain full access to this PPT design. Our Correlation Coefficient In Powerpoint And Google Slides Cpb are topically designed to provide an attractive backdrop to any subject. Use them to look like a presentation pro.
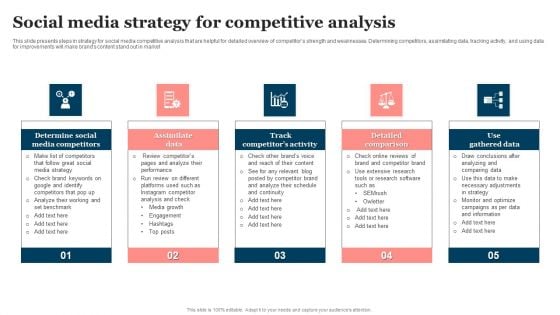
Social Media Strategy For Competitive Analysis Professional PDF
This slide presents steps in strategy for social media competitive analysis that are helpful for detailed overview of competitors strength and weaknesses. Determining competitors, assimilating data, tracking activity, and using data for improvements will make brands content stand out in market. Presenting Social Media Strategy For Competitive Analysis Professional PDF to dispense important information. This template comprises five stages. It also presents valuable insights into the topics including Assimilate Data, Detailed Comparison, Track Competitors Activity. This is a completely customizable PowerPoint theme that can be put to use immediately. So, download it and address the topic impactfully.
Gene Environment Correlation In Powerpoint And Google Slides Cpb
Introducing our well-designed Gene Environment Correlation In Powerpoint And Google Slides Cpb. This PowerPoint design presents information on topics like Gene Environment Correlation. As it is predesigned it helps boost your confidence level. It also makes you a better presenter because of its high-quality content and graphics. This PPT layout can be downloaded and used in different formats like PDF, PNG, and JPG. Not only this, it is available in both Standard Screen and Widescreen aspect ratios for your convenience. Therefore, click on the download button now to persuade and impress your audience. Our Gene Environment Correlation In Powerpoint And Google Slides Cpb are topically designed to provide an attractive backdrop to any subject. Use them to look like a presentation pro.

Positive Correlation Coefficient In Powerpoint And Google Slides Cpb
Introducing our well designed Positive Correlation Coefficient In Powerpoint And Google Slides Cpb. This PowerPoint design presents information on topics like Positive Correlation Coefficient. As it is predesigned it helps boost your confidence level. It also makes you a better presenter because of its high quality content and graphics. This PPT layout can be downloaded and used in different formats like PDF, PNG, and JPG. Not only this, it is available in both Standard Screen and Widescreen aspect ratios for your convenience. Therefore, click on the download button now to persuade and impress your audience. Our Positive Correlation Coefficient In Powerpoint And Google Slides Cpb are topically designed to provide an attractive backdrop to any subject. Use them to look like a presentation pro.


 Continue with Email

 Home
Home


