Bar Chart
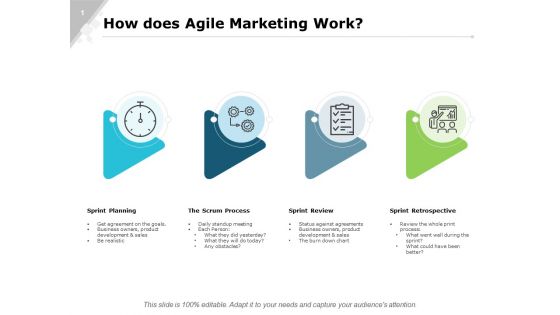
How Does Agile Marketing Work Ppt PowerPoint Presentation Diagram Graph Charts
This is a how does agile marketing work ppt powerpoint presentation diagram graph charts. This is a four stage process. The stages in this process are business, planning, strategy, marketing, management.
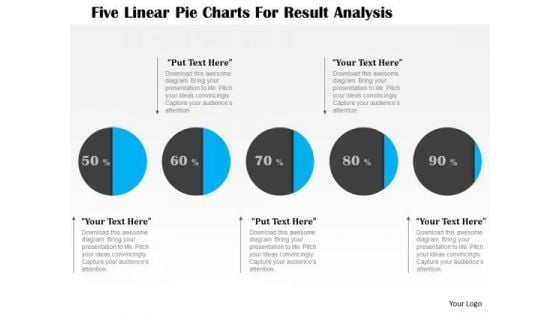
Business Diagram Five Linear Pie Charts For Result Analysis Presentation Template
This business diagram displays graphic of five staged process flow diagram. This PPT slide contains the concept of business data representation. Use this diagram to build professional presentation for your viewers.
Data Collection Histograms Ppt PowerPoint Presentation Icon Slides
This is a data collection histograms ppt powerpoint presentation icon slides. This is a two stage process. The stages in this process are bar chart, finance, marketing, business, analysis.
Analysis Techniques Pareto Analysis Ppt PowerPoint Presentation Professional Icons
This is a analysis techniques pareto analysis ppt powerpoint presentation professional icons. This is a two stage process. The stages in this process are bar chart, finance, marketing, business, analysis.

Financial Computing Business PowerPoint Background And Template 1210
Microsoft PowerPoint Template and Background with Financial computing deskto computer with bar chart. Instruct your team with our Financial Computing Business PowerPoint Background And Template 1210. Make sure your presentation gets the attention it deserves.
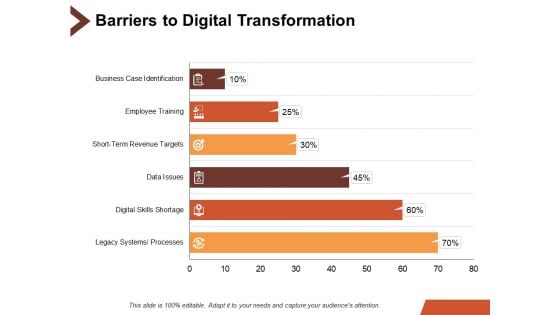
Barriers To Digital Transformation Ppt PowerPoint Presentation Professional Influencers
This is a barriers to digital transformation ppt powerpoint presentation professional influencers. This is a six stage process. The stages in this process are bar chart, finance, marketing, business, analysis.
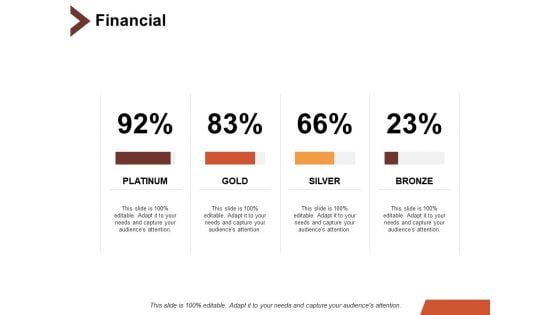
Financial Business Marketing Ppt PowerPoint Presentation Slides Aids
This is a financial business marketing ppt powerpoint presentation slides aids. This is a four stage process. The stages in this process are bar chart, finance, marketing, business, analysis.
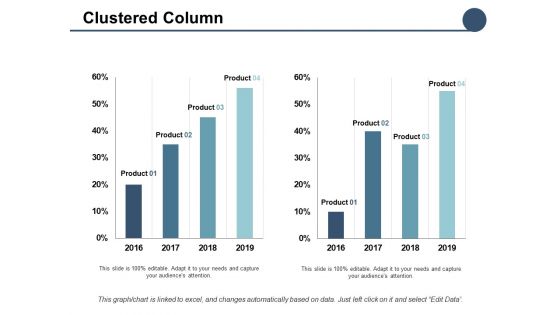
Clustered Column Finance Ppt PowerPoint Presentation Pictures Inspiration
This is a clustered column finance ppt powerpoint presentation pictures inspiration. This is a two stage process. The stages in this process are bar chart, finance, marketing, business, analysis.

Success Industrial PowerPoint Themes And PowerPoint Slides 0511
Microsoft PowerPoint Theme and Slide with 3d illustration of a multi colored bar chart inside the center opening of a large gear Your efforts will never fall short. Our Success Industrial PowerPoint Themes And PowerPoint Slides 0511 keep you above the bar.
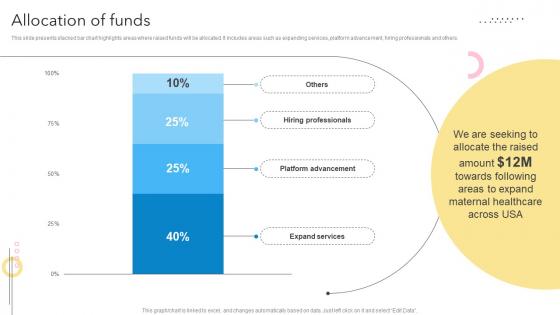
Allocation Of Funds Maternity Support Platform Pitch Deck
This slide presents stacked bar chart highlights areas where raised funds will be allocated. It includes areas such as expanding services, platform advancement, hiring professionals and others.Find a pre-designed and impeccable Allocation Of Funds Maternity Support Platform Pitch Deck. The templates can ace your presentation without additional effort. You can download these easy-to-edit presentation templates to make your presentation stand out from others. So, what are you waiting for Download the template from Slidegeeks today and give a unique touch to your presentation. This slide presents stacked bar chart highlights areas where raised funds will be allocated. It includes areas such as expanding services, platform advancement, hiring professionals and others.
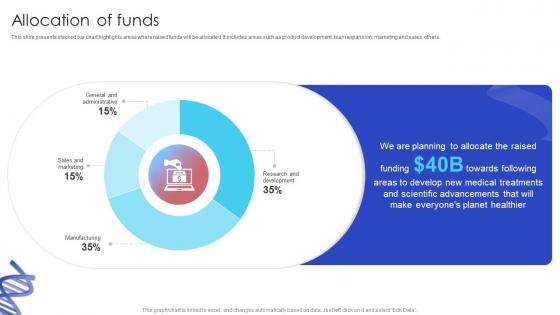
Allocation Of Funds Biotech Firm Pitch Deck
This slide presents stacked bar chart highlights areas where raised funds will be allocated. It includes areas such as product development, team expansion, marketing and sales, others. Find a pre-designed and impeccable Allocation Of Funds Biotech Firm Pitch Deck. The templates can ace your presentation without additional effort. You can download these easy-to-edit presentation templates to make your presentation stand out from others. So, what are you waiting for Download the template from Slidegeeks today and give a unique touch to your presentation. This slide presents stacked bar chart highlights areas where raised funds will be allocated. It includes areas such as product development, team expansion, marketing and sales, others.
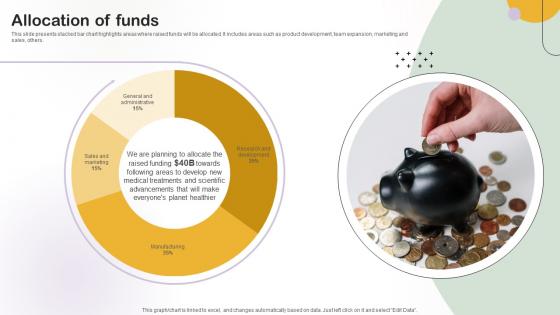
Allocation Of Funds Medical Research Organization Pitch Deck
This slide presents stacked bar chart highlights areas where raised funds will be allocated. It includes areas such as product development, team expansion, marketing and sales, others.Find a pre-designed and impeccable Allocation Of Funds Medical Research Organization Pitch Deck. The templates can ace your presentation without additional effort. You can download these easy-to-edit presentation templates to make your presentation stand out from others. So, what are you waiting for Download the template from Slidegeeks today and give a unique touch to your presentation. This slide presents stacked bar chart highlights areas where raised funds will be allocated. It includes areas such as product development, team expansion, marketing and sales, others.
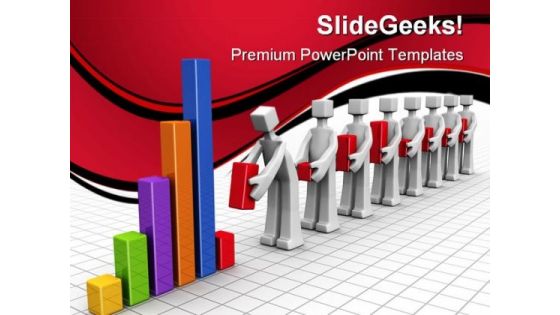
Teamwork Concept Business PowerPoint Themes And PowerPoint Slides 0511
Microsoft PowerPoint Theme and Slide with business team adding individual performance bar chart to annual financial chart Let our Teamwork Concept Business PowerPoint Themes And PowerPoint Slides 0511 rub off on your thoughts. They will get a dose of the X-factor.
Rescue Statistics Business PowerPoint Presentation Slides F
Microsoft PowerPoint Templates and Backgrounds with a multi segment colorful bar chart placed inside of a large red and white lifesaver on a reflective surface See your plans begin to crystallize. Our Rescue Statistics Business PowerPoint Presentation Slides F make it feasible.
Rescue Statistics Business PowerPoint Presentation Slides C
Microsoft PowerPoint Templates and Backgrounds with a multi segment colorful bar chart placed inside of a large red and white lifesaver on a reflective surface Address them in your charismatic style. Boost your aura with our Rescue Statistics Business PowerPoint Presentation Slides C.
Rescue Statistics Business PowerPoint Presentation Slides Cc
Microsoft PowerPoint Templates and Backgrounds with a multi segment colorful bar chart placed inside of a large red and white lifesaver on a reflective surface Experience bliss with our Rescue Statistics Business PowerPoint Presentation Slides Cc. They bring pure comfort with them.
Rescue Statistics Business PowerPoint Presentation Slides R
Microsoft PowerPoint Templates and Backgrounds with a multi segment colorful bar chart placed inside of a large red and white lifesaver on a reflective surface Spice up the discourse with our Rescue Statistics Business PowerPoint Presentation Slides R. Strengthen the flavour of your thoughts.
Rescue Statistics Business PowerPoint Presentation Slides S
Microsoft PowerPoint Templates and Backgrounds with a multi segment colorful bar chart placed inside of a large red and white lifesaver on a reflective surface Entice them with our Rescue Statistics Business PowerPoint Presentation Slides S. Lure them with your thoughts.
Rescue Statistics PowerPoint Icon C
3d illustration of a multi-segment colorful bar chart placed inside of a large red and white lifesaver on a reflective surface Be the early bird with our Rescue Statistics PowerPoint Icon C. Be the first on the block with your thoughts.
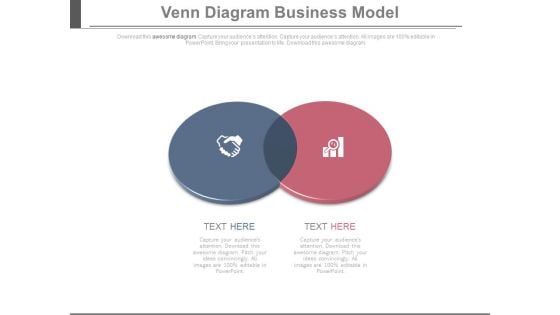
Venn Diagram For Business Deal And Analysis Powerpoint Slides
This power point template contains graphic of two circles with handshake and bar chart icons. Use this Venn diagram for business deal planning and strategy analysis. Illustrate your ideas and imprint them in the minds of your team with this template.
Rescue Statistics PowerPoint Icon Cc
3d illustration of a multi-segment colorful bar chart placed inside of a large red and white lifesaver on a reflective surface Get the nod for your plans with our Rescue Statistics PowerPoint Icon Cc. You will be at the top of your game.

Credit Card Statistics Business PowerPoint Themes And PowerPoint Slides 0811
Microsoft PowerPoint Theme and Slide with f a multi scolored multi segment bar chart placed on top of a silver credit card over a gray reflective surface Our Credit Card Statistics Business PowerPoint Themes And PowerPoint Slides 0811 will follow your bent of mind. They adapt to the contours of your thought process.
E Book Data PowerPoint Icon Cc
Microsoft PowerPoint Template and Background with of a multi colored bar chart sitting on top of a silver digital book reader on a dark reflective surface Our E Book Data PowerPoint Icon Cc will keep the faith. They will show allegiance to your thoughts.
E Book Data PowerPoint Icon F
Microsoft PowerPoint Template and Background with of a multi colored bar chart sitting on top of a silver digital book reader on a dark reflective surface Estabish the key factors of your scheme. Explain the crucial elements with our E Book Data PowerPoint Icon F.
E Book Data PowerPoint Icon R
Microsoft PowerPoint Template and Background with of a multi colored bar chart sitting on top of a silver digital book reader on a dark reflective surface Project your exercise regimen on our E Book Data PowerPoint Icon R. Elaborate on the benefits of each set.
E Book Data PowerPoint Icon C
Microsoft PowerPoint Template and Background with of a multi colored bar chart sitting on top of a silver digital book reader on a dark reflective surface Our E Book Data PowerPoint Icon C have a glossy look. Your thoughts will also acquire a sheen.
E Book Data PowerPoint Icon S
Microsoft PowerPoint Template and Background with of a multi colored bar chart sitting on top of a silver digital book reader on a dark reflective surface Our E Book Data PowerPoint Icon S will elevate the experience. Lift your thoughts to a higher plane.

New Year Business Fortune Shapes PowerPoint Backgrounds And Templates 1210
Microsoft PowerPoint Template and Background with Two fortune cookies on a red background Business prospects improve in the New Year along with a bar chart showing a positive trend Impress your organization with our New Year Business Fortune Shapes PowerPoint Backgrounds And Templates 1210. Make sure your presentation gets the attention it deserves.
Refreshing Statistics Business PowerPoint Backgrounds And Templates 1210
Microsoft PowerPoint Template and Background with 3d illustration of a large metallic circular arrow placed around the bottom of a multi color bar chart over a dark gray reflective surface Employ creativity with our Refreshing Statistics Business PowerPoint Backgrounds And Templates 1210. You will come out on top.
E Book Data Business PowerPoint Templates And PowerPoint Backgrounds 0311
Microsoft PowerPoint Template and Background with a multi colored bar chart sitting on top of a silver digital book reader However faint their hopes may be. Buck them up with our E Book Data Business PowerPoint Templates And PowerPoint Backgrounds 0311.

Success Industrial PowerPoint Templates And PowerPoint Backgrounds 0511
Microsoft PowerPoint Template and Background with 3d illustration of a multi colored bar chart inside the center opening of a large gear Feather your nest with our Success Industrial PowerPoint Templates And PowerPoint Backgrounds 0511. Your thoughts will evolve in a comfortable climate.
Credit Card Statistics Business PowerPoint Templates And PowerPoint Backgrounds 0811
Microsoft PowerPoint Template and Background with f a multi scolored multi segment bar chart placed on top of a silver credit card over a gray reflective surface Your thoughts will be engraved in the minds of your audience. Our Credit Card Statistics Business PowerPoint Templates And PowerPoint Backgrounds 0811 will etch them in.
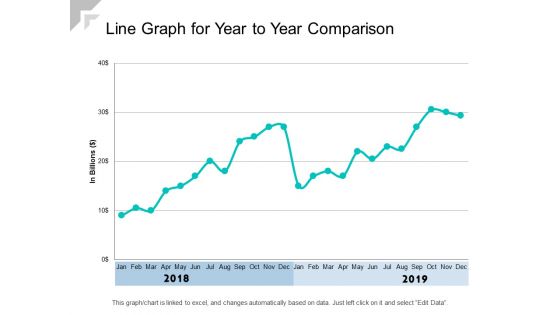
Line Graph For Year To Year Comparison Ppt PowerPoint Presentation Show Graphics Example
Presenting this set of slides with name line graph for year to year comparison ppt powerpoint presentation show graphics example. The topics discussed in these slides are revenue trend, bar chart, financial. This is a completely editable PowerPoint presentation and is available for immediate download. Download now and impress your audience.
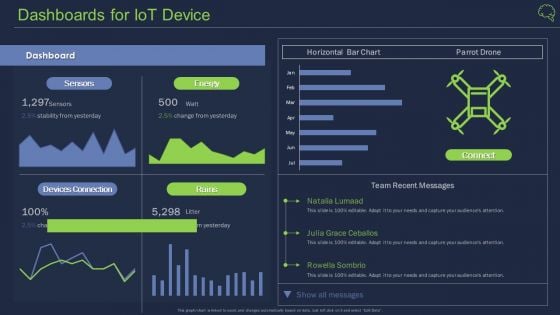
Intelligent Architecture Dashboards For Iot Device Ppt Template PDF
Deliver and pitch your topic in the best possible manner with this intelligent architecture dashboards for iot device ppt template pdf. Use them to share invaluable insights on dashboard, horizontal bar chart, team and impress your audience. This template can be altered and modified as per your expectations. So, grab it now.
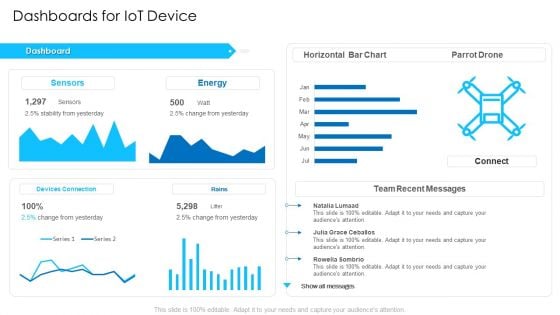
Dashboards For Iot Device Summary PDF
Deliver and pitch your topic in the best possible manner with this dashboards for iot device summary pdf. Use them to share invaluable insights on horizontal bar chart, parrot drone, team recent messages and impress your audience. This template can be altered and modified as per your expectations. So, grab it now.
Age Wise Service Subscription Statistics Ppt PowerPoint Presentation Icon Brochure PDF
Presenting this set of slides with name age wise service subscription statistics ppt powerpoint presentation icon brochure pdf. The topics discussed in these slide is age wise website users are shown on bar chart. This is a completely editable PowerPoint presentation and is available for immediate download. Download now and impress your audience.
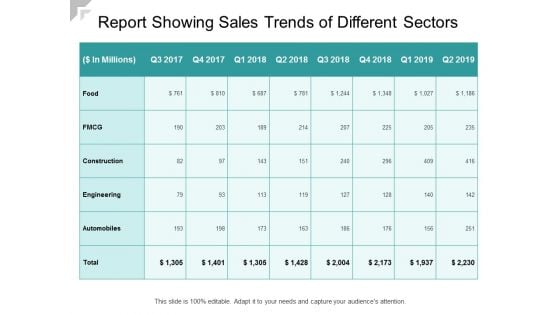
Report Showing Sales Trends Of Different Sectors Ppt PowerPoint Presentation Professional Examples
Presenting this set of slides with name report showing sales trends of different sectors ppt powerpoint presentation professional examples. The topics discussed in these slides are revenue trend, bar chart, financial. This is a completely editable PowerPoint presentation and is available for immediate download. Download now and impress your audience.
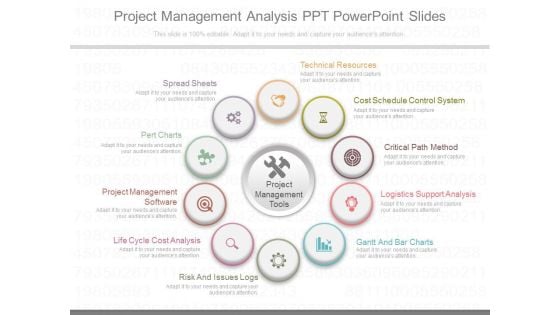
Project Management Analysis Ppt Powerpoint Slides
This is a project management analysis ppt powerpoint slides. This is a ten stage process. The stages in this process are technical resources, cost schedule control system, critical path method, logistics support analysis, gantt and bar charts, risk and issues logs, life cycle cost analysis, project management software, pert charts, spread sheets.
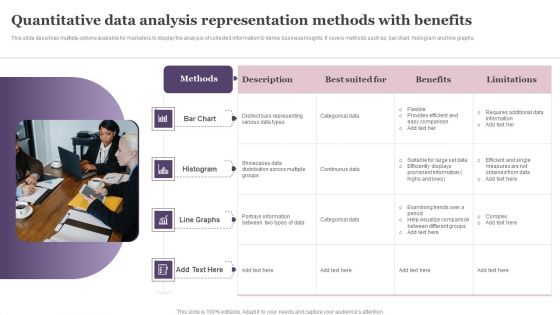
Quantitative Data Analysis Representation Methods With Benefits Template PDF
This slide describes multiple options available for marketers to display the analysis of collected information to derive business insights. It covers methods such as, bar chart, histogram and line graphs. Persuade your audience using this Quantitative Data Analysis Representation Methods With Benefits Template PDF. This PPT design covers four stages, thus making it a great tool to use. It also caters to a variety of topics including Bar Chart, Histogram, Line Graphs. Download this PPT design now to present a convincing pitch that not only emphasizes the topic but also showcases your presentation skills.
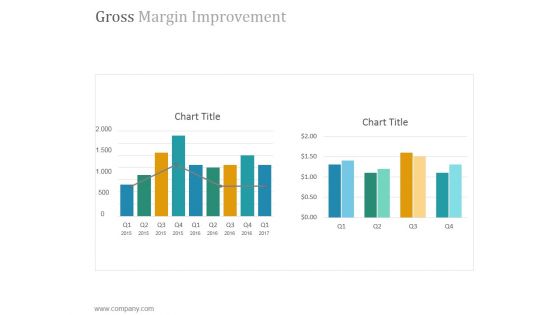
Gross Margin Improvement Ppt PowerPoint Presentation Layout
This is a gross margin improvement ppt powerpoint presentation layout. This is a two stage process. The stages in this process are chart, bar graph, success, growth, marketing.
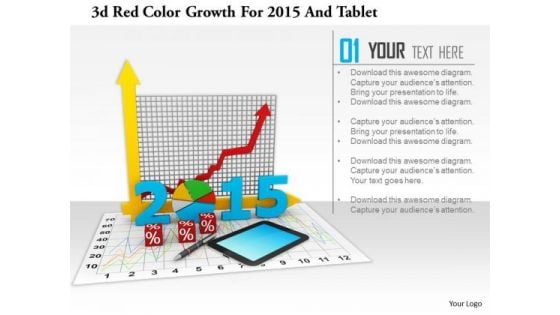
Stock Photo 3d Red Color Growth For 2015 And Tablet PowerPoint Slide
This image slide has graphics of financial charts and reports. This contains bar graph and pie chart to present business reports. Build an innovative presentation using this professional image slide.
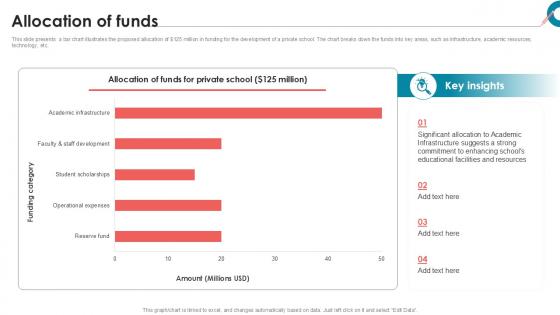
Allocation Of Funds Private School Investor Funding Elevator Pitch Deck PPT Slides
This slide presents a bar chart illustrates the proposed allocation of dollar 125 million in funding for the development of a private school. The chart breaks down the funds into key areas, such as infrastructure, academic resources, technology, etc. Find a pre designed and impeccable Allocation Of Funds Private School Investor Funding Elevator Pitch Deck PPT Slides. The templates can ace your presentation without additional effort. You can download these easy to edit presentation templates to make your presentation stand out from others. So, what are you waiting for Download the template from Slidegeeks today and give a unique touch to your presentation. This slide presents a bar chart illustrates the proposed allocation of dollar 125 million in funding for the development of a private school. The chart breaks down the funds into key areas, such as infrastructure, academic resources, technology, etc.
Standard Icon Business Benchmarking Gear Ppt PowerPoint Presentation Complete Deck
Presenting this set of slides with name standard icon business benchmarking gear ppt powerpoint presentation complete deck. The topics discussed in these slides are bar chart, business benchmarking, gear, financial, seo performance. This is a completely editable PowerPoint presentation and is available for immediate download. Download now and impress your audience.
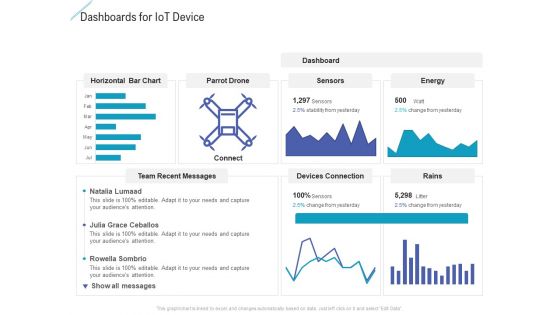
Dashboards For Iot Device Portrait PDF
Deliver an awe inspiring pitch with this creative dashboards for iot device portrait pdf bundle. Topics like horizontal bar chart, parrot drone, sensors, energy, dashboard can be discussed with this completely editable template. It is available for immediate download depending on the needs and requirements of the user.
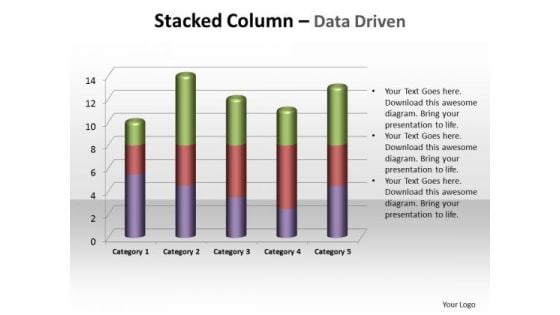
Business Company PowerPoint Templates Business Stacked Column Ppt Slides
Business Company PowerPoint Templates Business stacked column PPT Slides-This PowerPoint slide has a stacked bar chart that looks elegant because of its shape and the unique angle in which it appears. you can easily edit the size, position and text and change the colors. . -Business Company PowerPoint Templates Business stacked column PPT Slides-This ppt can be used for concepts relating to-, Area, Bar, Block, Business, Chart, Color, Colour, Column, Cone, Decline, Fill, Finance, Financial, Gradient, Graph, etc Our Business Company PowerPoint Templates Business Stacked Column Ppt Slides are exemplary contributors. They go all out to achieve the common goal.
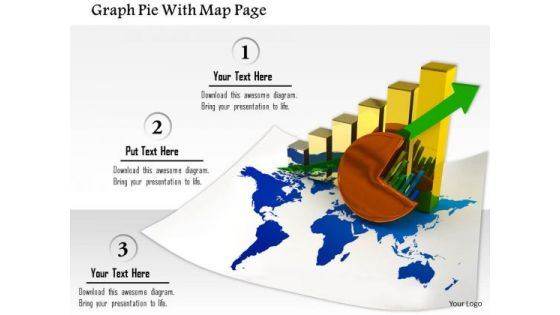
Stock Photo Graph Pie With Map Page PowerPoint Slide
This image slide contains business charts on world map. This image is designed with bar graph and pie chart on world map depicting global economy. Use this image slide to represent financial growth in any business presentation.
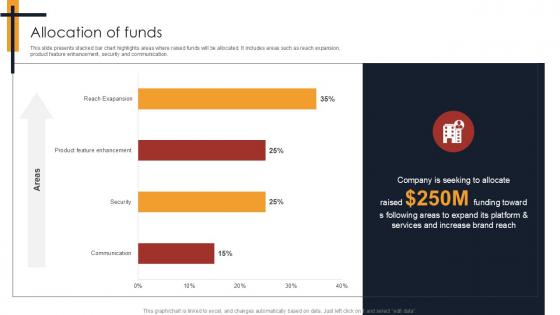
Allocation Of Funds Writing Enhancement Software Pitch Deck PPT Template
This slide presents stacked bar chart highlights areas where raised funds will be allocated. It includes areas such as reach expansion, product feature enhancement, security and communication. The Allocation Of Funds Writing Enhancement Software Pitch Deck PPT Template is a compilation of the most recent design trends as a series of slides. It is suitable for any subject or industry presentation, containing attractive visuals and photo spots for businesses to clearly express their messages. This template contains a variety of slides for the user to input data, such as structures to contrast two elements, bullet points, and slides for written information. Slidegeeks is prepared to create an impression. This slide presents stacked bar chart highlights areas where raised funds will be allocated.It includes areas such as reach expansion, product feature enhancement, security and communication.
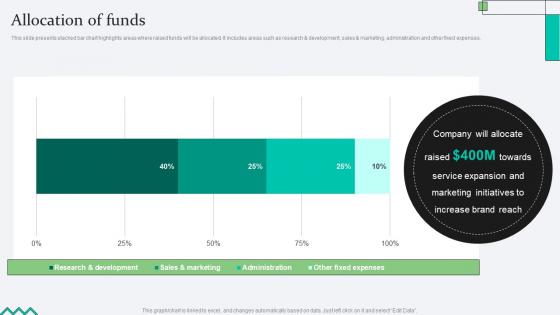
Allocation Of Funds Biopharma Research Organization Pitch Deck
This slide presents stacked bar chart highlights areas where raised funds will be allocated. It includes areas such as research and development, sales and marketing, administration and other fixed expenses. Find a pre-designed and impeccable Allocation Of Funds Biopharma Research Organization Pitch Deck. The templates can ace your presentation without additional effort. You can download these easy-to-edit presentation templates to make your presentation stand out from others. So, what are you waiting for Download the template from Slidegeeks today and give a unique touch to your presentation. This slide presents stacked bar chart highlights areas where raised funds will be allocated. It includes areas such as research and development, sales and marketing, administration and other fixed expenses.
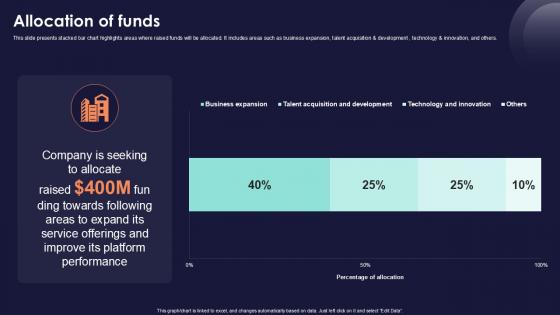
Allocation Of Funds Online Financial Services Platform Ppt Example
This slide presents stacked bar chart highlights areas where raised funds will be allocated. It includes areas such as business expansion, talent acquisition and development , technology and innovation, and others. Find a pre-designed and impeccable Allocation Of Funds Online Financial Services Platform Ppt Example. The templates can ace your presentation without additional effort. You can download these easy-to-edit presentation templates to make your presentation stand out from others. So, what are you waiting for Download the template from Slidegeeks today and give a unique touch to your presentation. This slide presents stacked bar chart highlights areas where raised funds will be allocated. It includes areas such as business expansion, talent acquisition and development , technology and innovation, and others.
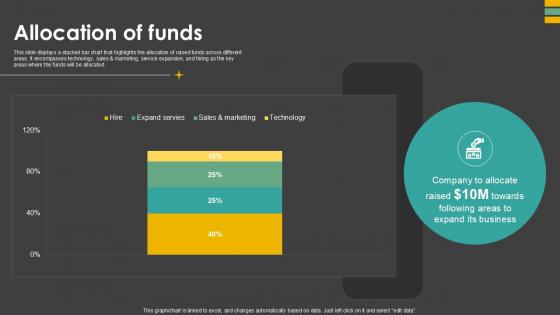
Allocation Of Funds Waste Control Platform Pitch Deck Ppt Slides
This slide displays a stacked bar chart that highlights the allocation of raised funds across different areas. It encompasses technology, sales and marketing, service expansion, and hiring as the key areas where the funds will be allocated. Boost your pitch with our creative Allocation Of Funds Waste Control Platform Pitch Deck Ppt Slides. Deliver an awe-inspiring pitch that will mesmerize everyone. Using these presentation templates you will surely catch everyones attention. You can browse the ppts collection on our website. We have researchers who are experts at creating the right content for the templates. So you do not have to invest time in any additional work. Just grab the template now and use them. This slide displays a stacked bar chart that highlights the allocation of raised funds across different areas. It encompasses technology, sales and marketing, service expansion, and hiring as the key areas where the funds will be allocated.
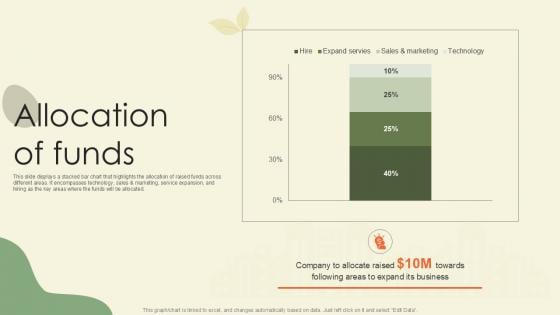
Allocation Of Funds Waste Disposal Platform Pitch Deck Ppt Slides
This slide displays a stacked bar chart that highlights the allocation of raised funds across different areas. It encompasses technology, sales and marketing, service expansion, and hiring as the key areas where the funds will be allocated. Find a pre-designed and impeccable Allocation Of Funds Waste Disposal Platform Pitch Deck Ppt Slides. The templates can ace your presentation without additional effort. You can download these easy-to-edit presentation templates to make your presentation stand out from others. So, what are you waiting for Download the template from Slidegeeks today and give a unique touch to your presentation. This slide displays a stacked bar chart that highlights the allocation of raised funds across different areas. It encompasses technology, sales and marketing, service expansion, and hiring as the key areas where the funds will be allocated.
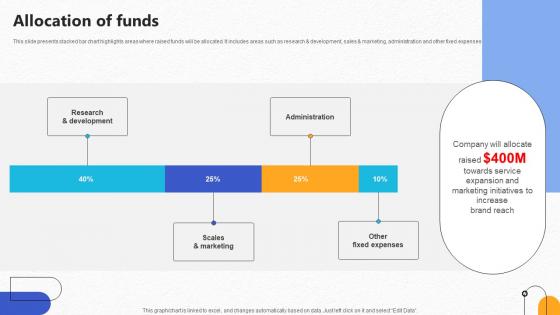
Allocation Of Funds Pharmaceutical R And D Company Pitch Deck
This slide presents stacked bar chart highlights areas where raised funds will be allocated. It includes areas such as research and development, sales and marketing, administration and other fixed expenses. Find a pre-designed and impeccable Allocation Of Funds Pharmaceutical R And D Company Pitch Deck. The templates can ace your presentation without additional effort. You can download these easy-to-edit presentation templates to make your presentation stand out from others. So, what are you waiting for Download the template from Slidegeeks today and give a unique touch to your presentation. This slide presents stacked bar chart highlights areas where raised funds will be allocated. It includes areas such as research and development, sales and marketing, administration and other fixed expenses.
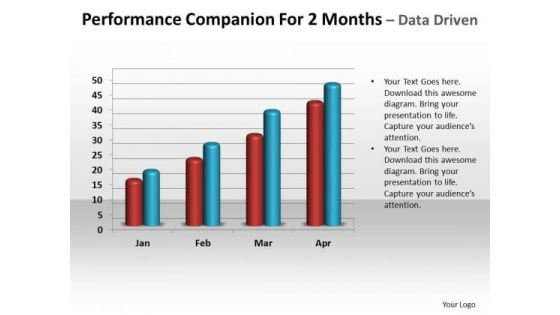
Buinsess Marketing PowerPoint Templates Business Performance Companion For 2 Month Ppt Slides
Business Marketing PowerPoint Template business performance companion for 2 months PPT slide-This PowerPoint Template shows bar chart analysing performance of 2 months of the company. Business Marketing PowerPoint Template business performance companion for 2 months PPT slide-This ppt can be used for concepts relating to-investment, finance, business, Comparison, performance etc. There is nothing cryptic about our Buinsess Marketing PowerPoint Templates Business Performance Companion For 2 Month Ppt Slides. They are quite easy to decipher.

Financial Report Business PowerPoint Templates And PowerPoint Backgrounds 0511
Microsoft PowerPoint Template and Background with arrow pointing to the higher financial chart bar Engage the audience with your thoughts. Our Financial Report Business PowerPoint Templates And PowerPoint Backgrounds 0511 will keep them engrossed.
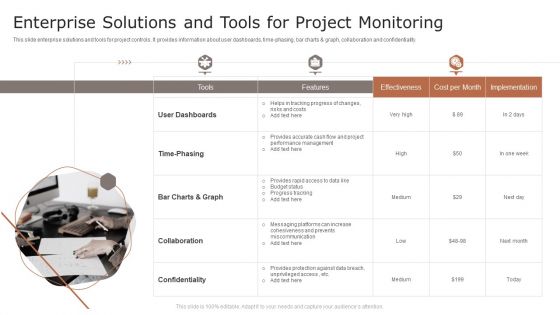
Enterprise Solutions And Tools For Project Monitoring Ppt Model Examples PDF
This slide enterprise solutions and tools for project controls. It provides information about user dashboards, time-phasing, bar charts and graph, collaboration and confidentiality. Presenting Enterprise Solutions And Tools For Project Monitoring Ppt Model Examples PDF to dispense important information. This template comprises three stages. It also presents valuable insights into the topics including User Dashboards, Time Phasing, Collaboration. This is a completely customizable PowerPoint theme that can be put to use immediately. So, download it and address the topic impactfully.
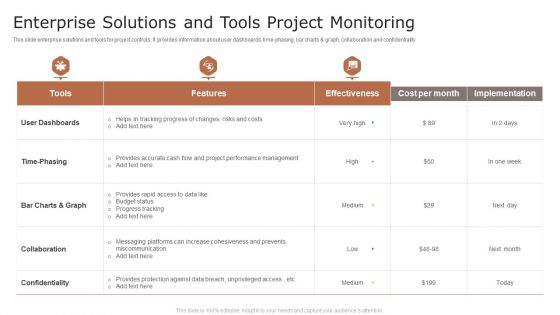
Enterprise Solutions And Tools Project Monitoring Ppt File Visuals PDF
This slide enterprise solutions and tools for project controls. It provides information about user dashboards, time-phasing, bar charts and graph, collaboration and confidentiality. Pitch your topic with ease and precision using this Enterprise Solutions And Tools Project Monitoring Ppt File Visuals PDF. This layout presents information on User Dashboards, Time Phasing, Collaboration. It is also available for immediate download and adjustment. So, changes can be made in the color, design, graphics or any other component to create a unique layout.
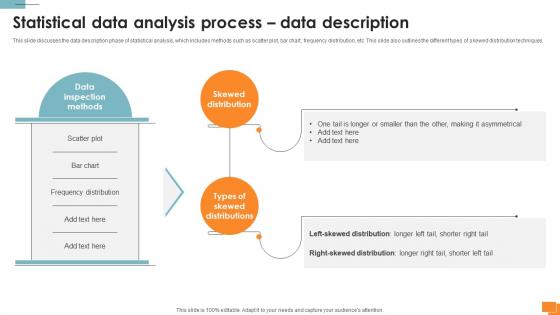
Statistical Tools For Evidence Statistical Data Analysis Process Data Description
This slide discusses the data description phase of statistical analysis, which includes methods such as scatter plot, bar chart, frequency distribution, etc. This slide also outlines the different types of skewed distribution techniques. Do you have to make sure that everyone on your team knows about any specific topic I yes, then you should give Statistical Tools For Evidence Statistical Data Analysis Process Data Description a try. Our experts have put a lot of knowledge and effort into creating this impeccable Statistical Tools For Evidence Statistical Data Analysis Process Data Description. You can use this template for your upcoming presentations, as the slides are perfect to represent even the tiniest detail. You can download these templates from the Slidegeeks website and these are easy to edit. So grab these today This slide discusses the data description phase of statistical analysis, which includes methods such as scatter plot, bar chart, frequency distribution, etc. This slide also outlines the different types of skewed distribution techniques.
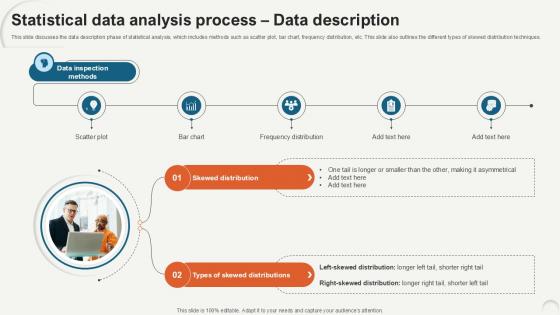
Statistical Data Analysis Process Data Description Ppt Example
This slide discusses the data description phase of statistical analysis, which includes methods such as scatter plot, bar chart, frequency distribution, etc. This slide also outlines the different types of skewed distribution techniques. Create an editable Statistical Data Analysis Process Data Description Ppt Example that communicates your idea and engages your audience. Whether you are presenting a business or an educational presentation, pre-designed presentation templates help save time. Statistical Data Analysis Process Data Description Ppt Example is highly customizable and very easy to edit, covering many different styles from creative to business presentations. Slidegeeks has creative team members who have crafted amazing templates. So, go and get them without any delay. This slide discusses the data description phase of statistical analysis, which includes methods such as scatter plot, bar chart, frequency distribution, etc. This slide also outlines the different types of skewed distribution techniques.
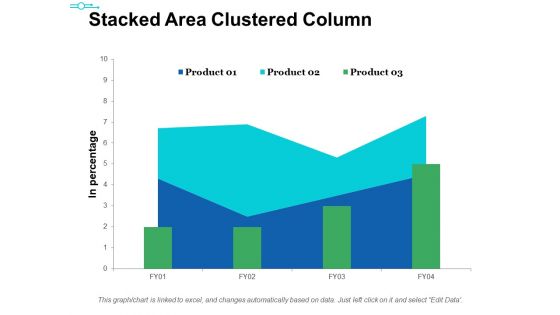
Stacked Area Clustered Column Ppt PowerPoint Presentation Ideas Themes
This is a stacked area clustered column ppt powerpoint presentation ideas themes. This is a three stage process. The stages in this process are product, in percentage, bar graph, area chart, growth.
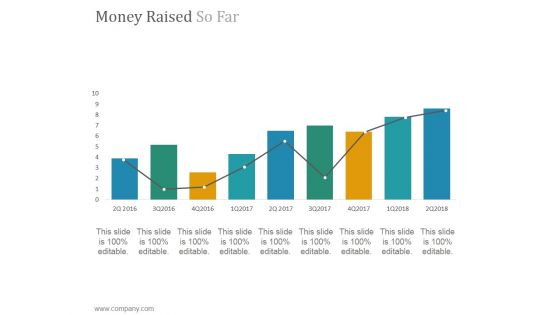
Money Raised So Far Ppt PowerPoint Presentation Layout
This is a money raised so far ppt powerpoint presentation layout. This is a nine stage process. The stages in this process are chart, bar graph, success, growth, marketing.


 Continue with Email

 Home
Home


