Bar Graph
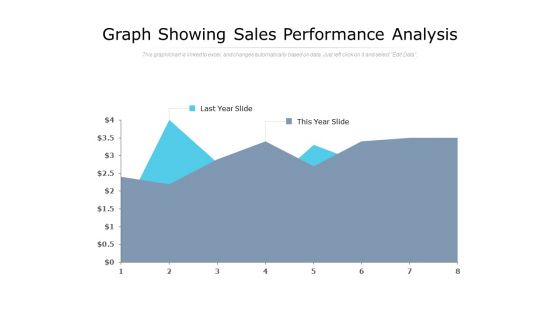
Graph Showing Sales Performance Analysis Ppt PowerPoint Presentation Professional Information
Presenting this set of slides with name graph showing sales performance analysis ppt powerpoint presentation professional information. The topics discussed in these slide is graph showing sales performance analysis. This is a completely editable PowerPoint presentation and is available for immediate download. Download now and impress your audience.
Product Percentage Change Graph Ppt PowerPoint Presentation Styles Icons PDF
Presenting this set of slides with name product percentage change graph ppt powerpoint presentation styles icons pdf. The topics discussed in these slide is product percentage change graph. This is a completely editable PowerPoint presentation and is available for immediate download. Download now and impress your audience.
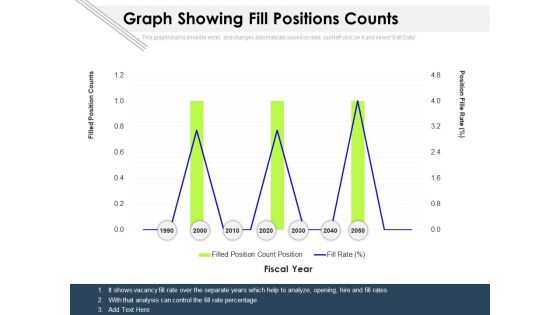
Graph Showing Fill Positions Counts Ppt PowerPoint Presentation Sample PDF
Presenting this set of slides with name graph showing fill positions counts ppt powerpoint presentation sample pdf. The topics discussed in these slide is graph showing fill positions counts. This is a completely editable PowerPoint presentation and is available for immediate download. Download now and impress your audience.
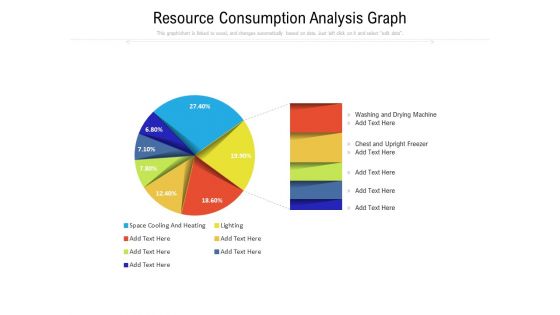
Resource Consumption Analysis Graph Ppt PowerPoint Presentation Gallery Smartart PDF
Presenting this set of slides with name resource consumption analysis graph ppt powerpoint presentation gallery smartart pdf. The topics discussed in these slide is resource consumption analysis graph. This is a completely editable PowerPoint presentation and is available for immediate download. Download now and impress your audience.
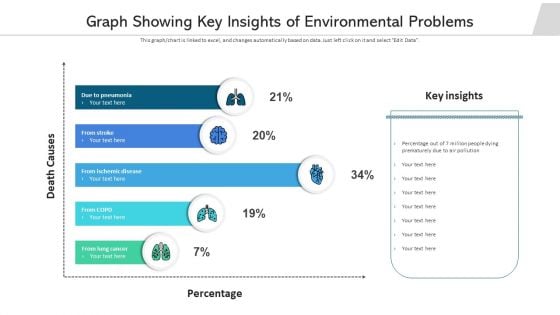
Graph Showing Key Insights Of Environmental Problems Structure PDF
Pitch your topic with ease and precision using this graph showing key insights of environmental problems structure pdf. This layout presents information on graph showing key insights of environmental problems. It is also available for immediate download and adjustment. So, changes can be made in the color, design, graphics or any other component to create a unique layout.
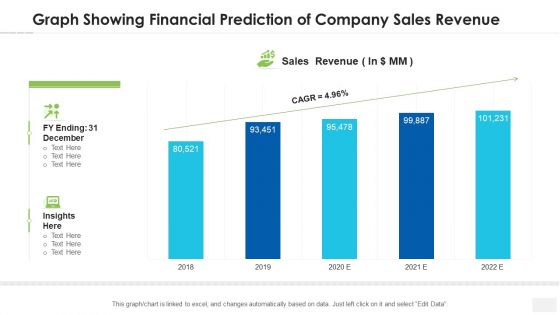
Graph Showing Financial Prediction Of Company Sales Revenue Topics PDF
Pitch your topic with ease and precision using this graph showing financial prediction of company sales revenue topics pdf. This layout presents information on graph showing financial prediction of company sales revenue. It is also available for immediate download and adjustment. So, changes can be made in the color, design, graphics or any other component to create a unique layout.
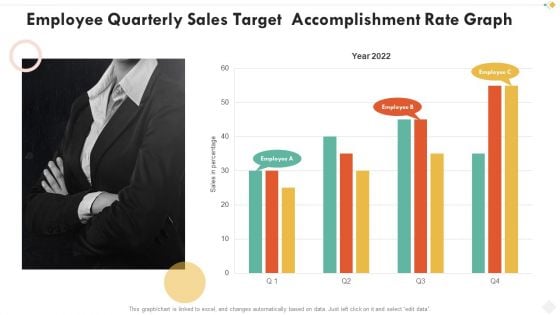
Employee Quarterly Sales Target Accomplishment Rate Graph Demonstration PDF
Pitch your topic with ease and precision using this employee quarterly sales target accomplishment rate graph demonstration pdf. This layout presents information on employee quarterly sales target accomplishment rate graph. It is also available for immediate download and adjustment. So, changes can be made in the color, design, graphics or any other component to create a unique layout.
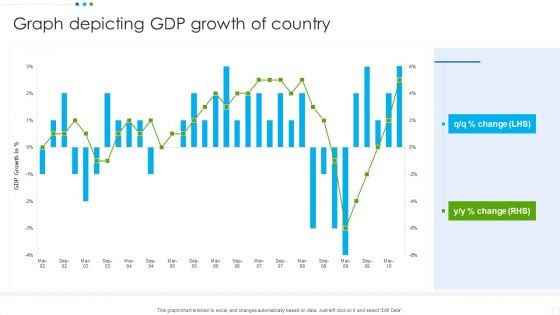
Graph Depicting Gdp Growth Of Country Background PDF
Pitch your topic with ease and precision using this Graph Depicting Gdp Growth Of Country Background PDF. This layout presents information on Graph Depicting, Growth Of Country. It is also available for immediate download and adjustment. So, changes can be made in the color, design, graphics or any other component to create a unique layout.
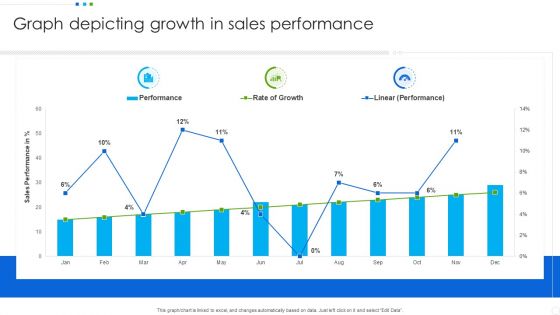
Graph Depicting Growth In Sales Performance Professional PDF
Pitch your topic with ease and precision using this Graph Depicting Growth In Sales Performance Professional PDF. This layout presents information on Graph Depicting, Sales Performance. It is also available for immediate download and adjustment. So, changes can be made in the color, design, graphics or any other component to create a unique layout.
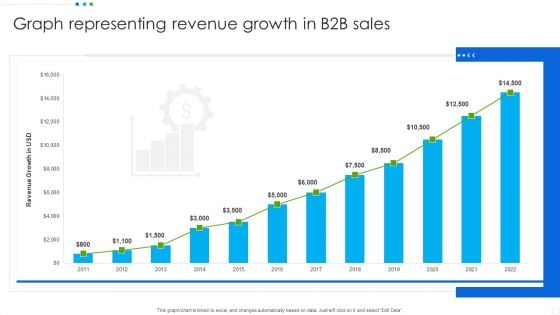
Graph Representing Revenue Growth In B2b Sales Background PDF
Pitch your topic with ease and precision using this Graph Representing Revenue Growth In B2b Sales Background PDF. This layout presents information on Graph Representing, Revenue Growth, Sales. It is also available for immediate download and adjustment. So, changes can be made in the color, design, graphics or any other component to create a unique layout.
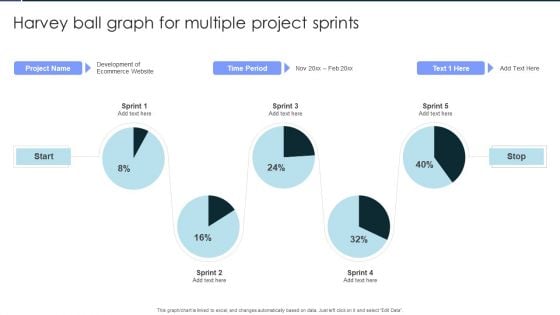
Harvey Ball Graph For Multiple Project Sprints Background PDF
Pitch your topic with ease and precision using this Harvey Ball Graph For Multiple Project Sprints Background PDF. This layout presents information on Harvey Ball Graph, For Multiple, Project Sprints. It is also available for immediate download and adjustment. So, changes can be made in the color, design, graphics or any other component to create a unique layout.
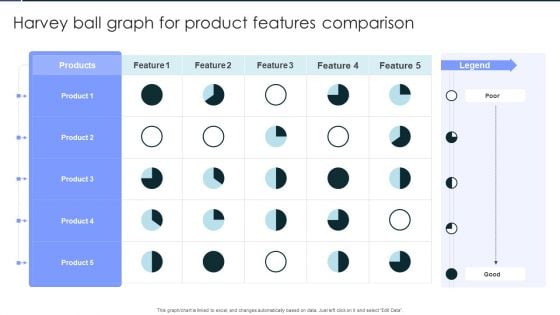
Harvey Ball Graph For Product Features Comparison Rules PDF
Pitch your topic with ease and precision using this Harvey Ball Graph For Product Features Comparison Rules PDF. This layout presents information onHarvey Ball Graph, For Product, Features Comparison. It is also available for immediate download and adjustment. So, changes can be made in the color, design, graphics or any other component to create a unique layout.
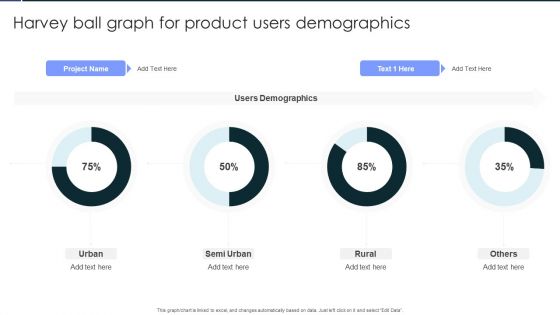
Harvey Ball Graph For Product Users Demographics Portrait PDF
Pitch your topic with ease and precision using this Harvey Ball Graph For Product Users Demographics Portrait PDF. This layout presents information on Harvey Ball Graph, For Product, Users Demographics. It is also available for immediate download and adjustment. So, changes can be made in the color, design, graphics or any other component to create a unique layout.
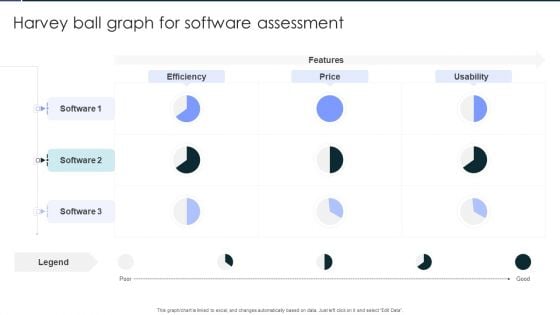
Harvey Ball Graph For Software Assessment Clipart PDF
Pitch your topic with ease and precision using this Harvey Ball Graph For Software Assessment Clipart PDF. This layout presents information on Harvey Ball Graph, For Software, Assessment. It is also available for immediate download and adjustment. So, changes can be made in the color, design, graphics or any other component to create a unique layout.
Graph Marketing PowerPoint Templates And PowerPoint Themes 1012
Graph Marketing PowerPoint Templates And PowerPoint Themes 1012-Microsoft Powerpoint Templates and Background with graph marketing-Graph Marketing PowerPoint Templates And PowerPoint Themes 1012-This PowerPoint template can be used for presentations relating to-Graph marketing, business, finance, globe, marketing, success Launch your campaign with our Graph Marketing PowerPoint Templates And PowerPoint Themes 1012. Make sure your presentation gets the attention it deserves.
Colorful Graph Money Business PowerPoint Templates And PowerPoint Themes 0512
Microsoft Powerpoint Templates and Background with color graph-These templates can be used for presentations relating to-Color graph, business, shapes, success, finance, sales-Colorful Graph Money Business PowerPoint Templates And PowerPoint Themes 0512 Regain control with our Colorful Graph Money Business PowerPoint Templates And PowerPoint Themes 0512. Download without worries with our money back guaranteee.
Colorful Graph Profit Money PowerPoint Templates And PowerPoint Themes 0512
Microsoft Powerpoint Templates and Background with color graph-These templates can be used for presentations relating to-Color graph, business, shapes, success, finance, sales-Colorful Graph Profit Money PowerPoint Templates And PowerPoint Themes 0512 Facilitate change with our Colorful Graph Profit Money PowerPoint Templates And PowerPoint Themes 0512. Gain audience acceptance faster.
Colorful Graph Success PowerPoint Templates And PowerPoint Themes 0512
Microsoft Powerpoint Templates and Background with color graph-These templates can be used for presentations relating to-Color graph, business, shapes, success, finance, sales-Colorful Graph Success PowerPoint Templates And PowerPoint Themes 0512 Get endorsed by your boss with our Colorful Graph Success PowerPoint Templates And PowerPoint Themes 0512. Dont pass up this opportunity to shine.

Dollar And Graph Business PowerPoint Templates And PowerPoint Themes 0512
Microsoft Powerpoint Templates and Background with business graph-These templates can be used for presentations relating to-Business graph, finance, money, success, shapes, arrows-Dollar and Graph Business PowerPoint Templates And PowerPoint Themes 0512 Enhance connectivity with our Dollar And Graph Business PowerPoint Templates And PowerPoint Themes 0512. They will always keep you in touch.
Profit Graph Success PowerPoint Templates And PowerPoint Themes 0512
Microsoft Powerpoint Templates and Background with business graph with arrow -These templates can be used for presentations relating to-Business graph with arrow, finance, background, arrows, success, business -Profit Graph Success PowerPoint Templates And PowerPoint Themes 0512 Doubts will disappear with our Profit Graph Success PowerPoint Templates And PowerPoint Themes 0512. You will come out on top.
Pie Graph Business PowerPoint Templates And PowerPoint Themes 0512
Microsoft Powerpoint Templates and Background with pie graph-Pie Graph Business PowerPoint Templates And PowerPoint Themes 0512-These PowerPoint designs and slide layouts can be used for themes relating to -Pie graph, background, business, marketing, sales, success Attain success with our Pie Graph Business PowerPoint Templates And PowerPoint Themes 0512. You will come out on top.
Business Graph Finance PowerPoint Templates And PowerPoint Themes 0912
Business Graph Finance PowerPoint Templates And PowerPoint Themes 0912-Microsoft Powerpoint Templates and Background with business graph with arrow-Business graph with arrow, finance, success, arrows, business, marketing Our Business Graph Finance PowerPoint Templates And PowerPoint Themes 0912 help explicit expression. Your thoughts will get across clearly and fully.
Growing Career Graph Future PowerPoint Templates And PowerPoint Themes 0912
Growing Career Graph Future PowerPoint Templates And PowerPoint Themes 0912-Microsoft Powerpoint Templates and Background with growing career graph-Growing career graph, business, success, future, ladders, cubes Get guaranteed success with our Growing Career Graph Future PowerPoint Templates And PowerPoint Themes 0912. Dont waste time struggling with PowerPoint. Let us do it for you.
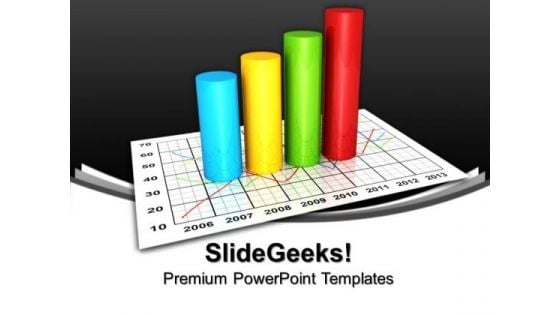
Products Sale Graph Business PowerPoint Templates And PowerPoint Themes 0912
Products Sale Graph Business PowerPoint Templates And PowerPoint Themes 0912-Microsoft Powerpoint Templates and Background with business graph-Business graph, competition, business, finance, sales, Money Your audience deserves the absolute best. Give them better than that with our Products Sale Graph Business PowerPoint Templates And PowerPoint Themes 0912.
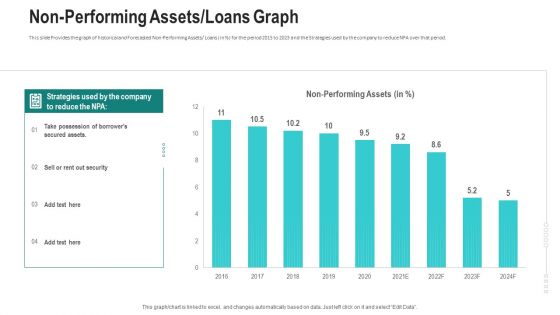
Non Performing Assets Loans Graph Ppt Summary Graphic Tips PDF
This slide Provides the graph of historical and Forecasted Non-Performing Assets or Loans in percent for the period 2015 to 2023 and the Strategies used by the company to reduce NPA over that period. Deliver and pitch your topic in the best possible manner with this non performing assets loans graph ppt summary graphic tips pdf. Use them to share invaluable insights on non performing assets or loans graph and impress your audience. This template can be altered and modified as per your expectations. So, grab it now.
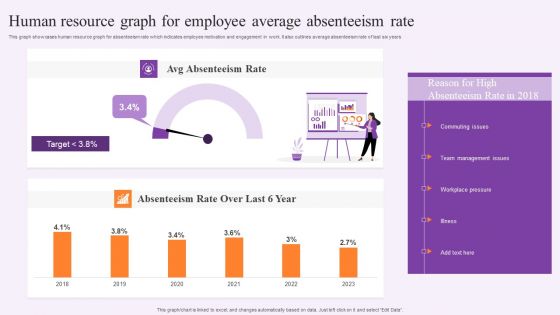
Human Resource Graph For Employee Average Absenteeism Rate Information PDF
This graph showcases human resource graph for absenteeism rate which indicates employee motivation and engagement in work. It also outlines average absenteeism rate of last six years. Showcasing this set of slides titled Human Resource Graph For Employee Average Absenteeism Rate Information PDF. The topics addressed in these templates are Team Management Issues, Workplace Pressure, Absenteeism Rate. All the content presented in this PPT design is completely editable. Download it and make adjustments in color, background, font etc. as per your unique business setting.
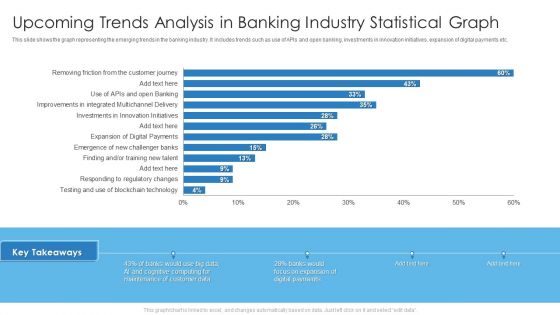
Upcoming Trends Analysis In Banking Industry Statistical Graph Brochure PDF
This slide shows the graph representing the emerging trends in the banking industry. It includes trends such as use of APIs and open banking, investments in innovation initiatives, expansion of digital payments etc. Deliver and pitch your topic in the best possible manner with this Upcoming Trends Analysis In Banking Industry Statistical Graph Brochure PDF. Use them to share invaluable insights on Upcoming Trends Analysis, Banking Industry Statistical Graph and impress your audience. This template can be altered and modified as per your expectations. So, grab it now.
Dollar Graph Up Business PowerPoint Templates And PowerPoint Themes 1012
Dollar Graph Up Business PowerPoint Templates And PowerPoint Themes 1012-Microsoft Powerpoint Templates and Background with dollar graph up-Dollar Graph Up Business PowerPoint Templates And PowerPoint Themes 1012-This PowerPoint template can be used for presentations relating to-Dollar graph up, signs, business, finance, money, success Get noticed immediately with our Dollar Graph Up Business PowerPoint Templates And PowerPoint Themes 1012. Dont waste time struggling with PowerPoint. Let us do it for you.
Dollar Growth Graph Success PowerPoint Templates And PowerPoint Themes 0712
Dollar Growth Graph Success PowerPoint Templates And PowerPoint Themes 0712-Microsoft Powerpoint Templates and Background with dollar growth Clear the blocks for your thoughts. Open up the pipeline with our Dollar Growth Graph Success PowerPoint Templates And PowerPoint Themes 0712.
Lego Profit Graph Business PowerPoint Templates And PowerPoint Themes 0512
Microsoft Powerpoint Templates and Background with Profit Graph made out of lego blocks Our Lego Profit Graph Business PowerPoint Templates And PowerPoint Themes 0512 compare to a classic dessert. Your audience will have their cake and eat it too.
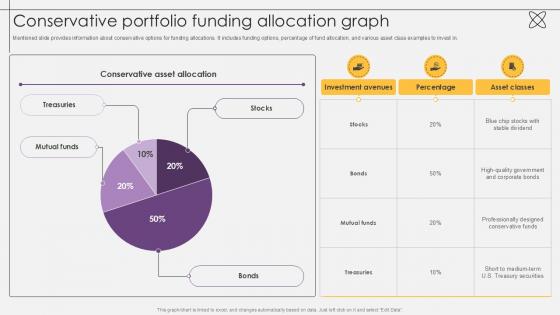
Conservative Portfolio Funding Allocation Graph Investment Fund PPT Sample
Mentioned slide provides information about conservative options for funding allocations.It includes funding options, percentage of fund allocation, and various asset class examples to invest in. Do you have an important presentation coming up Are you looking for something that will make your presentation stand out from the rest Look no further than Conservative Portfolio Funding Allocation Graph Investment Fund PPT Sample. With our professional designs, you can trust that your presentation will pop and make delivering it a smooth process. And with Slidegeeks, you can trust that your presentation will be unique and memorable. So why wait Grab Conservative Portfolio Funding Allocation Graph Investment Fund PPT Sample today and make your presentation stand out from the rest Mentioned slide provides information about conservative options for funding allocations.It includes funding options, percentage of fund allocation, and various asset class examples to invest in.
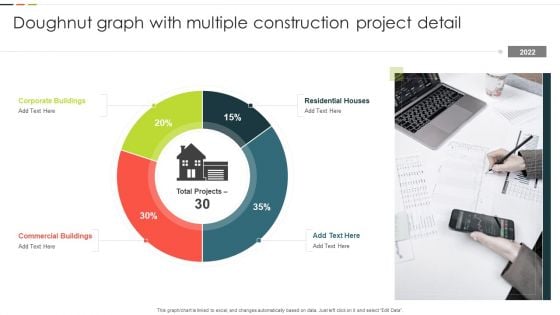
Doughnut Graph With Multiple Construction Project Detail Structure PDF
This graph or chart is linked to excel, and changes automatically based on data. Just left click on it and select Edit Data. Showcasing this set of slides titled Doughnut Graph With Multiple Construction Project Detail Structure PDF. The topics addressed in these templates are Corporate Buildings, Residential Houses, Commercial Buildings. All the content presented in this PPT design is completely editable. Download it and make adjustments in color, background, font etc. as per your unique business setting.
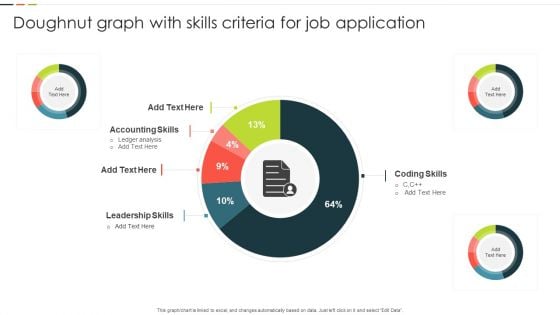
Doughnut Graph With Skills Criteria For Job Application Designs PDF
This graph or chart is linked to excel, and changes automatically based on data. Just left click on it and select Edit Data. Showcasing this set of slides titled Doughnut Graph With Skills Criteria For Job Application Designs PDF. The topics addressed in these templates are Accounting Skills, Leadership Skills, Coding Skills. All the content presented in this PPT design is completely editable. Download it and make adjustments in color, background, font etc. as per your unique business setting.

Non Performing Assets Loans Graph Ppt Inspiration Information PDF
This slide Provides the graph of historical and Forecasted Non Performing Assets Loans in persent for the period 2015 to 2023 and the Strategies used by the company to reduce NPA over that period.Deliver an awe-inspiring pitch with this creative non performing assets loans graph ppt inspiration information pdf. bundle. Topics like non performing assets, 2015 to 2023 can be discussed with this completely editable template. It is available for immediate download depending on the needs and requirements of the user
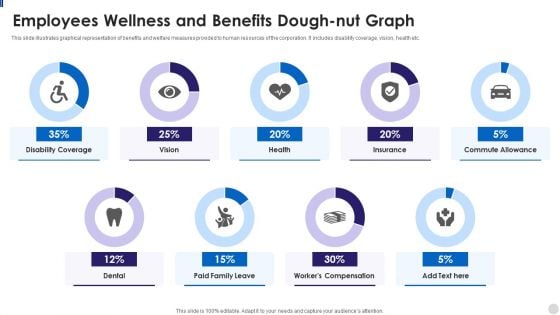
Employees Wellness And Benefits Dough Nut Graph Infographics PDF
This slide illustrates graphical representation of benefits and welfare measures provided to human resources of the corporation. It includes disability coverage, vision, health etc. Showcasing this set of slides titled Employees Wellness And Benefits Dough Nut Graph Infographics PDF. The topics addressed in these templates are Employees Wellness And Benefits Dough Nut Graph. All the content presented in this PPT design is completely editable. Download it and make adjustments in color, background, font etc. as per your unique business setting.

Brand Revenue Comparative Analysis Graph With Key Insights Inspiration PDF
This slide illustrates graphical representation of sales revenue of three brands. It includes insights and facts and figures of these brands.Showcasing this set of slides titled Brand Revenue Comparative Analysis Graph With Key Insights Inspiration PDF. The topics addressed in these templates are Brand Revenue Comparative Analysis Graph With Key Insights. All the content presented in this PPT design is completely editable. Download it and make adjustments in color, background, font etc. as per your unique business setting.
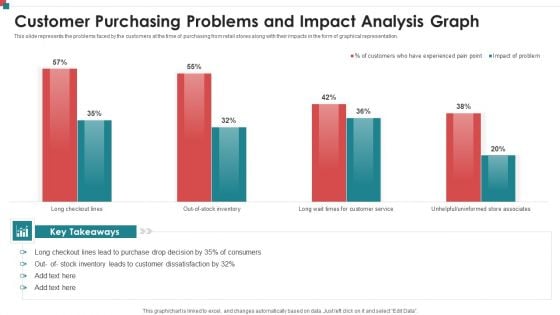
Customer Purchasing Problems And Impact Analysis Graph Inspiration PDF
This slide represents the problems faced by the customers at the time of purchasing from retail stores along with their impacts in the form of graphical representation. Showcasing this set of slides titled Customer Purchasing Problems And Impact Analysis Graph Inspiration PDF. The topics addressed in these templates are Customer Purchasing Problems And Impact Analysis Graph. All the content presented in this PPT design is completely editable. Download it and make adjustments in color, background, font etc. as per your unique business setting.
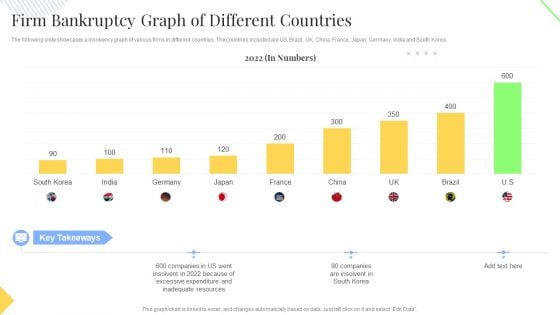
Firm Bankruptcy Graph Of Different Countries Summary PDF
The following slide showcases a insolvency graph of various firms in different countries. The countries included are US, Brazil, UK, China, France, Japan, Germany, India and South Korea. Showcasing this set of slides titled Firm Bankruptcy Graph Of Different Countries Summary PDF. The topics addressed in these templates are Excessive Expenditure, Inadequate Resources. All the content presented in this PPT design is completely editable. Download it and make adjustments in color, background, font etc. as per your unique business setting.
Sales Performance Comparison Graph Of Top Customer Icons PDF
This slide shows the customer sales comparison graph along with the units of product purchased by the clients. Showcasing this set of slides titled Sales Performance Comparison Graph Of Top Customer Icons PDF. The topics addressed in these templates are Highest Units, Customer, Product. All the content presented in this PPT design is completely editable. Download it and make adjustments in color, background, font etc. as per your unique business setting.
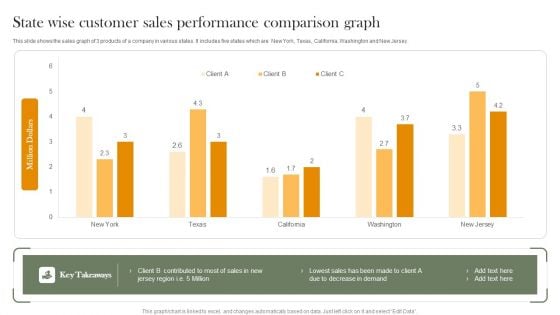
State Wise Customer Sales Performance Comparison Graph Introduction PDF
This slide shows the sales graph of 3 products of a company in various states. It includes five states which are New York, Texas, California, Washington and New Jersey. Showcasing this set of slides titled State Wise Customer Sales Performance Comparison Graph Introduction PDF. The topics addressed in these templates are Lowest Sales, Decrease Demand. All the content presented in this PPT design is completely editable. Download it and make adjustments in color, background, font etc. as per your unique business setting.

Employee Work Time Utilization Analysis Graph Mockup PDF
The following slide highlights the employee work time assessment to gauge their productivity. It includes activities such as daily tasks, research, meetings, reports, contracting, travel, etc. Showcasing this set of slides titled Employee Work Time Utilization Analysis Graph Mockup PDF. The topics addressed in these templates are Employee Work Time, Utilization Analysis Graph. All the content presented in this PPT design is completely editable. Download it and make adjustments in color, background, font etc. as per your unique business setting.

Line Graph Showing Growth In Customer Conversion Rate Inspiration PDF
Pitch your topic with ease and precision using this Line Graph Showing Growth In Customer Conversion Rate Inspiration PDF. This layout presents information on Monthly Average, Customer Conversion Rate, Previous Average. It is also available for immediate download and adjustment. So, changes can be made in the color, design, graphics or any other component to create a unique layout.
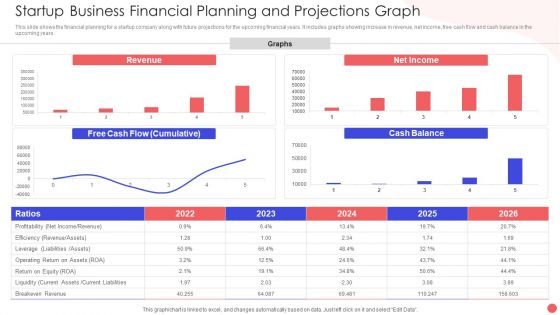
Startup Business Financial Planning And Projections Graph Slides PDF
This slide shows the financial planning for a startup company along with future projections for the upcoming financial years. It includes graphs showing increase in revenue, net income, free cash flow and cash balance in the upcoming years. Pitch your topic with ease and precision using this Startup Business Financial Planning And Projections Graph Slides PDF. This layout presents information on Revenue Graphs Operating, Free Cash Flow, Net Income Ration. It is also available for immediate download and adjustment. So, changes can be made in the color, design, graphics or any other component to create a unique layout.
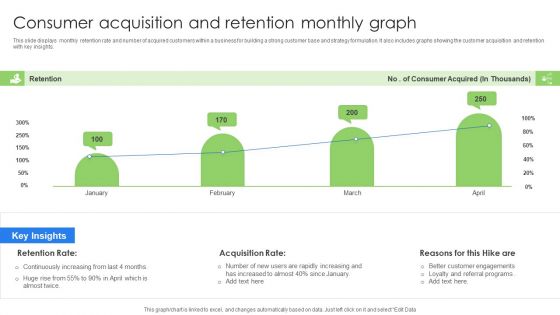
Consumer Acquisition And Retention Monthly Graph Background PDF
This slide displays monthly retention rate and number of acquired customers within a business for building a strong customer base and strategy formulation. It also includes graphs showing the customer acquisition and retention with key insights. Pitch your topic with ease and precision using this Consumer Acquisition And Retention Monthly Graph Background PDF. This layout presents information on Consumer Acquisition, Retention Monthly Graph. It is also available for immediate download and adjustment. So, changes can be made in the color, design, graphics or any other component to create a unique layout.
Safety And Health Kpis For Tracking Performance Graph Mockup PDF
This slide represents graph showing key performance indicators tracked by companies for assessment of safety and health performance of their workplace. It includes key metrics such as workforce awareness, safety meetings held, recordable injuries, lost work days, compliance, severity rates etc. Pitch your topic with ease and precision using this Safety And Health Kpis For Tracking Performance Graph Mockup PDF. This layout presents information on Safety And Health, Kpis For Tracking, Performance Graph. It is also available for immediate download and adjustment. So, changes can be made in the color, design, graphics or any other component to create a unique layout.
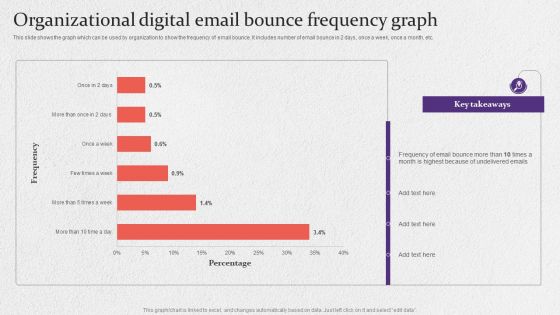
Organizational Digital Email Bounce Frequency Graph Formats PDF
This slide shows the graph which can be used by organization to show the frequency of email bounce. It includes number of email bounce in 2 days, once a week, once a month, etc. Pitch your topic with ease and precision using this Organizational Digital Email Bounce Frequency Graph Formats PDF. This layout presents information on Organizational Digital, Email Bounce Frequency Graph. It is also available for immediate download and adjustment. So, changes can be made in the color, design, graphics or any other component to create a unique layout.
Consumer Support Department Monthly Complaints Tracking Graph Diagrams PDF
Presenting onsumer Support Department Monthly Complaints Tracking Graph Diagrams PDF to dispense important information. This template comprises Three stages. It also presents valuable insights into the topics including Department Monthly, Complaints Tracking Graph. This is a completely customizable PowerPoint theme that can be put to use immediately. So, download it and address the topic impactfully.
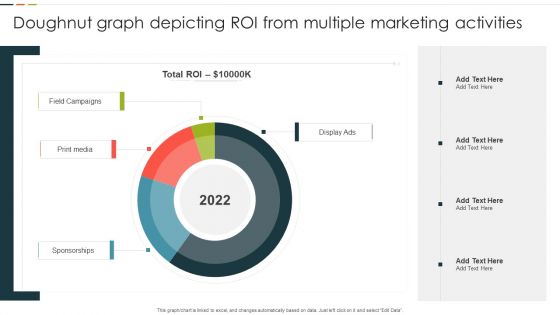
Doughnut Graph Depicting ROI From Multiple Marketing Activities Rules PDF
This graph or chart is linked to excel, and changes automatically based on data. Just left click on it and select Edit Data. Pitch your topic with ease and precision using this Doughnut Graph Depicting ROI From Multiple Marketing Activities Rules PDF. This layout presents information on Total ROI, Field Campaigns, Print Media, Display Ads. It is also available for immediate download and adjustment. So, changes can be made in the color, design, graphics or any other component to create a unique layout.
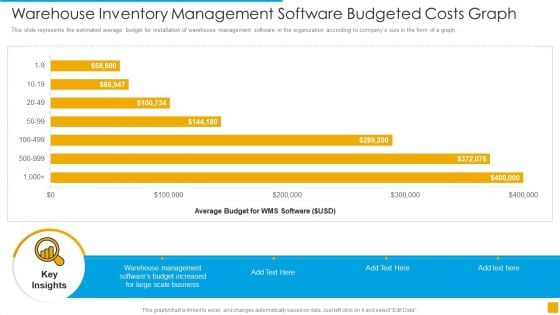
Warehouse Inventory Management Software Budgeted Costs Graph Demonstration PDF
This slide represents the estimated average budget for installation of warehouse management software in the organization according to companys size in the form of a graph Pitch your topic with ease and precision using this Warehouse Inventory Management Software Budgeted Costs Graph Demonstration PDF. This layout presents information on Management, Budget, Average. It is also available for immediate download and adjustment. So, changes can be made in the color, design, graphics or any other component to create a unique layout.
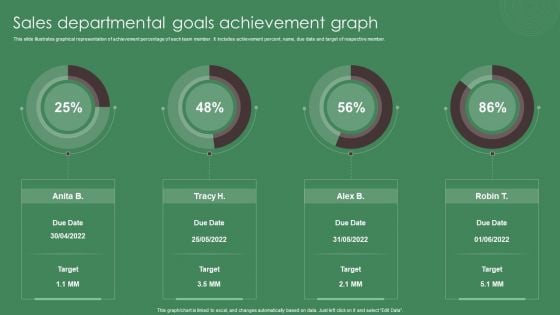
Sales Departmental Goals Achievement Graph Ppt Inspiration Slide Download PDF
This slide illustrates graphical representation of achievement percentage of each team member. It includes achievement percent, name, due date and target of respective member. Pitch your topic with ease and precision using this Sales Departmental Goals Achievement Graph Ppt Inspiration Slide Download PDF. This layout presents information on Sales Departmental, Goals, Achievement Graph. It is also available for immediate download and adjustment. So, changes can be made in the color, design, graphics or any other component to create a unique layout.
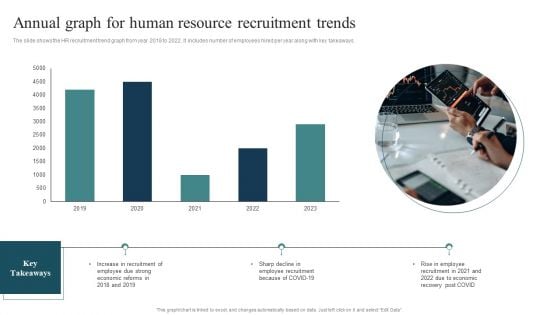
Annual Graph For Human Resource Recruitment Trends Summary PDF
The slide shows the HR recruitment trend graph from year 2018 to 2022. It includes number of employees hired per year along with key takeaways. Pitch your topic with ease and precision using this Annual Graph For Human Resource Recruitment Trends Summary PDF. This layout presents information on Employee Recruitment, Rise Employee, Economic Reforms. It is also available for immediate download and adjustment. So, changes can be made in the color, design, graphics or any other component to create a unique layout.
Distributed Network Graph Algorithm Ppt Powerpoint Presentation Outline Master Slide
This is a distributed network graph algorithm ppt powerpoint presentation outline master slide. This is a four stage process. The stages in this process are scatter plot, probability plots, plot diagram.
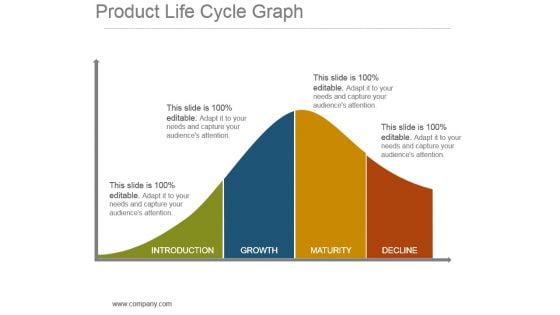
Product Life Cycle Graph Powerpoint Slide Background Image
This is a product life cycle graph powerpoint slide background image. This is a four stage process. The stages in this process are introduction, growth, maturity, decline.
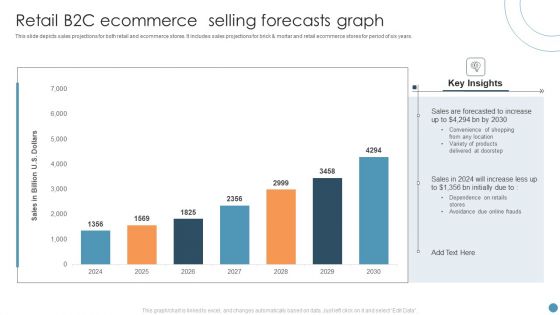
Retail B2C Ecommerce Selling Forecasts Graph Portrait PDF
This slide depicts sales projections for both retail and ecommerce stores. It includes sales projections for brick and mortar and retail ecommerce stores for period of six years. Pitch your topic with ease and precision using this Retail B2C Ecommerce Selling Forecasts Graph Portrait PDF. This layout presents information on Retail B2C Ecommerce, Selling Forecasts Graph. It is also available for immediate download and adjustment. So, changes can be made in the color, design, graphics or any other component to create a unique layout.
Business Graph Arrow Symbol PowerPoint Templates And PowerPoint Backgrounds 0511
Microsoft PowerPoint Template and Background with chart business graph with arrow showing profits and gains It is time to say farewell to failure. Our Business Graph Arrow Symbol PowerPoint Templates And PowerPoint Backgrounds 0511 assure achievement.

Money Graph Business PowerPoint Templates And PowerPoint Backgrounds 0711
Microsoft PowerPoint Template and Background with upward growth chart or graph of arrows made of money Accentuate the beauty of your thoughts with our Money Graph Business PowerPoint Templates And PowerPoint Backgrounds 0711. They will prove an apt adornment.
Pie Graph Circle Charts PowerPoint Templates And PowerPoint Themes 0612
Pie Graph Circle Charts PowerPoint Templates And PowerPoint Themes PPT Slides-Microsoft Powerpoint Templates and Background with pie chart graph Admit them into your world of brilliance. Our Pie Graph Circle Charts PowerPoint Templates And PowerPoint Themes 0612 will direct them along.
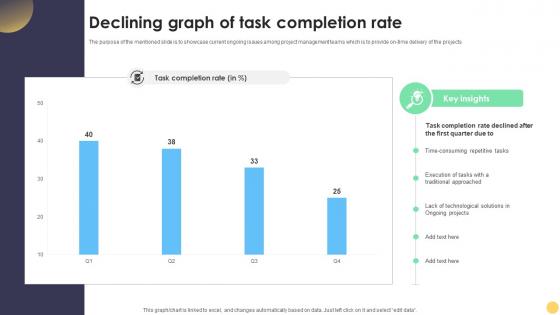
Digital Project Management Strategies Declining Graph Of Task Completion Rate
The purpose of the mentioned slide is to showcase current ongoing issues among project management teams which is to provide on-time delivery of the projects. From laying roadmaps to briefing everything in detail, our templates are perfect for you. You can set the stage with your presentation slides. All you have to do is download these easy-to-edit and customizable templates. Digital Project Management Strategies Declining Graph Of Task Completion Rate will help you deliver an outstanding performance that everyone would remember and praise you for. Do download this presentation today. The purpose of the mentioned slide is to showcase current ongoing issues among project management teams which is to provide on-time delivery of the projects.
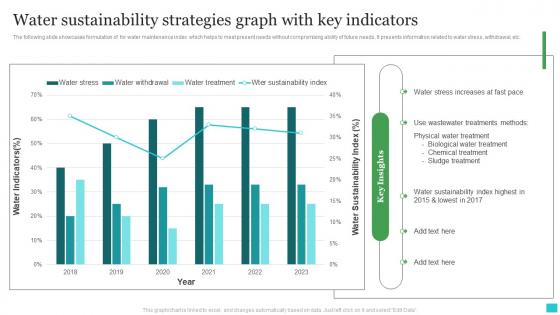
Water Sustainability Strategies Graph With Key Indicators Diagrams Pdf
The following slide showcases formulation of for water maintenance index which helps to meet present needs without compromising ability of future needs. It presents information related to water stress, withdrawal, etc. Showcasing this set of slides titled Water Sustainability Strategies Graph With Key Indicators Diagrams Pdf. The topics addressed in these templates are Biological Water Treatment,Chemical Treatment, Sludge Treatment. All the content presented in this PPT design is completely editable. Download it and make adjustments in color, background, font etc. as per your unique business setting. The following slide showcases formulation of for water maintenance index which helps to meet present needs without compromising ability of future needs. It presents information related to water stress, withdrawal, etc.
Growing Shopping Graph Sales PowerPoint Templates And PowerPoint Backgrounds 0411
Microsoft PowerPoint Template and Background with uprising shopping growth graph Heap great praises with our Growing Shopping Graph Sales PowerPoint Templates And PowerPoint Backgrounds 0411. Try us out and see what a difference our templates make.


 Continue with Email

 Home
Home


