Bar Graph
Business Graph Money PowerPoint Templates And PowerPoint Backgrounds 1011
Microsoft PowerPoint Template and Background with business graph with arrow going up and coin columns standing below Exhibit your erudition on our Business Graph Money PowerPoint Templates And PowerPoint Backgrounds 1011. Give the audience a taste of your profound knowledge.

Businessman With Graph Success PowerPoint Templates And PowerPoint Backgrounds 1011
Microsoft PowerPoint Template and Background with successful business man with a graph Bounce your ideas off our Businessman With Graph Success PowerPoint Templates And PowerPoint Backgrounds 1011. They will echo your thoughts all the way.
Question Business Graph Future PowerPoint Templates And PowerPoint Backgrounds 1011
Microsoft PowerPoint Template and Background with empty business graph with red question mark Behold the festival of our Question Business Graph Future PowerPoint Templates And PowerPoint Backgrounds 1011. They will put on a series of great shows.
Graph With Globe Success PowerPoint Templates And PowerPoint Backgrounds 1211
Microsoft PowerPoint Template and Background with colorful business graph with globe Our Graph With Globe Success PowerPoint Templates And PowerPoint Backgrounds 1211 will transmit your commitment. Your audience will repose their faith in you.
Target With Graph Success PowerPoint Templates And PowerPoint Backgrounds 1211
Microsoft PowerPoint Template and Background with target and graph represents success Enhance connectivity with our Target With Graph Success PowerPoint Templates And PowerPoint Backgrounds 1211. They will always keep you in touch.
Business Graph Success PowerPoint Templates And PowerPoint Backgrounds 1211
Microsoft PowerPoint Template and Background with business couple in a business graph environment Make it a festival of ideas with our Business Graph Success PowerPoint Templates And PowerPoint Backgrounds 1211. Your audience will be up for a celebration.
Graph Showing Profit Business PowerPoint Templates And PowerPoint Backgrounds 1211
Microsoft PowerPoint Template and Background with abstract drawing of graph showing profit Start driving productivity gains with our Graph Showing Profit Business PowerPoint Templates And PowerPoint Backgrounds 1211. They will make you look good.
Graph With Arrow Success PowerPoint Templates And PowerPoint Themes 0312
Microsoft Powerpoint Templates and Background with green tube graph Scale peaks with our Graph With Arrow Success PowerPoint Templates And PowerPoint Themes 0312. You will come out on top.
Success Graph Business PowerPoint Templates And PowerPoint Themes 0312
Microsoft Powerpoint Templates and Background with business graph Failures are a stepping stone to success. Analyse likely causes with our Success Graph Business PowerPoint Templates And PowerPoint Themes 0312.
Graph Showing Growth Success PowerPoint Templates And PowerPoint Themes 0412
Microsoft Powerpoint Templates and Background with business graph success Have some fun with our Graph Showing Growth Success PowerPoint Templates And PowerPoint Themes 0412. They make creating ideas enjoyable.
Lego Graph Success PowerPoint Templates And PowerPoint Themes 0512
Microsoft Powerpoint Templates and Background with Lego Graph Success Our Lego Graph Success PowerPoint Templates And PowerPoint Themes 0512 will go on till blue in the face. They will keep at it till you achieve your aim.
Profit Graph Success PowerPoint Templates And PowerPoint Themes 0812
Profit Graph Success PowerPoint Templates And PowerPoint Themes 0812-Microsoft Powerpoint Templates and Background with profit graph Have a great ride at a low fare. Coast along on our PT&s.
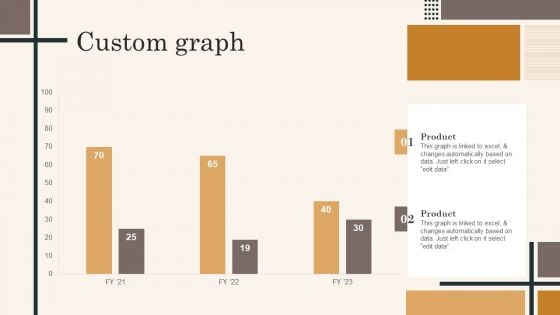
Edtech Service Launch And Promotion Plan Custom Graph Portrait PDF
Here you can discover an assortment of the finest PowerPoint and Google Slides templates. With these templates, you can create presentations for a variety of purposes while simultaneously providing your audience with an eye catching visual experience. Download Edtech Service Launch And Promotion Plan Custom Graph Portrait PDF to deliver an impeccable presentation. These templates will make your job of preparing presentations much quicker, yet still, maintain a high level of quality. Slidegeeks has experienced researchers who prepare these templates and write high quality content for you. Later on, you can personalize the content by editing the Edtech Service Launch And Promotion Plan Custom Graph Portrait PDF.
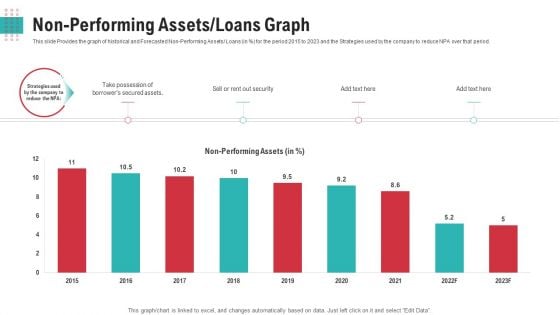
Non Performing Assets Loans Graph Ppt Model Slide Portrait
This slide Provides the graph of historical and Forecasted Non-Performing Assets Loans in persent for the period 2015 to 2023 and the Strategies used by the company to reduce NPA over that period.Deliver and pitch your topic in the best possible manner with this non performing assets loans graph ppt model slide portrait. Use them to share invaluable insights on non performing assets, 2015 to 2023 and impress your audience. This template can be altered and modified as per your expectations. So, grab it now.

Graph Indicating Clinical Trial Phases Probability Of Success Infographics PDF
This slide compares and visually presents the success rate of each stage with preceding one of the clinical research procedures to represent the achievement of the drug efficacy objective of the firm.Deliver and pitch your topic in the best possible manner with this Graph Indicating Clinical Trial Phases Probability Of Success Infographics PDF Use them to share invaluable insights on Graph Indicating Clinical Trial Phases Probability Of Success and impress your audience. This template can be altered and modified as per your expectations. So, grab it now.
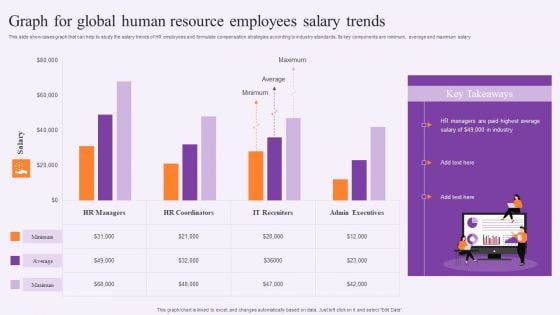
Graph For Global Human Resource Employees Salary Trends Demonstration PDF
This slide showcases graph that can help to study the salary trends of HR employees and formulate compensation strategies according to industry standards. Its key components are minimum, average and maximum salary. Showcasing this set of slides titled Graph For Global Human Resource Employees Salary Trends Demonstration PDF. The topics addressed in these templates are Global Human Resource, Employees Salary Trends. All the content presented in this PPT design is completely editable. Download it and make adjustments in color, background, font etc. as per your unique business setting.
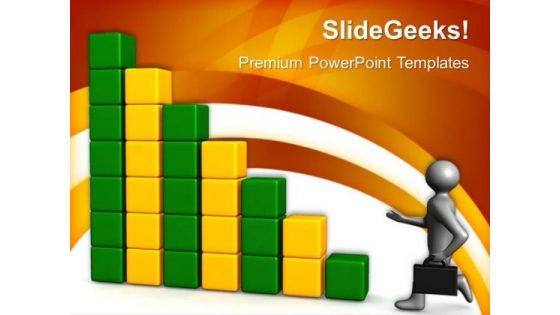
Blocks Graph Business PowerPoint Templates And PowerPoint Themes 0512
Microsoft Powerpoint Templates and Background with blocks-These templates can be used for presentations relating to-Blocks, marketing, business, shapes, success, finance-Blocks Graph Business PowerPoint Templates And PowerPoint Themes 0512 Exhibit leadership with our Blocks Graph Business PowerPoint Templates And PowerPoint Themes 0512. Download without worries with our money back guaranteee.
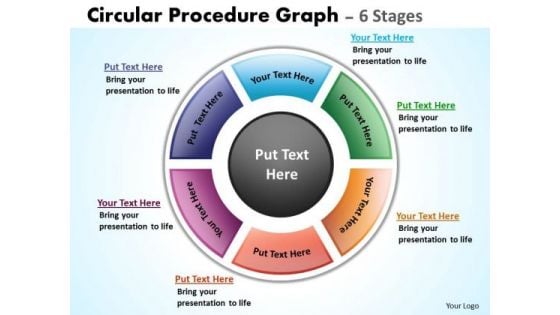
Business Framework Model Circular Procedure Graph Diagrams Marketing Diagram
Get The Doers Into Action. Activate Them With Our Business Framework Model Circular Procedure Graph Diagrams Marketing Diagram Powerpoint Templates.

Dollar Graph Profit Business PowerPoint Templates And PowerPoint Themes 0712
Dollar Graph Profit Business PowerPoint Templates And PowerPoint Themes 0712-Microsoft Powerpoint Templates and Background with graph made of money Fill the gaps with our Dollar Graph Profit Business PowerPoint Templates And PowerPoint Themes 0712. Try us out and see what a difference our templates make.

Profit Graph Concept Success PowerPoint Templates And PowerPoint Themes 0812
Profit Graph Concept Success PowerPoint Templates And PowerPoint Themes 0812-Microsoft Powerpoint Templates and Background with profit graph concept Frighten the competition with our Profit Graph Concept Success PowerPoint Templates And PowerPoint Themes 0812. Try us out and see what a difference our templates make.
Graph Business PowerPoint Templates And PowerPoint Themes 0512
Microsoft Powerpoint Templates and Background with growth graph-Graph Business PowerPoint Templates And PowerPoint Themes 0512-These PowerPoint designs and slide layouts can be used for themes relating to -Growth graph, business, success, teamwork, finance, shapes Be an outperforming global competititor with our Graph Business PowerPoint Templates And PowerPoint Themes 0512. They will make you look good.
Graph Profit Finance PowerPoint Templates And PowerPoint Themes 0512
Microsoft Powerpoint Templates and Background with business growth-Graph Profit Finance PowerPoint Templates And PowerPoint Themes 0512-These PowerPoint designs and slide layouts can be used for themes relating to -Graph profit finance, business, finance, sales, shape, success Catch the fancy of your audience. Our Graph Profit Finance PowerPoint Templates And PowerPoint Themes 0512 make a delightful display.
Red Graph 2012 Business PowerPoint Templates And PowerPoint Themes 0512
Red Graph 2012 Business PowerPoint Templates And PowerPoint Themes PPT designs-Microsoft Powerpoint Templates and Background with graph is showing success for 2012 Communicate your clear thoughts with our Red Graph 2012 Business PowerPoint Templates And PowerPoint Themes 0512. You will come out on top.

Dollar And Graph Finance PowerPoint Templates And PowerPoint Themes 0612
Dollar And Graph Finance PowerPoint Templates And PowerPoint Themes Business-Microsoft Powerpoint Templates and Background with business graph with arrow showing profits Our Dollar And Graph Finance PowerPoint Templates And PowerPoint Themes 0612 are faithful servants. They will put in all possible effort for you.
Business Graph Finance PowerPoint Templates And PowerPoint Themes 0712
Business Graph Finance PowerPoint Templates And PowerPoint Themes 0712-Microsoft Powerpoint Templates and Background with business graph Our slides and your story create a beautiful combination with our Business Graph Finance PowerPoint Templates And PowerPoint Themes 0712. Dont pass up this opportunity to shine.
Upward Arrow Dollar Graph PowerPoint Templates And PowerPoint Themes 0812
Upward Arrow Dollar Graph PowerPoint Templates And PowerPoint Themes 0812-Microsoft Powerpoint Templates and Background with upward arrow dollar graph Estabish the key factors of your scheme. Explain the crucial elements with our Upward Arrow Dollar Graph PowerPoint Templates And PowerPoint Themes 0812.
Business Graph Finance PowerPoint Templates And PowerPoint Themes 0812
Business Graph Finance PowerPoint Templates And PowerPoint Themes 0812-Microsoft Powerpoint Templates and Background with business graph You are due to debut on the dais. Ensure an auspicious entry into this environment with our Business Graph Finance PowerPoint Templates And PowerPoint Themes 0812
Failure Finance Graph Business PowerPoint Templates And PowerPoint Themes 0812
Failure Finance Graph Business PowerPoint Templates And PowerPoint Themes 0812-Microsoft Powerpoint Templates and Background with business graph with failure Let new ideas filter in with our Failure Finance Graph Business PowerPoint Templates And PowerPoint Themes 0812. They will be acceptable to any audience.
Graph With Image Globe PowerPoint Templates And PowerPoint Themes 0812
Graph With Image Globe PowerPoint Templates And PowerPoint Themes 0812-Microsoft Powerpoint Templates and Background with graph and globe on top Our Graph With Image Globe PowerPoint Templates And PowerPoint Themes 0812 are ever evolving. They absorb new concepts with complete ease.

Financial Projection Graph Template 1 Ppt PowerPoint Presentation Guide
This is a financial projection graph template 1 ppt powerpoint presentation guide. This is a three stage process. The stages in this process are annual sales, gross margin, net profit.
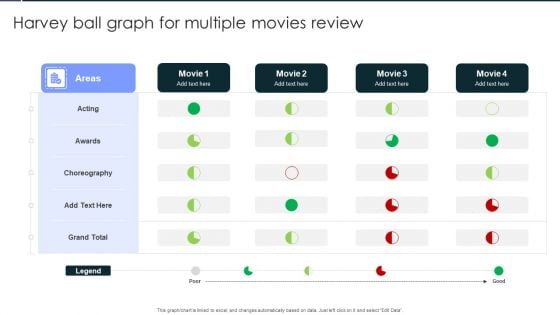
Harvey Ball Graph For Multiple Movies Review Template PDF
Showcasing this set of slides titled Harvey Ball Graph For Multiple Movies Review Template PDF. The topics addressed in these templates are Acting, Awards, Choreography. All the content presented in this PPT design is completely editable. Download it and make adjustments in color, background, font etc. as per your unique business setting.
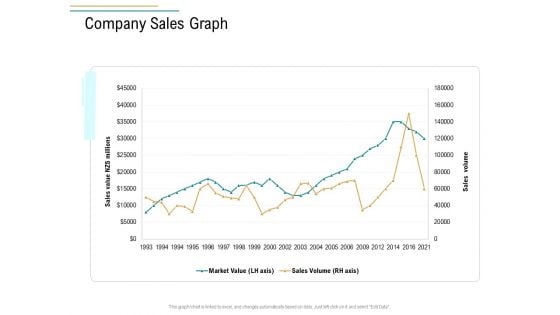
Business Operations Assessment Company Sales Graph Ppt Portfolio Good PDF
Deliver an awe-inspiring pitch with this creative business operations assessment company sales graph ppt portfolio good pdf bundle. Topics like market value, sales volume can be discussed with this completely editable template. It is available for immediate download depending on the needs and requirements of the user.
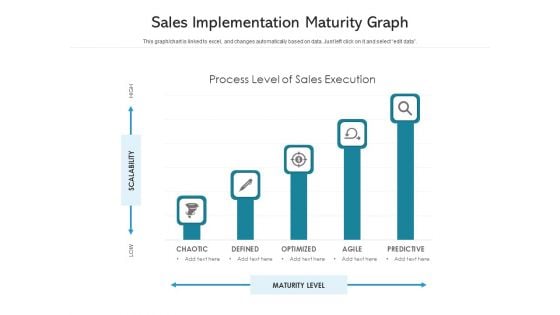
Sales Implementation Maturity Graph Ppt PowerPoint Presentation Inspiration Microsoft PDF
Showcasing this set of slides titled sales implementation maturity graph ppt powerpoint presentation inspiration microsoft pdf. The topics addressed in these templates are chaotic, defined, optimized, agile, predictive. All the content presented in this PPT design is completely editable. Download it and make adjustments in color, background, font etc. as per your unique business setting.
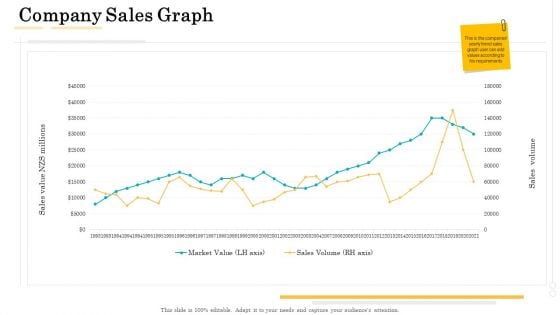
Administrative Regulation Company Sales Graph Ppt PowerPoint Presentation Outline PDF
Deliver an awe-inspiring pitch with this creative administrative regulation company sales graph ppt powerpoint presentation outline pdf bundle. Topics like market value, sales volume can be discussed with this completely editable template. It is available for immediate download depending on the needs and requirements of the user.
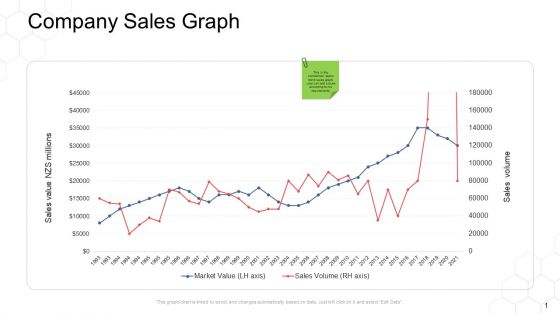
Corporate Regulation Company Sales Graph Ppt Infographics Backgrounds PDF
Deliver an awe inspiring pitch with this creative corporate regulation company sales graph ppt infographics backgrounds pdf bundle. Topics like sales, value, market can be discussed with this completely editable template. It is available for immediate download depending on the needs and requirements of the user.
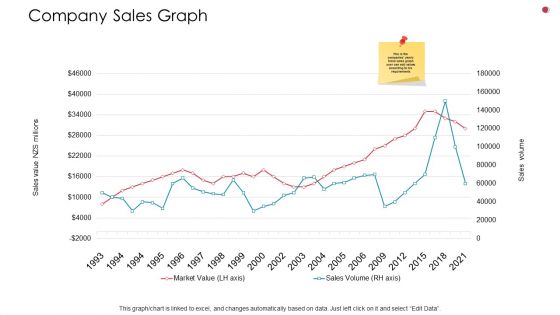
Company Sales Graph Business Analysis Method Ppt Professional Visuals PDF
Deliver an awe inspiring pitch with this creative company sales graph business analysis method ppt professional visuals pdf bundle. Topics like market value, sales can be discussed with this completely editable template. It is available for immediate download depending on the needs and requirements of the user.
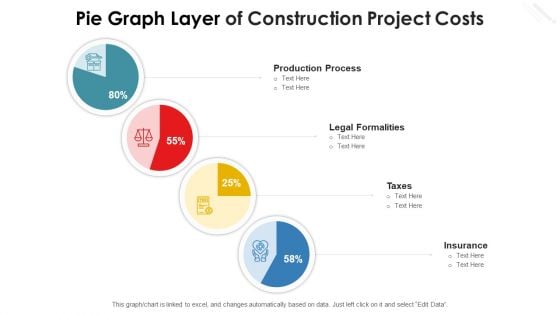
Pie Graph Layer Of Construction Project Costs Diagrams PDF
Showcasing this set of slides titled pie graph layer of construction project costs diagrams pdf. The topics addressed in these templates are production process, taxes, legal formalities, insurance. All the content presented in this PPT design is completely editable. Download it and make adjustments in color, background, font etc. as per your unique business setting.
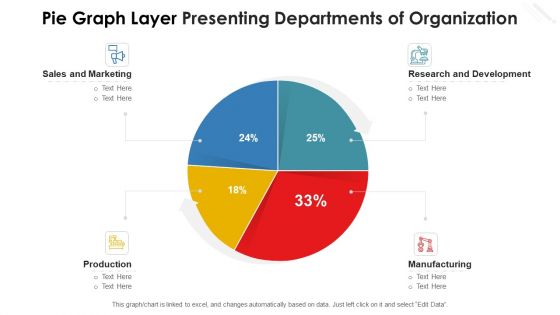
Pie Graph Layer Presenting Departments Of Organization Infographics PDF
Showcasing this set of slides titled pie graph layer presenting departments of organization infographics pdf. The topics addressed in these templates are sales and marketing, production, manufacturing, research and development. All the content presented in this PPT design is completely editable. Download it and make adjustments in color, background, font etc. as per your unique business setting.
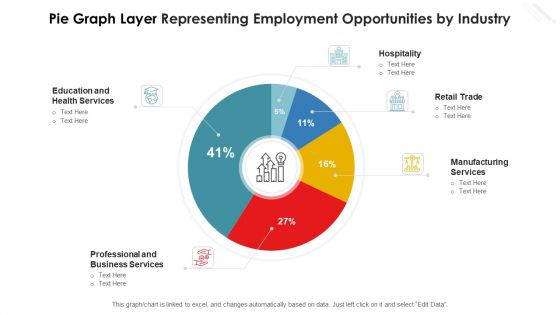
Pie Graph Layer Representing Employment Opportunities By Industry Ideas PDF
Showcasing this set of slides titled pie graph layer representing employment opportunities by industry ideas pdf. The topics addressed in these templates are hospitality, retail trade, manufacturing services, education and health services, professional and business services. All the content presented in this PPT design is completely editable. Download it and make adjustments in color, background, font etc. as per your unique business setting.
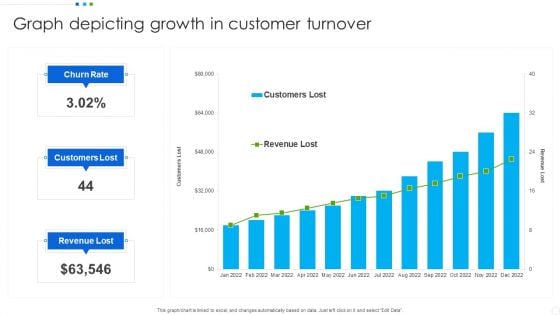
Graph Depicting Growth In Customer Turnover Infographics PDF
Showcasing this set of slides titled Graph Depicting Growth In Customer Turnover Infographics PDF. The topics addressed in these templates are Revenue Lost, Customers Lost, Churn Rate. All the content presented in this PPT design is completely editable. Download it and make adjustments in color, background, font etc. as per your unique business setting.
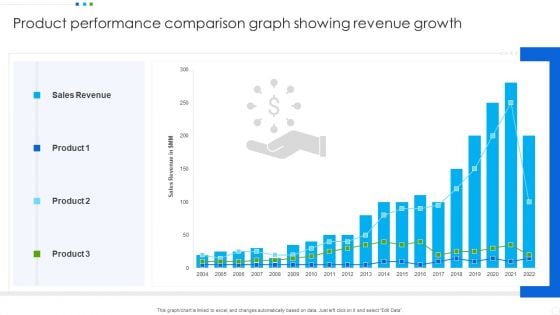
Product Performance Comparison Graph Showing Revenue Growth Portrait PDF
Showcasing this set of slides titled Product Performance Comparison Graph Showing Revenue Growth Portrait PDF. The topics addressed in these templates are Sales Revenue, Product. All the content presented in this PPT design is completely editable. Download it and make adjustments in color, background, font etc. as per your unique business setting.
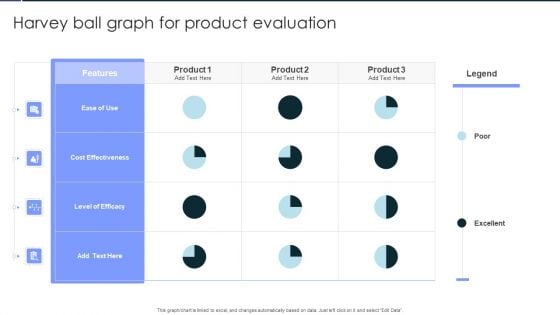
Harvey Ball Graph For Product Evaluation Microsoft PDF
Showcasing this set of slides titled Harvey Ball Graph For Product Evaluation Microsoft PDF. The topics addressed in these templates are Ease Of Use, Cost Effectiveness, Level Of Efficacy. All the content presented in this PPT design is completely editable. Download it and make adjustments in color, background, font etc. as per your unique business setting.
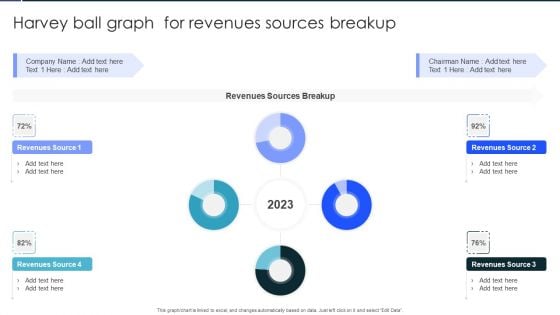
Harvey Ball Graph For Revenues Sources Breakup Infographics PDF
Showcasing this set of slides titled Harvey Ball Graph For Revenues Sources Breakup Infographics PDF. The topics addressed in these templates are Revenues Sources Breakup, Revenues, Sources Breakup. All the content presented in this PPT design is completely editable. Download it and make adjustments in color, background, font etc. as per your unique business setting.
Business Graph Arrow Symbol PowerPoint Themes And PowerPoint Slides 0511
Microsoft PowerPoint Slide and Theme with chart business graph with arrow showing profits and gains Display your even handedness with our Business Graph Arrow Symbol PowerPoint Themes And PowerPoint Slides 0511. Show them that you make fair assessments.
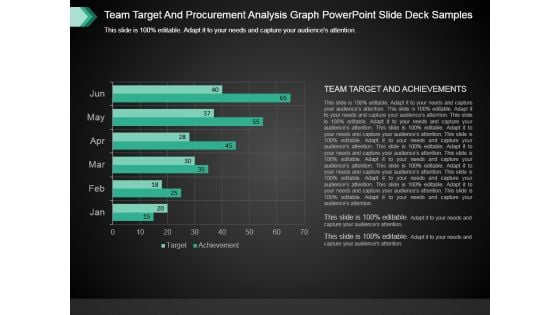
Team Target And Procurement Analysis Graph Powerpoint Slide Deck Samples
This is a team target and procurement analysis graph powerpoint slide deck samples. This is a six stage process. The stages in this process are graph chart, business, success, strategy, management.
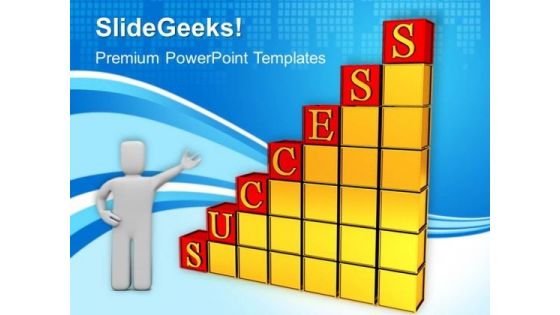
Business Success Graph PowerPoint Templates And PowerPoint Themes 1012
Business Success Graph PowerPoint Templates And PowerPoint Themes 1012-The PowerPoint Template shows the Growing Percentage Graph with each letter of Success on each step. This template portrays the concepts of winning, leadership, Finance, Success, competition, sports, business, shapes, people and abstract.-Business Success Graph PowerPoint Templates And PowerPoint Themes 1012-This PowerPoint template can be used for presentations relating to-Business graph showing growth, success, business, finance, marketing, stairs Soak in the energy our Business Success Graph PowerPoint Templates And PowerPoint Themes 1012 emit. Your thoughts will find them exhilirating.
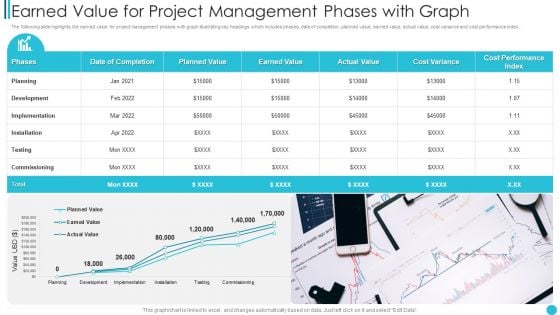
Earned Value For Project Management Phases With Graph Microsoft PDF
The following slide highlights the earned value for project management phases with graph illustrating key headings which includes phases, date of completion, planned value, earned value, actual value, cost variance and cost performance index.Pitch your topic with ease and precision using this Earned Value For Project Management Phases With Graph Microsoft PDF This layout presents information on Implementation, Installation, Commissioning It is also available for immediate download and adjustment. So, changes can be made in the color, design, graphics or any other component to create a unique layout.
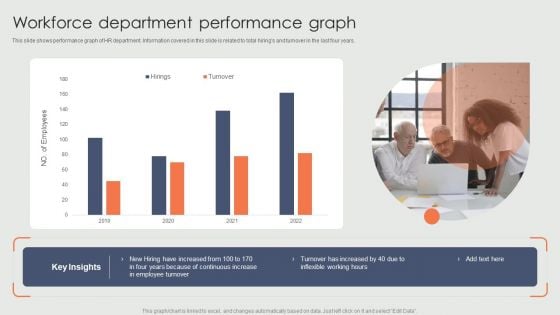
Workforce Department Performance Graph Ppt Model Graphics Pictures PDF
This slide shows performance graph of HR department. Information covered in this slide is related to total hirings and turnover in the last four years. Pitch your topic with ease and precision using this Workforce Department Performance Graph Ppt Model Graphics Pictures PDF. This layout presents information on New Hiring, Continuous Increase, Employee Turnover, 2019 To 2022. It is also available for immediate download and adjustment. So, changes can be made in the color, design, graphics or any other component to create a unique layout.
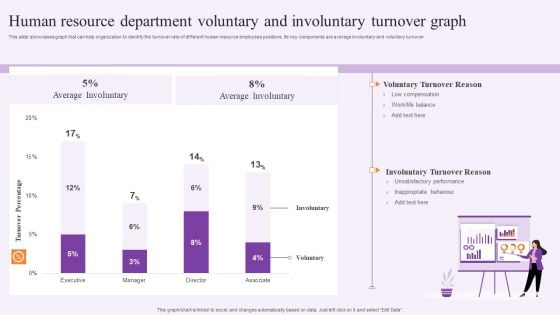
Human Resource Department Voluntary And Involuntary Turnover Graph Summary PDF
This slide showcases graph that can help organization to identify the turnover rate of different human resource employees positions. Its key components are average involuntary and voluntary turnover. Pitch your topic with ease and precision using this Human Resource Department Voluntary And Involuntary Turnover Graph Summary PDF. This layout presents information on Executive, Voluntary Turnover Reason, Average Involuntary. It is also available for immediate download and adjustment. So, changes can be made in the color, design, graphics or any other component to create a unique layout.
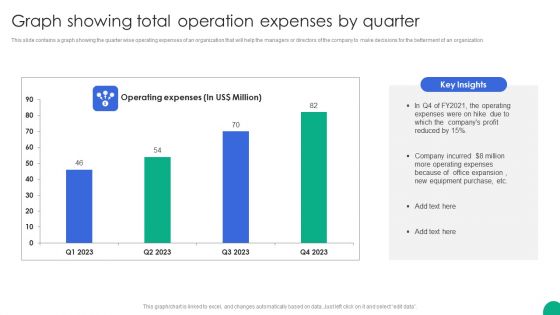
Graph Showing Total Operation Expenses By Quarter Themes PDF
This slide contains a graph showing the quarter wise operating expenses of an organization that will help the managers or directors of the company to make decisions for the betterment of an organization.Pitch your topic with ease and precision using this Graph Showing Total Operation Expenses By Quarter Themes PDF. This layout presents information on Operating Expenses, Equipment Purchase, Office Expansion. It is also available for immediate download and adjustment. So, changes can be made in the color, design, graphics or any other component to create a unique layout.
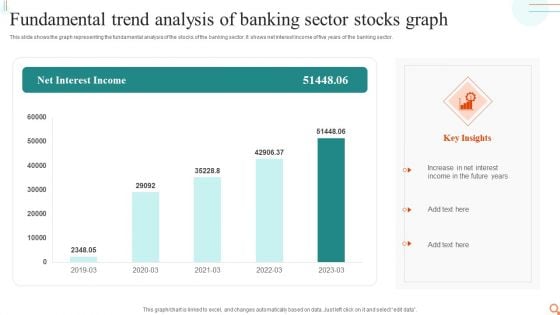
Fundamental Trend Analysis Of Banking Sector Stocks Graph Mockup PDF
This slide shows the graph representing the fundamental analysis of the stocks of the banking sector. It shows net interest income of five years of the banking sector.Pitch your topic with ease and precision using this Fundamental Trend Analysis Of Banking Sector Stocks Graph Mockup PDF. This layout presents information on Increase Interest, Income Future, Interest Income. It is also available for immediate download and adjustment. So, changes can be made in the color, design, graphics or any other component to create a unique layout.
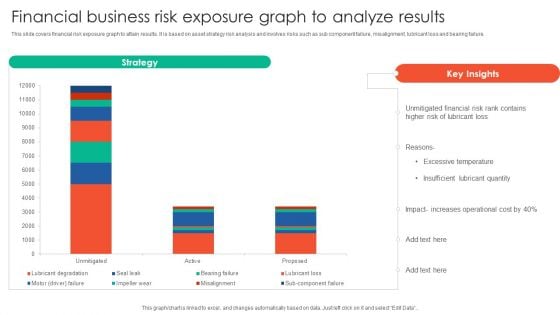
Financial Business Risk Exposure Graph To Analyze Results Elements PDF
This slide covers financial risk exposure graph to attain results. It is based on asset strategy risk analysis and involves risks such as sub component failure, misalignment, lubricant loss and bearing failure. Pitch your topic with ease and precision using this Financial Business Risk Exposure Graph To Analyze Results Elements PDF. This layout presents information on Strategy, Unmitigated Financial, Risk Rank Contains. It is also available for immediate download and adjustment. So, changes can be made in the color, design, graphics or any other component to create a unique layout.
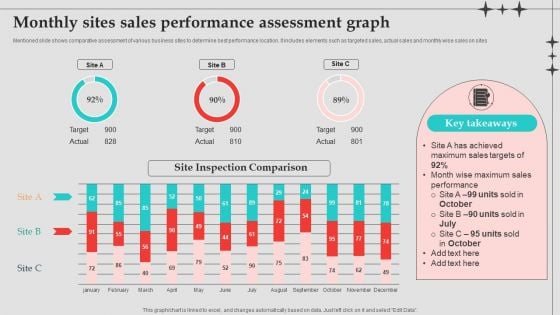
Monthly Sites Sales Performance Assessment Graph Designs PDF
Mentioned slide shows comparative assessment of various business sites to determine best performance location. It includes elements such as targeted sales, actual sales and monthly wise sales on sites. Pitch your topic with ease and precision using this Monthly Sites Sales Performance Assessment Graph Designs PDF. This layout presents information on Sales Performance, Sales Targets, Performance Assessment Graph . It is also available for immediate download and adjustment. So, changes can be made in the color, design, graphics or any other component to create a unique layout.
Financial Projection Graph Template 1 Ppt PowerPoint Presentation Icon Summary
This is a financial projection graph template 1 ppt powerpoint presentation icon summary. This is a three stage process. The stages in this process are annual sales forecast, years, business, marketing, management.
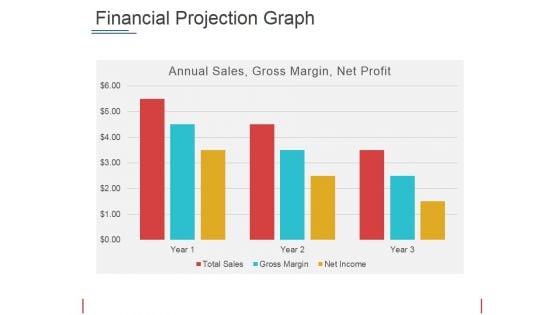
Financial Projection Graph Template 2 Ppt PowerPoint Presentation Show Picture
This is a financial projection graph template 2 ppt powerpoint presentation show picture. This is a three stage process. The stages in this process are annual sales, gross margin, net profit, years.
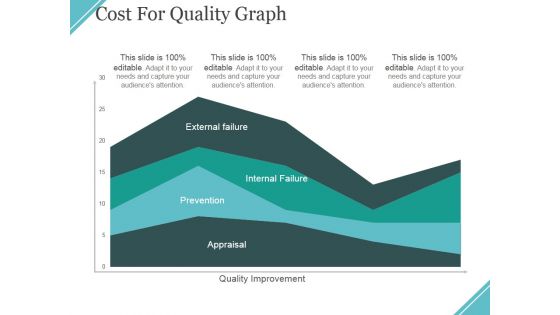
Cost For Quality Graph Ppt PowerPoint Presentation Ideas Files
This is a cost for quality graph ppt powerpoint presentation ideas files. This is a four stage process. The stages in this process are external failure, internal failure, prevention, appraisal, quality improvement.
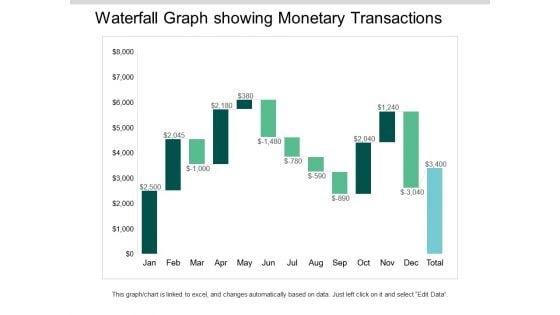
Waterfall Graph Showing Monetary Transactions Ppt PowerPoint Presentation Ideas Visuals
This is a waterfall graph showing monetary transactions ppt powerpoint presentation ideas visuals. This is a three stage process. The stages in this process are profit and loss, balance sheet, income statement, benefit and loss.
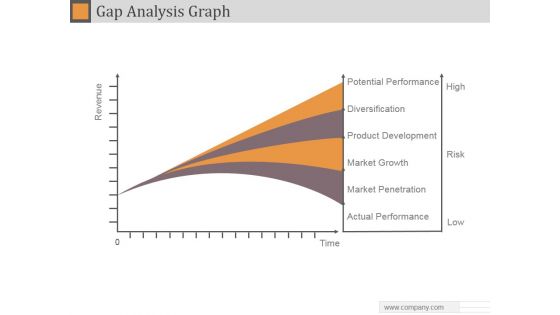
Gap Analysis Graph Ppt PowerPoint Presentation Example 2015
This is a gap analysis graph ppt powerpoint presentation example 2015. This is a four stage process. The stages in this process are potential performance, diversification, product development, market growth, market penetration, actual performance.
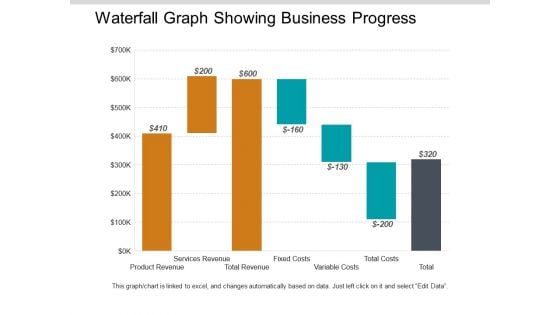
Waterfall Graph Showing Business Progress Ppt PowerPoint Presentation Styles Model
This is a waterfall graph showing business progress ppt powerpoint presentation styles model. This is a three stage process. The stages in this process are profit and loss, balance sheet, income statement, benefit and loss.
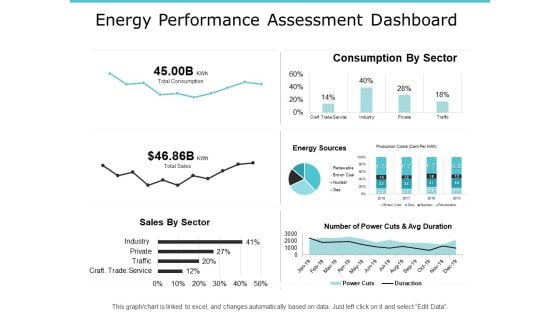
Energy Performance Assessment Dashboard Graph Ppt PowerPoint Presentation Slide
Presenting this set of slides with name energy performance assessment dashboard graph ppt powerpoint presentation slide. The topics discussed in these slides are marketing, business, management, planning, strategy. This is a completely editable PowerPoint presentation and is available for immediate download. Download now and impress your audience.


 Continue with Email

 Home
Home


