Bar Graph
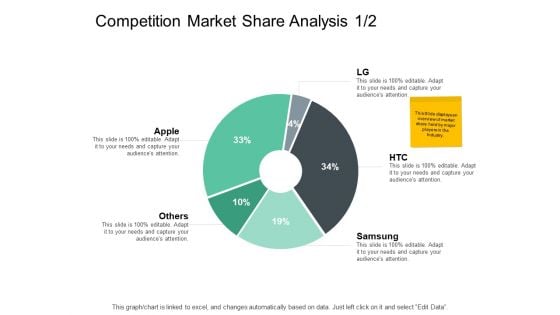
Competition Market Share Analysis Graph Ppt PowerPoint Presentation Infographics Inspiration
Presenting this set of slides with name competition market share analysis graph ppt powerpoint presentation infographics inspiration. The topics discussed in these slides are marketing, business, management, planning, strategy. This is a completely editable PowerPoint presentation and is available for immediate download. Download now and impress your audience.
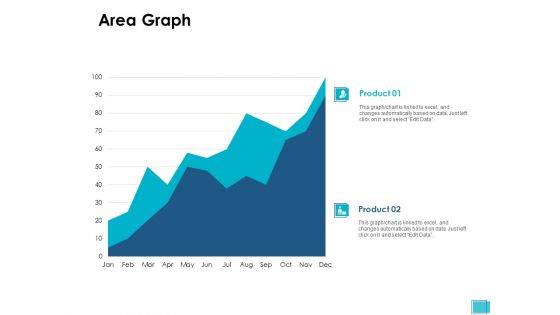
Area Graph Analysis Ppt PowerPoint Presentation Summary Graphics Example
Presenting this set of slides with name area graph analysis ppt powerpoint presentation summary graphics example. The topics discussed in these slides are finance, marketing, management, investment, analysis. This is a completely editable PowerPoint presentation and is available for immediate download. Download now and impress your audience.
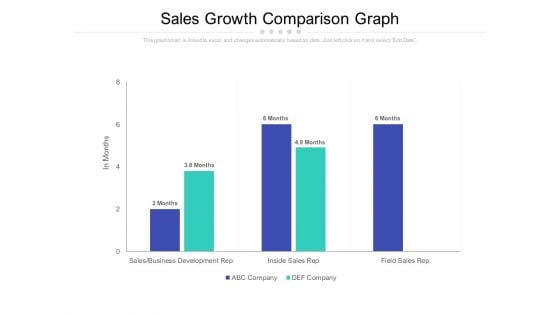
Sales Growth Comparison Graph Ppt PowerPoint Presentation Outline Demonstration
Presenting this set of slides with name sales growth comparison graph ppt powerpoint presentation outline demonstration. The topics discussed in these slides are sales, business development rep, inside sales rep, field sales rep. This is a completely editable PowerPoint presentation and is available for immediate download. Download now and impress your audience.
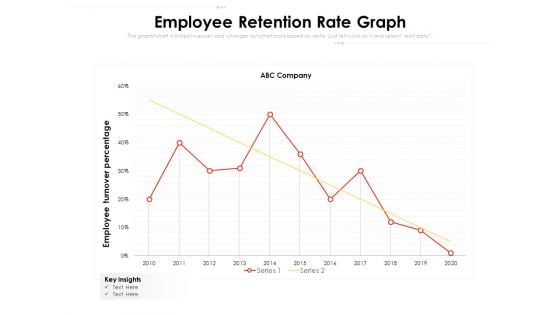
Employee Retention Rate Graph Ppt PowerPoint Presentation Pictures Portrait PDF
Presenting this set of slides with name employee retention rate graph ppt powerpoint presentation pictures portrait pdf. The topics discussed in these slides are key insights, 2010 to 2020, employee turnover percentage. This is a completely editable PowerPoint presentation and is available for immediate download. Download now and impress your audience.

Pie Graph Layer Of Marketing Expenditure Themes PDF
Pitch your topic with ease and precision using this pie graph layer of marketing expenditure themes pdf. This layout presents information on online advertising, trade shows, sales training, catalogs and brochures. It is also available for immediate download and adjustment. So, changes can be made in the color, design, graphics or any other component to create a unique layout.
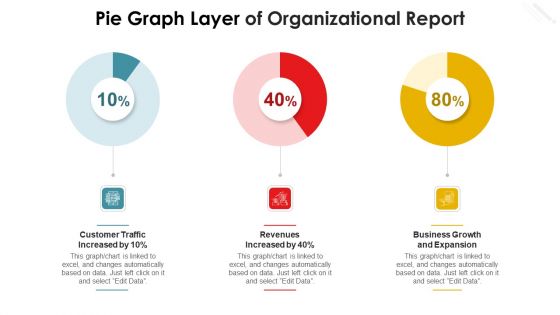
Pie Graph Layer Of Organizational Report Themes PDF
Pitch your topic with ease and precision using this pie graph layer of organizational report themes pdf. This layout presents information on revenues increased by, business growth and expansion, customer traffic increased by. It is also available for immediate download and adjustment. So, changes can be made in the color, design, graphics or any other component to create a unique layout.
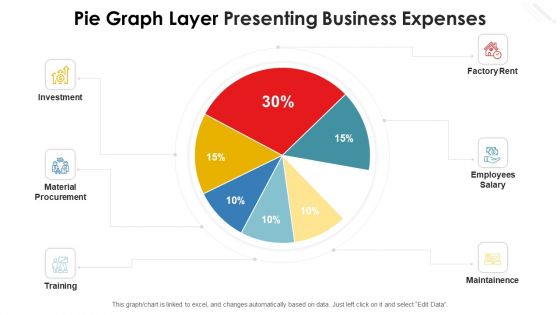
Pie Graph Layer Presenting Business Expenses Topics PDF
Pitch your topic with ease and precision using this pie graph layer presenting business expenses topics pdf. This layout presents information on investment, material procurement, training, employees salary, factory rent. It is also available for immediate download and adjustment. So, changes can be made in the color, design, graphics or any other component to create a unique layout.
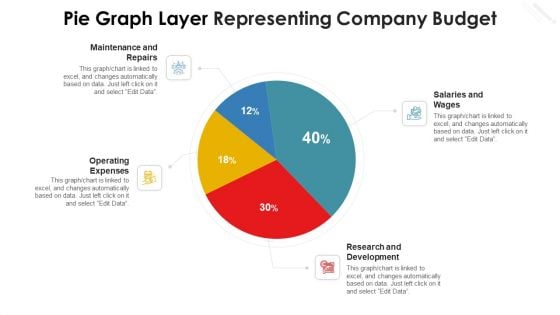
Pie Graph Layer Representing Company Budget Sample PDF
Pitch your topic with ease and precision using this pie graph layer representing company budget sample pdf. This layout presents information on maintenance and repairs, operating expenses, research and development, salaries and wages. It is also available for immediate download and adjustment. So, changes can be made in the color, design, graphics or any other component to create a unique layout.
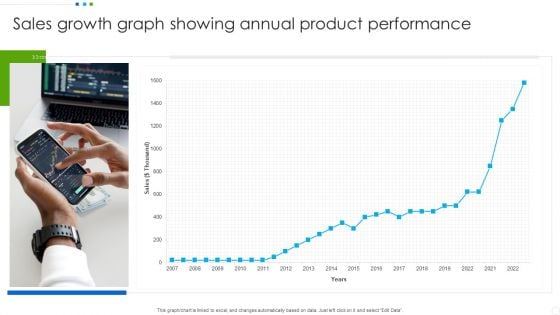
Sales Growth Graph Showing Annual Product Performance Slides PDF
Pitch your topic with ease and precision using this Sales Growth Graph Showing Annual Product Performance Slides PDF. This layout presents information on Sales Growth, Product Performance. It is also available for immediate download and adjustment. So, changes can be made in the color, design, graphics or any other component to create a unique layout.
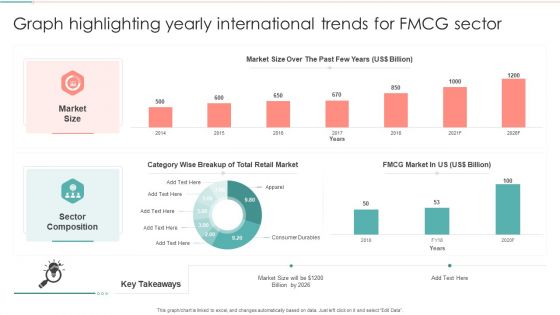
Graph Highlighting Yearly International Trends For FMCG Sector Information PDF
Pitch your topic with ease and precision using this Graph Highlighting Yearly International Trends For FMCG Sector Information PDF. This layout presents information on Sector Composition, Wise Breakup, Retail Market. It is also available for immediate download and adjustment. So, changes can be made in the color, design, graphics or any other component to create a unique layout.
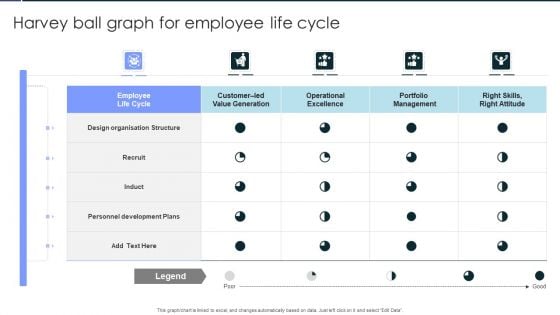
Harvey Ball Graph For Employee Life Cycle Pictures PDF
Pitch your topic with ease and precision using this Harvey Ball Graph For Employee Life Cycle Pictures PDF. This layout presents information on Employee Life Cycle, Design Organisation Structure, Personnel Development Plans . It is also available for immediate download and adjustment. So, changes can be made in the color, design, graphics or any other component to create a unique layout.
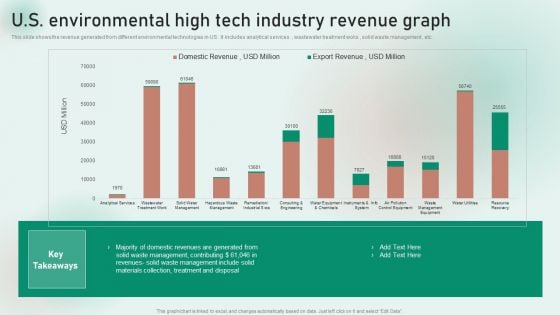
U S Environmental High Tech Industry Revenue Graph Professional PDF
This slide shows the revenue generated from different environmental technologies in US . It includes analytical services , wastewater treatment woks , solid waste management , etc. Showcasing this set of slides titled U S Environmental High Tech Industry Revenue Graph Professional PDF. The topics addressed in these templates are Management, Materials Collection, Revenues. All the content presented in this PPT design is completely editable. Download it and make adjustments in color, background, font etc. as per your unique business setting.
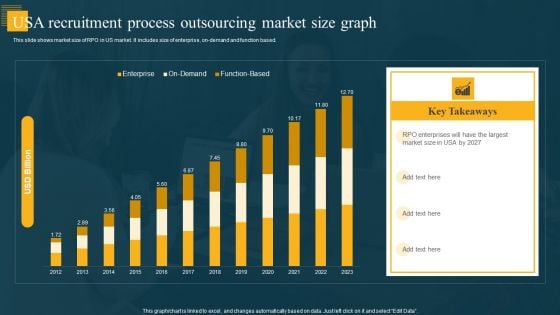
USA Recruitment Process Outsourcing Market Size Graph Topics PDF
This slide shows market size of RPO in US market. It includes size of enterprise, on-demand and function based. Showcasing this set of slides titled USA Recruitment Process Outsourcing Market Size Graph Topics PDF. The topics addressed in these templates are RPO Enterprises, Largest Market Size. All the content presented in this PPT design is completely editable. Download it and make adjustments in color, background, font etc. as per your unique business setting.
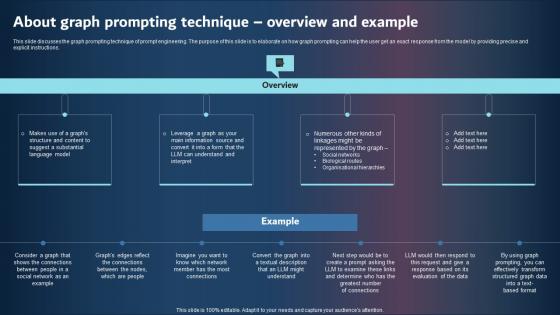
About Graph Prompting Technique Overview And Example Sample PDF
This slide discusses the graph prompting technique of prompt engineering. The purpose of this slide is to elaborate on how graph prompting can help the user get an exact response from the model by providing precise and explicit instructions. Slidegeeks is one of the best resources for PowerPoint templates. You can download easily and regulate About Graph Prompting Technique Overview And Example Sample Pdf for your personal presentations from our wonderful collection. A few clicks is all it takes to discover and get the most relevant and appropriate templates. Use our Templates to add a unique zing and appeal to your presentation and meetings. All the slides are easy to edit and you can use them even for advertisement purposes. This slide discusses the graph prompting technique of prompt engineering. The purpose of this slide is to elaborate on how graph prompting can help the user get an exact response from the model by providing precise and explicit instructions.
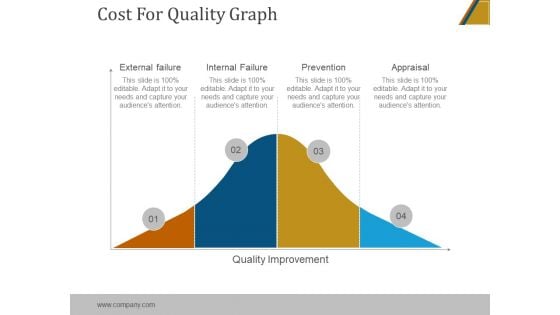
Cost For Quality Graph Ppt PowerPoint Presentation Graphics
This is a cost for quality graph ppt powerpoint presentation graphics. This is a four stage process. The stages in this process are external failure, internal failure, prevention, appraisal, quality improvement.
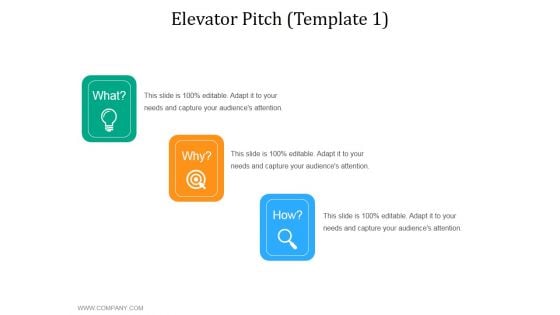
Elevator Pitch Template 1 Ppt PowerPoint Presentation Diagram Graph Charts
This is a elevator pitch template 1 ppt powerpoint presentation diagram graph charts. This is a three stage process. The stages in this process are what, why, how.
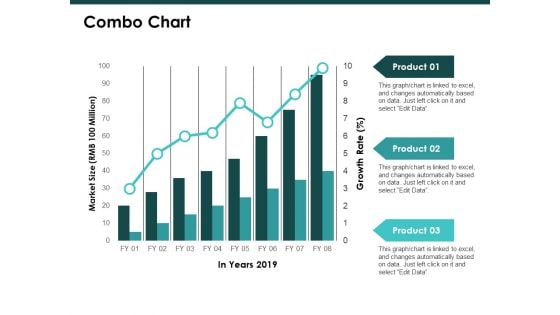
Combo Chart Graph Ppt PowerPoint Presentation Inspiration Template
This is a combo chart graph ppt powerpoint presentation inspiration template. This is a three stage process. The stages in this process are finance, marketing, management, investment, analysis.
Building Graph Business PowerPoint Templates And PowerPoint Backgrounds 0511
Microsoft PowerPoint Template and Background with new brick for business diagram building Execute plans with our Building Graph Business PowerPoint Templates And PowerPoint Backgrounds 0511. Download without worries with our money back guaranteee.
Profit Graph Business PowerPoint Templates And PowerPoint Backgrounds 0711
Microsoft PowerPoint Template and Background with business chart Discover new faith with our Profit Graph Business PowerPoint Templates And PowerPoint Backgrounds 0711. Let extra dimensions in you emerge.

Money Graph Business PowerPoint Templates And PowerPoint Themes 1012
Money Graph Business PowerPoint Templates And PowerPoint Themes 1012-Visually support your Microsoft office PPT Presentation with our above template illustrating rising money chart. This image has been professionally designed to emphasize the business success concept. Our unique image makes your presentations professional showing that you care about even the smallest details. The structure of our templates allows you to effectively highlight the key issues concerning the growth of your business.-Money Graph Business PowerPoint Templates And PowerPoint Themes 1012-This PowerPoint template can be used for presentations relating to-Money graph, business, success, finance, money, marketing Exult in the comfort of our Money Graph Business PowerPoint Templates And PowerPoint Themes 1012. Experience the convenience they deliver.
Arrow Graph Success PowerPoint Templates And PowerPoint Themes 1012
Arrow Graph Success PowerPoint Templates And PowerPoint Themes 1012-This PowerPoint Template shows arrow graph with increase. This image signifies the Financial or Business Growth. The Template assumes business concept. Use this template for Global Business. The structure of our templates allows you to effectively highlight the key issues concerning the growth of your business.-Arrow Graph Success PowerPoint Templates And PowerPoint Themes 1012-This PowerPoint template can be used for presentations relating to-Arrow to success, business, marketing, finance, arrows, success Guard against boring presentations with our Arrow Graph Success PowerPoint Templates And PowerPoint Themes 1012. Try us out and see what a difference our templates make.
Graph Shows Profit Sales PowerPoint Templates And PowerPoint Backgrounds 0711
Microsoft PowerPoint Template and Background with finance concept Paint the canvas with our Graph Shows Profit Sales PowerPoint Templates And PowerPoint Backgrounds 0711. Just download, type and present.
Crisis Graph Ppt Icon For Ppt Templates And Slides Cc
Microsoft PowerPoint Template and Background with business crisis diagram Attack with our Crisis Graph Ppt Icon For Ppt Templates And Slides Cc. You will come out on top.
Graph With Gears Success PowerPoint Templates And PowerPoint Backgrounds 1211
Microsoft PowerPoint Template and Background with business concept Embrace changes with our Graph With Gears Success PowerPoint Templates And PowerPoint Backgrounds 1211. Develop the correct attitude for it.
Business Development Strategy Template 3d Man With Growth Graph Characters
Doll Up Your Thoughts With Our Business Development Strategy Template 3D Man With Growth Graph Characters Powerpoint Templates. They Will Make A Pretty Picture.
Business Development Strategy Template 3d Man With Success Graph Characters
Establish The Dominance Of Your Ideas. Our Business Development Strategy Template 3D Man With Success Graph Characters Powerpoint Templates Will Put Them On Top.

Stock Photo Pie Graph For Business Performance Ppt Template
Our Stock Photo Pie Graph For Business Performance PPT template Powerpoint Templates Allow You To Do It With Ease. Just Like Picking The Low Hanging Fruit.
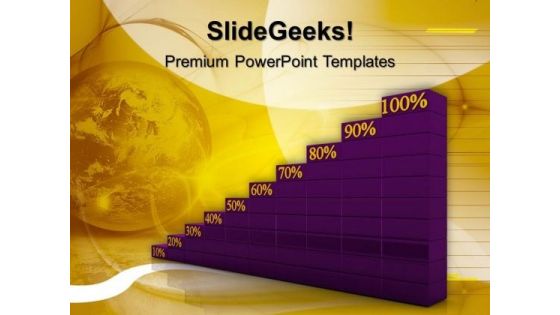
Percentage Graph Progress Business PowerPoint Templates And PowerPoint Themes 1012
Percentage Graph Progress Business PowerPoint Templates And PowerPoint Themes 1012-Using This Beautiful PowerPoint Template you will be able to illustrate the Growth, Progress, development, advancement, improvement, evolution, headway, steps forward, movement, evolvement etc. Our template will help pinpoint their viability. Refine them all as you take them through the numerous filtering stages of the funnel of your quality control process.-Percentage Graph Progress Business PowerPoint Templates And PowerPoint Themes 1012-This PowerPoint template can be used for presentations relating to-Graph Percent Going Up, Success, Business, Finance, Marketing, Money Your address will be the feature. Our Percentage Graph Progress Business PowerPoint Templates And PowerPoint Themes 1012 will ensure the cheers.
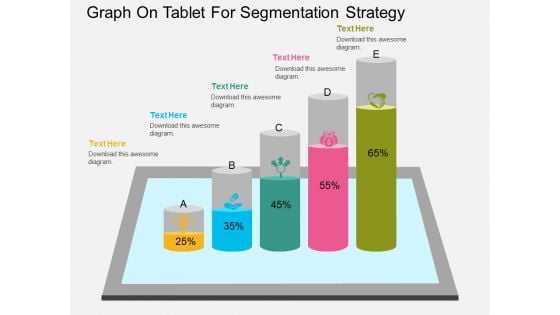
Graph On Tablet For Segmentation Strategy Powerpoint Template
Concept of segmentation strategy can be explained with this diagram. This PowerPoint template contains graph on computer tablet. Download this diagram slide to make interactive presentations.
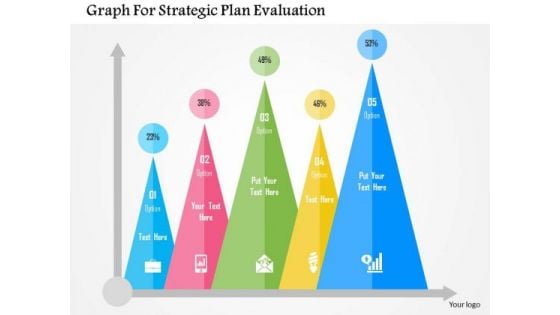
Business Diagram Graph For Strategic Plan Evaluation Presentation Template
Strategic plan evaluation can be explained with this diagram. It contains business statistics graph with icons. Download this diagram slide to make impressive presentations.
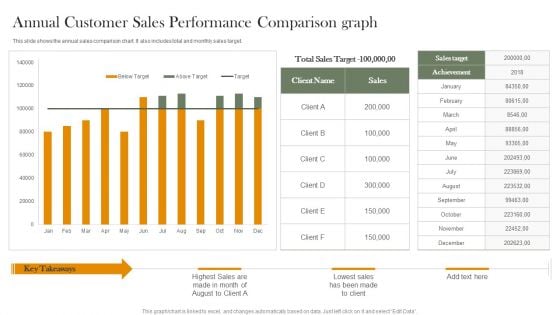
Annual Customer Sales Performance Comparison Graph Portrait PDF
This slide shows the annual sales comparison chart. It also includes total and monthly sales target. Pitch your topic with ease and precision using this Annual Customer Sales Performance Comparison Graph Portrait PDF. This layout presents information on Total Sales Target, Sales Target, Achievement. It is also available for immediate download and adjustment. So, changes can be made in the color, design, graphics or any other component to create a unique layout.
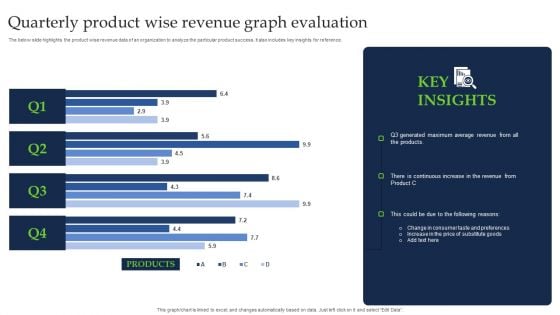
Quarterly Product Wise Revenue Graph Evaluation Brochure PDF
The below slide highlights the product wise revenue data of an organization to analyze the particular product success. It also includes key insights for reference. Pitch your topic with ease and precision using this Quarterly Product Wise Revenue Graph Evaluation Brochure PDF. This layout presents information on Products, Average Revenue. It is also available for immediate download and adjustment. So, changes can be made in the color, design, graphics or any other component to create a unique layout.
Innovative Marketing Concepts 3d Team Around Business Graph Characters
Highlight Your Drive With Our innovative marketing concepts 3d team around business graph characters Powerpoint Templates. Prove The Fact That You Have Control.
Business Growth Strategy 3d Man On Graph Character
Doll Up Your Thoughts With Our business growth strategy 3d man on graph character Powerpoint Templates. They Will Make A Pretty Picture.
Business Growth Strategy 3d Man On Top Of Graph Character
Establish The Dominance Of Your Ideas. Our business growth strategy 3d man on top of graph character Powerpoint Templates Will Put Them On Top.
Business Strategy 3d Successful Man On Graph Concepts
Double The Impact With Our business strategy 3d successful man on graph concepts Powerpoint Templates. Your Thoughts Will Have An Imposing Effect.
Creative Marketing Concepts 3d Man Arrow Graph Characters
Draft It Out On Our creative marketing concepts 3d man arrow graph characters Powerpoint Templates. Give The Final Touches With Your Ideas.
Innovative Marketing Concepts 3d Man Growing Graph Adaptable Business
Add Some Dramatization To Your Thoughts. Our innovative marketing concepts 3d man growing graph adaptable business Powerpoint Templates Make Useful Props.

Business Strategy Execution 3d Man Top Of Graph Character Modeling
Be The Doer With Our business strategy execution 3d man top of graph character modeling Powerpoint Templates. Put Your Thoughts Into Practice.
Business Strategy Implementation 3d Man Rising With Graph Concept
Put In A Dollop Of Our business strategy implementation 3d man rising with graph concept Powerpoint Templates. Give Your Thoughts A Distinctive Flavor.
Business Strategy Implementation 3d Man Running Up Graph Concept
Get The Domestics Right With Our business strategy implementation 3d man running up graph concept Powerpoint Templates. Create The Base For Thoughts To Grow.
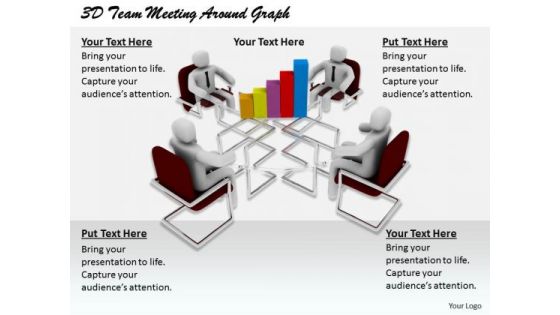
Modern Marketing Concepts 3d Team Meeting Around Graph Characters
Plan For All Contingencies With Our modern marketing concepts 3d team meeting around graph characters Powerpoint Templates. Douse The Fire Before It Catches.
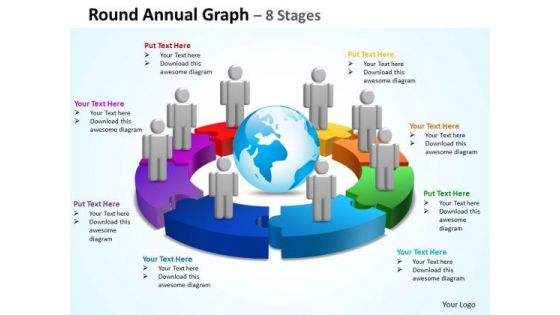
Business Diagram Round Annual Graph 8 Stages Marketing Diagram
Document Your Views On Our Business Diagram Round Annual Graph 8 Stages Marketing Diagram Powerpoint Templates. They Will Create A Strong Impression.
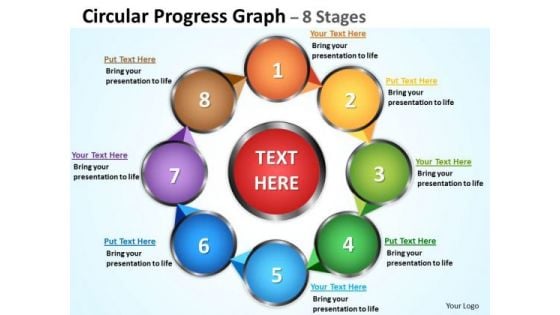
Marketing Diagram Circular Progress Diagrams Graph 8 Stages Strategy Diagram
Get The Doers Into Action. Activate Them With Our Marketing Diagram Circular Progress Diagrams Graph 8 Stages Strategy Diagram Powerpoint Templates.
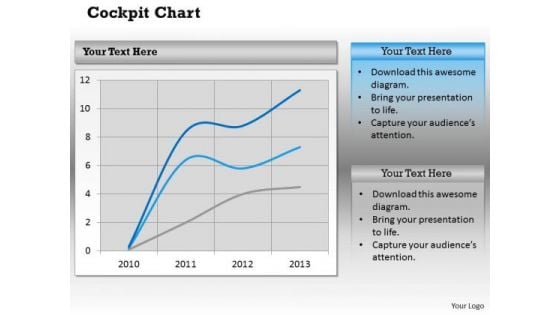
Business Framework Model Buisness Graph Dashboard Style Consulting Diagram
Get Out Of The Dock With Our Business Framework Model Business Graph Dashboard Style Consulting Diagram Powerpoint Templates. Your Mind Will Be Set Free.
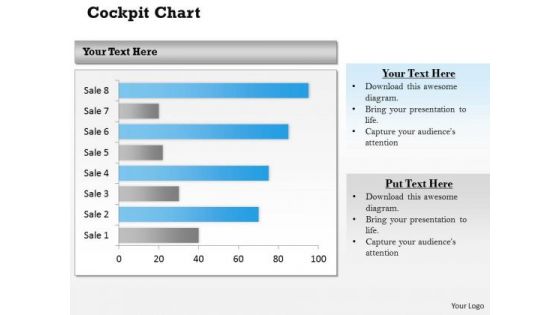
Strategic Management Business Graph Dashboard Layout Business Diagram
Doll Up Your Thoughts With Our Strategic Management Business Graph Dashboard Layout Business Diagram Powerpoint Templates. They Will Make A Pretty Picture.
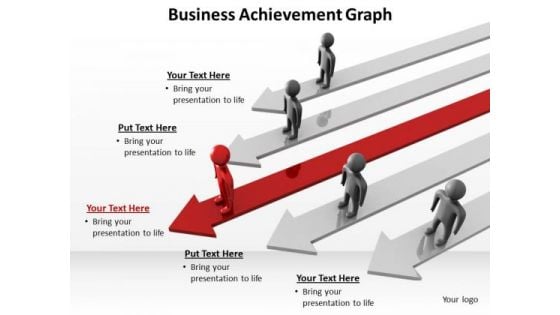
Mba Models And Frameworks Business Achievement Graph Consulting Diagram
Our MBA Models And Frameworks Business Achievement Graph Consulting Diagram Powerpoint Templates And Your Ideas Make A Great Doubles Pair. Play The Net With Assured Hands.
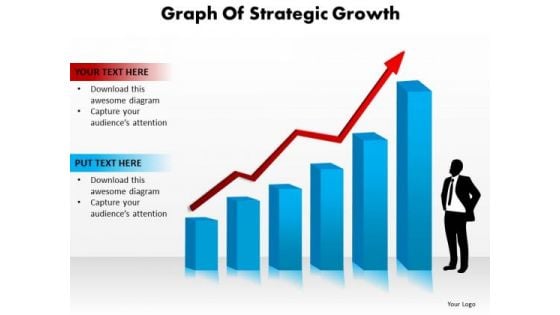
Strategy Diagram Graph Of Strategic Growth Business Cycle Diagram
Our Strategy Diagram Graph Of Strategic Growth Business Cycle Diagram Powerpoint Templates Heighten Concentration. Your Audience Will Be On The Edge.
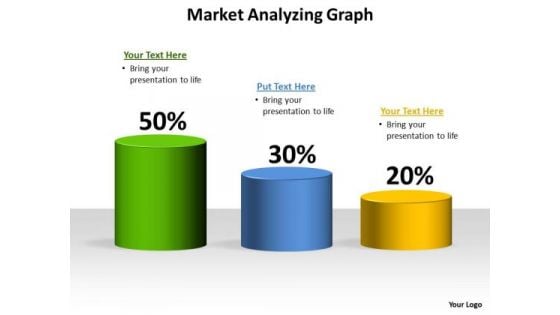
Business Finance Strategy Development Market Analyzing Graph Strategic Management
Establish The Dominance Of Your Ideas. Our Business Finance Strategy Development Market Analyzing Graph Strategic Management Powerpoint Templates Will Put Them On Top.
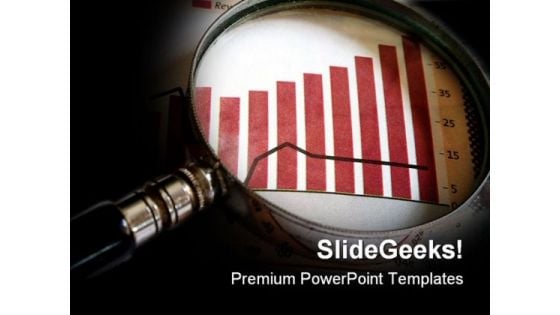
Business Focus Graph Future PowerPoint Backgrounds And Templates 1210
Microsoft PowerPoint Template and Background with a magnifying glass focusing on a chart in the business section of the newspaper Attain promotions with our Business Focus Graph Future PowerPoint Backgrounds And Templates 1210. You will come out on top.
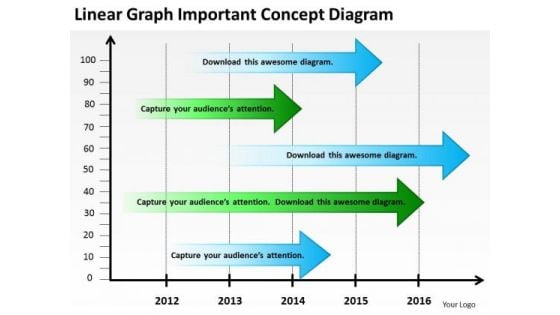
Graph Important Concept Diagram Business Plan Template PowerPoint Templates
We present our graph important concept diagram business plan template PowerPoint templates.Use our Arrows PowerPoint Templates because Watching this your Audience will Grab their eyeballs, they wont even blink. Present our Finance PowerPoint Templates because Our PowerPoint Templates and Slides will Activate the energies of your audience. Get their creative juices flowing with your words. Download our Marketing PowerPoint Templates because Our PowerPoint Templates and Slides are topically designed to provide an attractive backdrop to any subject. Use our Signs PowerPoint Templates because Our PowerPoint Templates and Slides are specially created by a professional team with vast experience. They diligently strive to come up with the right vehicle for your brilliant Ideas. Use our Business PowerPoint Templates because It will get your audience in sync.Use these PowerPoint slides for presentations relating to chart, bar, data, pie, percent, forecasting, economy, white, achievement, future, business, arrow, sign, line, symbol, diagram, styles, finance, stock, report, marketing, gray, analyzing, shape, abstract, graph, modern, economic, up, money, solution, design, making, growth, moving, grid, progress, artistic, profit, inspiration, background, investment, successful, financial, concepts, structure, ideas. The prominent colors used in the PowerPoint template are Blue, Green, Black. Advertise yourbelief in your ability. Our Graph Important Concept Diagram Business Plan Template PowerPoint Templates will help back up your boast.
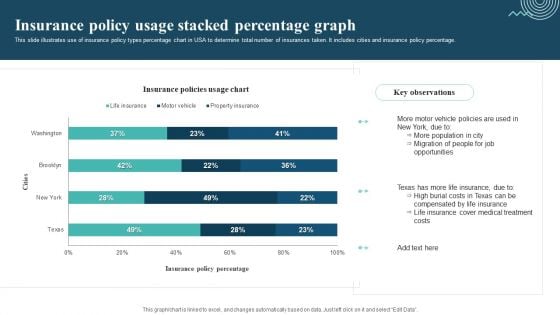
Insurance Policy Usage Stacked Percentage Graph Template PDF
This slide illustrates use of insurance policy types percentage chart in USA to determine total number of insurances taken. It includes cities and insurance policy percentage. Pitch your topic with ease and precision using this Insurance Policy Usage Stacked Percentage Graph Template PDF. This layout presents information on Motor Vehicle Policies, More Population, Migration Of People. It is also available for immediate download and adjustment. So, changes can be made in the color, design, graphics or any other component to create a unique layout.
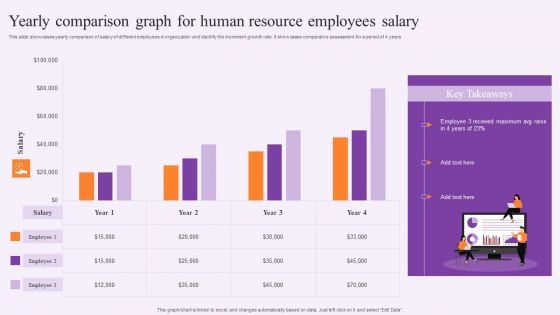
Yearly Comparison Graph For Human Resource Employees Salary Template PDF
This slide showcases yearly comparison of salary of different employees in organization and identify the increment growth rate. It showcases comparative assessment for a period of 4 years. Pitch your topic with ease and precision using this Yearly Comparison Graph For Human Resource Employees Salary Template PDF. This layout presents information on Human Resource, Employees Salary. It is also available for immediate download and adjustment. So, changes can be made in the color, design, graphics or any other component to create a unique layout.
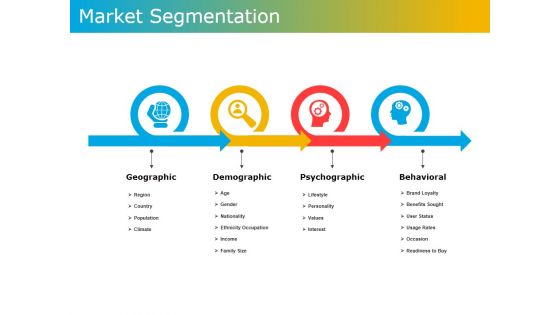
Market Segmentation Ppt PowerPoint Presentation Diagram Graph Charts
This is a market segmentation ppt powerpoint presentation diagram graph charts. This is a four stage process. The stages in this process are geographic, demographic, psychographic, behavioral.
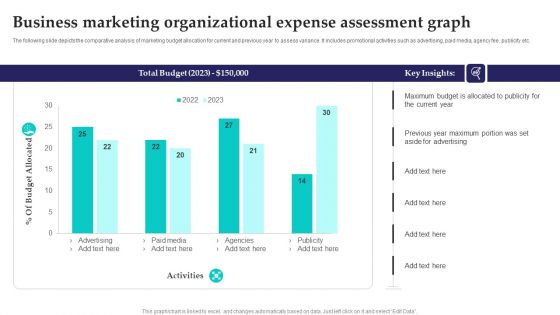
Business Marketing Organizational Expense Assessment Graph Information PDF
The following slide depicts the comparative analysis of marketing budget allocation for current and previous year to assess variance. It includes promotional activities such as advertising, paid media, agency fee, publicity etc. Showcasing this set of slides titled Business Marketing Organizational Expense Assessment Graph Information PDF. The topics addressed in these templates are Paid Media, Advertising, Budget Allocated. All the content presented in this PPT design is completely editable. Download it and make adjustments in color, background, font etc. as per your unique business setting.
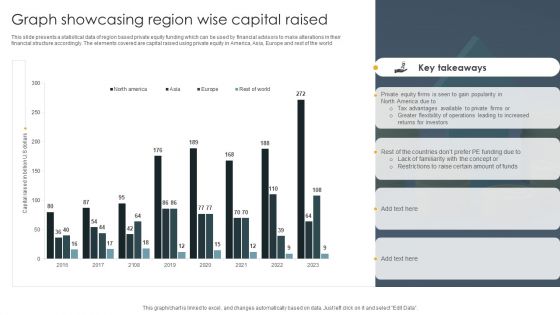
Graph Showcasing Region Wise Capital Raised Demonstration PDF
This slide presents a statistical data of region based private equity funding which can be used by financial advisors to make alterations in their financial structure accordingly. The elements covered are capital raised using private equity in America, Asia, Europe and rest of the world. Showcasing this set of slides titled Graph Showcasing Region Wise Capital Raised Demonstration PDF. The topics addressed in these templates are Investors, Tax Advantages, Private Equity. All the content presented in this PPT design is completely editable. Download it and make adjustments in color, background, font etc. as per your unique business setting.
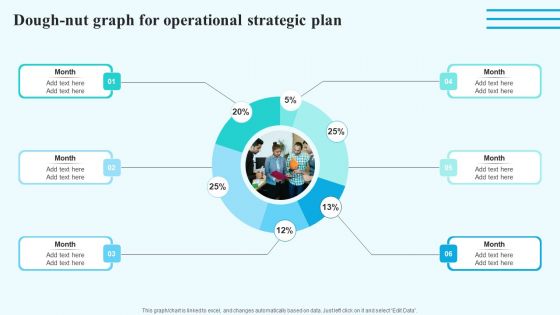
Dough Nut Graph For Operational Strategic Plan Information PDF
Are you in need of a template that can accommodate all of your creative concepts This one is crafted professionally and can be altered to fit any style. Use it with Google Slides or PowerPoint. Include striking photographs, symbols, depictions, and other visuals. Fill, move around, or remove text boxes as desired. Test out color palettes and font mixtures. Edit and save your work, or work with colleagues. Download Dough Nut Graph For Operational Strategic Plan Information PDF and observe how to make your presentation outstanding. Give an impeccable presentation to your group and make your presentation unforgettable.
Diminishing Graph And Chart Icon With Arrow Sign Clipart PDF
Presenting Diminishing Graph And Chart Icon With Arrow Sign Clipart PDF to dispense important information. This template comprises four stages. It also presents valuable insights into the topics including Diminishing Graph, Chart Icon With Arrow Sign. This is a completely customizable PowerPoint theme that can be put to use immediately. So, download it and address the topic impactfully.
Breakdown By Area In Pie Chart And Graph Introduction PDF
Showcasing this set of slides titled Breakdown By Area In Pie Chart And Graph Introduction PDF. The topics addressed in these templates are Break Down, Area Pie, Chart Graph. All the content presented in this PPT design is completely editable. Download it and make adjustments in color, background, font etc. as per your unique business setting.
Direct Sales Lead Ppt Powerpoint Presentation Diagram Graph Charts Cpb
This is a direct sales lead ppt powerpoint presentation diagram graph charts cpb. This is a two stage process. The stages in this process are direct sales lead.


 Continue with Email

 Home
Home


