Bar Graphics
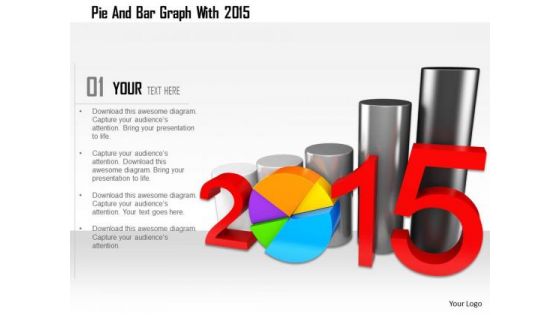
Stock Photo Pie And Bar Graph With 2015 PowerPoint Slide
This Power Point image template slide has been crafted with graphic of pie and bar graph and 2015 year text. This PPT slide contains the concept of business and financial analysis. Use this image slide and build quality presentation for your viewers.
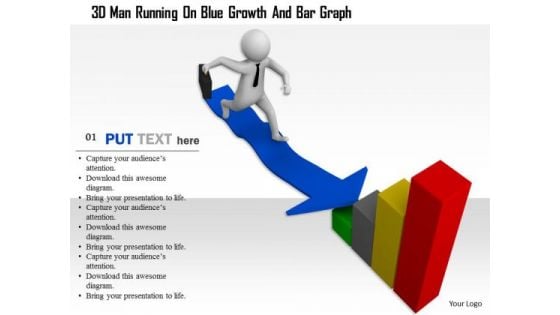
3d Man Running On Blue Growth And Bar Graph
This image slide has been designed with graphic of 3d man on blue arrow moving towards bar graph. This professional slide contains the concept of growth and success. Use this editable slide to depict business growth.
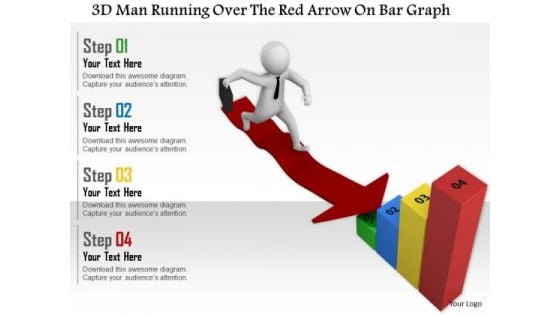
3d Man Running Over The Red Arrow On Bar Graph
This image slide has been designed with graphic of 3d man on red arrow moving towards bar graph. This professional slide contains the concept of growth and success. Use this editable slide to depict business growth.
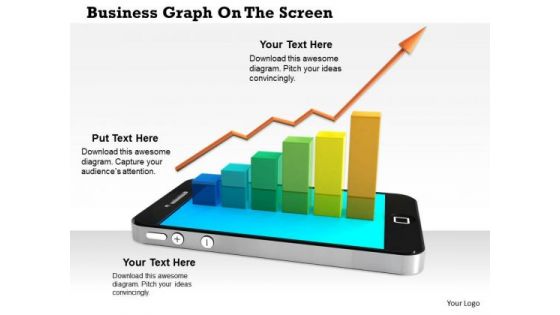
Stock Photo Arrow Growth Bar Graph On Phone Pwerpoint Slide
This graphic image has been designed with graphic of smart phone with growth bar graph. This image contains the concept of business growth analysis. Use this image for business and marketing related analysis presentations. Display finance growth analysis in an graphical way with this exclusive image.
Digital Transformation Icon With Bar Graph Mockup PDF
Presenting digital transformation icon with bar graph mockup pdf to provide visual cues and insights. Share and navigate important information on three stages that need your due attention. This template can be used to pitch topics like digital transformation icon with bar graph. In addtion, this PPT design contains high resolution images, graphics, etc, that are easily editable and available for immediate download.
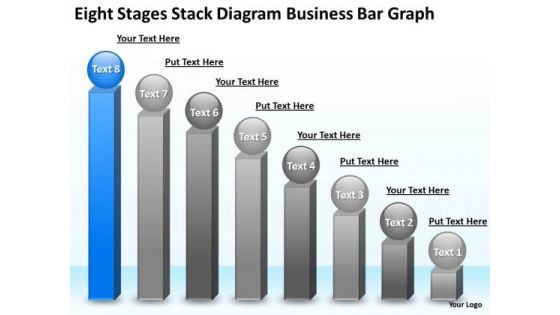
Business PowerPoint Presentation Bar Graph Constructing Plan Templates
We present our business powerpoint presentation bar graph constructing plan templates.Present our Business PowerPoint Templates because Our PowerPoint Templates and Slides will embellish your thoughts. See them provide the desired motivation to your team. Present our Spheres PowerPoint Templates because Our PowerPoint Templates and Slides are Clear and concise. Use them and dispel any doubts your team may have. Use our Competition PowerPoint Templates because You should Bet on your luck with our PowerPoint Templates and Slides. Be assured that you will hit the jackpot. Download our Shapes PowerPoint Templates because Our PowerPoint Templates and Slides will let Your superior ideas hit the target always and everytime. Download our Success PowerPoint Templates because You can Create a matrix with our PowerPoint Templates and Slides. Feel the strength of your ideas click into place.Use these PowerPoint slides for presentations relating to bar, graph, statistics, economy, render, success, representation, diagram, graphic, achievment, obstruction, chevron, accounting, finances, energy eco, steps, figure, tall, barrier, strategy, ladder, up, planning, high, climb, stripes, growth, maintenance, profit, successful, repair, return, gradient, sustainability, financial, construction, upwards, increasing. The prominent colors used in the PowerPoint template are Blue, Gray, White. Our Business PowerPoint Presentation Bar Graph Constructing Plan Templates deliver the bounty you deserve. Earn ample dividends from your efforts.
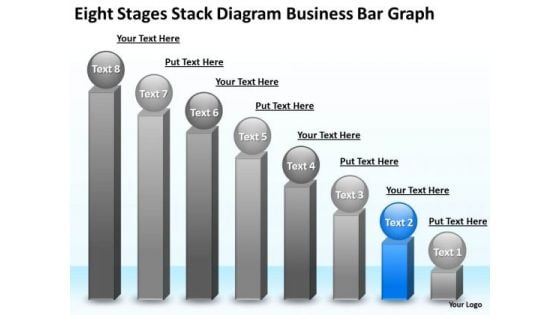
Business PowerPoint Presentation Bar Graph Strategic Planning Slides
We present our business powerpoint presentation bar graph strategic planning Slides.Download and present our Business PowerPoint Templates because Our PowerPoint Templates and Slides will let Your superior ideas hit the target always and everytime. Use our Spheres PowerPoint Templates because They will Put the wind in your sails. Skim smoothly over the choppy waters of the market. Present our Competition PowerPoint Templates because Our PowerPoint Templates and Slides will Embellish your thoughts. They will help you illustrate the brilliance of your ideas. Download and present our Shapes PowerPoint Templates because Our PowerPoint Templates and Slides will give you great value for your money. Be assured of finding the best projection to highlight your words. Download our Success PowerPoint Templates because Our PowerPoint Templates and Slides will effectively help you save your valuable time. They are readymade to fit into any presentation structure. Use these PowerPoint slides for presentations relating to bar, graph, statistics, economy, render, success, representation, diagram, graphic, achievment, obstruction, chevron, accounting, finances, energy eco, steps, figure, tall, barrier, strategy, ladder, up, planning, high, climb, stripes, growth, maintenance, profit, successful, repair, return, gradient, sustainability, financial, construction, upwards, increasing. The prominent colors used in the PowerPoint template are Blue, Gray, White. Meet your audience on equal terms. Level the field with our Business PowerPoint Presentation Bar Graph Strategic Planning Slides.
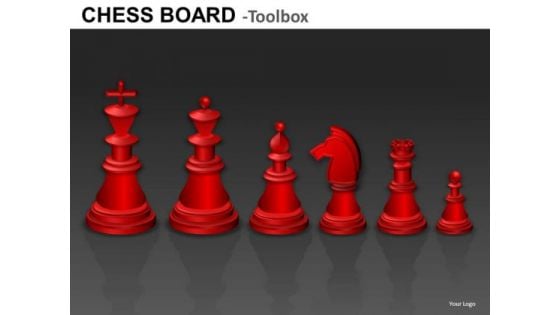
Chess Pieces Graphics
Chess Pieces GraphicsThese high quality powerpoint pre-designed slides and powerpoint templates have been carefully created by our professional team to help you impress your audience. All slides have been created and are 100% editable in powerpoint. Each and every property of any graphic - color, size, orientation, shading, outline etc. can be modified to help you build an effective powerpoint presentation. Any text can be entered at any point in the powerpoint template or slide. Simply DOWNLOAD, TYPE and PRESENT! Counsel them on the need for ethics. Our Chess Pieces Graphics can be very convincing.
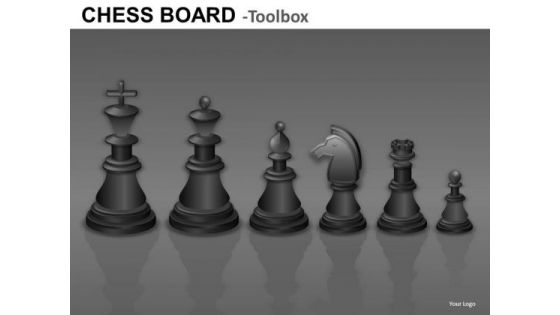
Black Chess Pieces Graphics
Black Chess Pieces GraphicsThese high quality powerpoint pre-designed slides and powerpoint templates have been carefully created by our professional team to help you impress your audience. All slides have been created and are 100% editable in powerpoint. Each and every property of any graphic - color, size, orientation, shading, outline etc. can be modified to help you build an effective powerpoint presentation. Any text can be entered at any point in the powerpoint template or slide. Simply DOWNLOAD, TYPE and PRESENT! Endure setbacks with our Black Chess Pieces Graphics. Download without worries with our money back guaranteee.
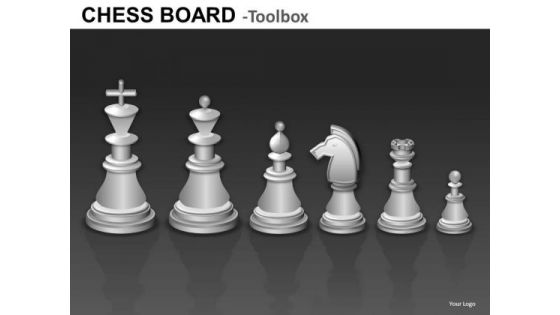
White Chess Pieces Graphics
White Chess Pieces GraphicsThese high quality powerpoint pre-designed slides and powerpoint templates have been carefully created by our professional team to help you impress your audience. All slides have been created and are 100% editable in powerpoint. Each and every property of any graphic - color, size, orientation, shading, outline etc. can be modified to help you build an effective powerpoint presentation. Any text can be entered at any point in the powerpoint template or slide. Simply DOWNLOAD, TYPE and PRESENT! Test boundaries of presenting with our White Chess Pieces Graphics. Download without worries with our money back guaranteee.
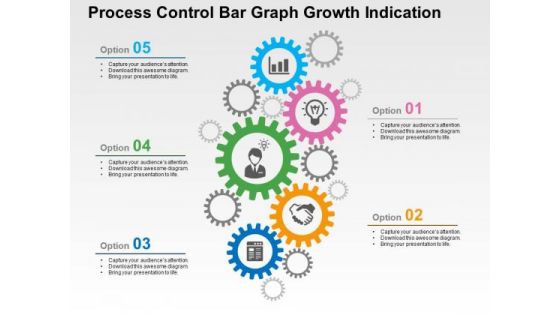
Process Control Bar Graph Growth Indication PowerPoint Template
Download our business slide with gear graphics to convincingly convey your important ideas in presentations. It also contains graphics of business icons. Create captivating presentations using this template
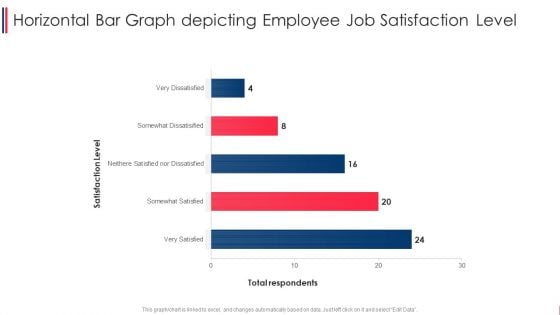
Horizontal Bar Graph Depicting Employee Job Satisfaction Level Summary PDF
Pitch your topic with ease and precision using this horizontal bar graph depicting employee job satisfaction level summary pdf. This layout presents information on horizontal bar graph depicting employee job satisfaction level. It is also available for immediate download and adjustment. So, changes can be made in the color, design, graphics or any other component to create a unique layout.
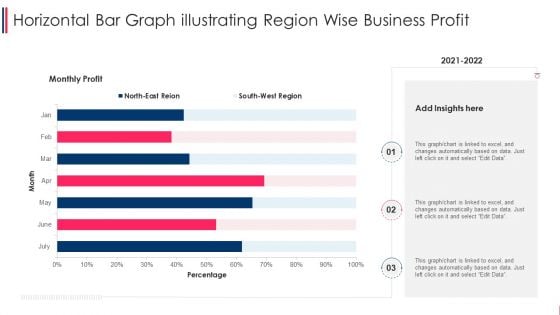
Horizontal Bar Graph Illustrating Region Wise Business Profit Microsoft PDF
Pitch your topic with ease and precision using this horizontal bar graph illustrating region wise business profit microsoft pdf. This layout presents information on horizontal bar graph illustrating region wise business profit. It is also available for immediate download and adjustment. So, changes can be made in the color, design, graphics or any other component to create a unique layout.
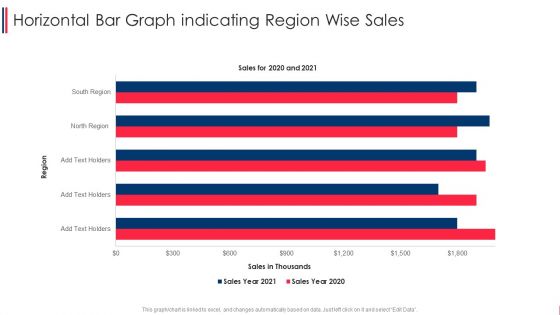
Horizontal Bar Graph Indicating Region Wise Sales Formats PDF
Pitch your topic with ease and precision using this horizontal bar graph indicating region wise sales formats pdf. This layout presents information on horizontal bar graph indicating region wise sales. It is also available for immediate download and adjustment. So, changes can be made in the color, design, graphics or any other component to create a unique layout.
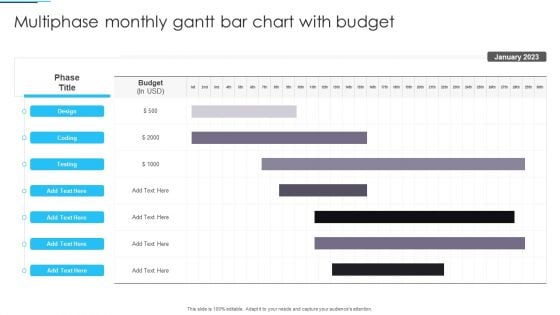
Multiphase Monthly Gantt Bar Chart With Budget Clipart PDF
Pitch your topic with ease and precision using this Multiphase Monthly Gantt Bar Chart With Budget Clipart PDF. This layout presents information on Gantt Bar Chart, Budget. It is also available for immediate download and adjustment. So, changes can be made in the color, design, graphics or any other component to create a unique layout.
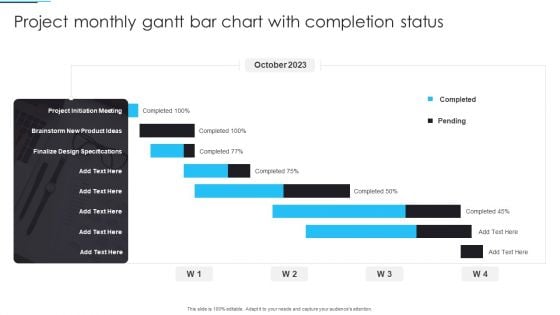
Project Monthly Gantt Bar Chart With Completion Status Infographics PDF
Pitch your topic with ease and precision using this Project Monthly Gantt Bar Chart With Completion Status Infographics PDF. This layout presents information on Project, Monthly Gantt Bar Chart. It is also available for immediate download and adjustment. So, changes can be made in the color, design, graphics or any other component to create a unique layout.
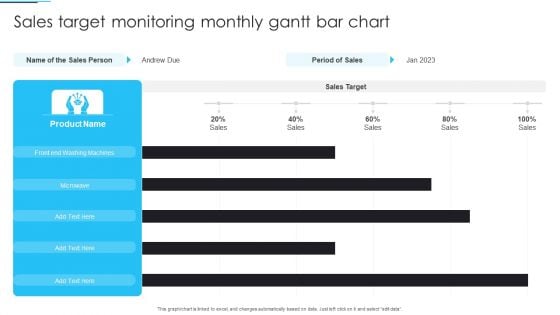
Sales Target Monitoring Monthly Gantt Bar Chart Ideas PDF
Pitch your topic with ease and precision using this Sales Target Monitoring Monthly Gantt Bar Chart Ideas PDF. This layout presents information on Sales Target Monitoring, Monthly Gantt Bar Chart. It is also available for immediate download and adjustment. So, changes can be made in the color, design, graphics or any other component to create a unique layout.
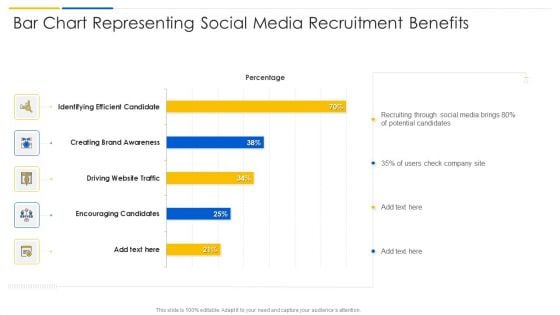
Bar Chart Representing Social Media Recruitment Benefits Infographics PDF
Pitch your topic with ease and precision using this bar chart representing social media recruitment benefits infographics pdf. This layout presents information on encouraging candidates, driving website traffic, creating brand awareness. It is also available for immediate download and adjustment. So, changes can be made in the color, design, graphics or any other component to create a unique layout.
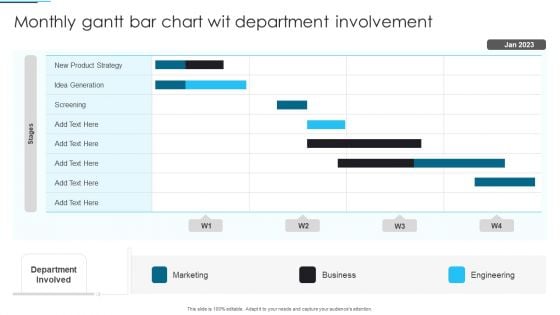
Monthly Gantt Bar Chart Wit Department Involvement Inspiration PDF
Pitch your topic with ease and precision using this Monthly Gantt Bar Chart Wit Department Involvement Inspiration PDF. This layout presents information on Product Strategy, Business, Marketing. It is also available for immediate download and adjustment. So, changes can be made in the color, design, graphics or any other component to create a unique layout.
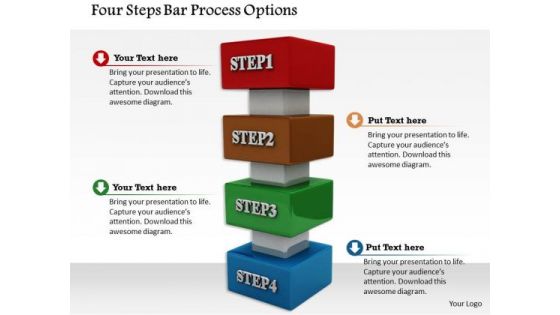
Stock Photo Four Steps Bar Process Options PowerPoint Slide
This image slide is designed with graphics of four steps. This image contains colorful text boxes depicting four steps. This image may be used to describe steps in a business process. Use this image slide to make outstanding presentations.
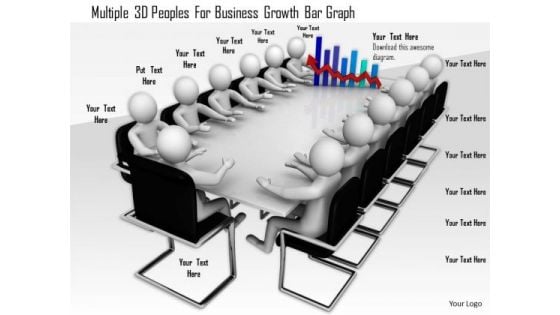
Multiple 3d Peoples For Business Growth Bar Graph
This image slide displays graphics of team meeting. This conceptual image depicts discussion on business facts and figures. Use this diagram slide to build presentation on business planning and teamwork related topics.

Carbon Emissions Of Countries Bar Graph Professional PDF
This slide depicts emissions chart of various countries to avoid the worst impacts of climate change. It includes countries and carbon emissions in million metric tons. Pitch your topic with ease and precision using this Carbon Emissions Of Countries Bar Graph Professional PDF. This layout presents information on Maximum Production, Consumer Goods, Carbon Emissions. It is also available for immediate download and adjustment. So, changes can be made in the color, design, graphics or any other component to create a unique layout.
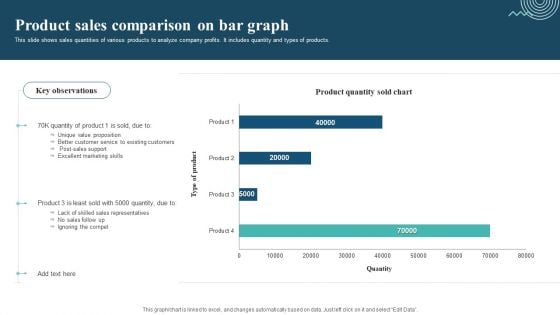
Product Sales Comparison On Bar Graph Sample PDF
This slide shows sales quantities of various products to analyze company profits. It includes quantity and types of products. Pitch your topic with ease and precision using this Product Sales Comparison On Bar Graph Sample PDF. This layout presents information on Unique Value Proposition, Excellent Marketing Skills, Ignoring The Compet. It is also available for immediate download and adjustment. So, changes can be made in the color, design, graphics or any other component to create a unique layout.
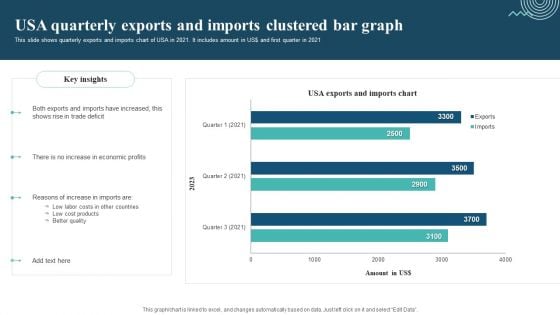
Usa Quarterly Exports And Imports Clustered Bar Graph Designs PDF
This slide shows quarterly exports and imports chart of USA in 2021. It includes amount in US dollar and first quarter in 2021. Pitch your topic with ease and precision using this Usa Quarterly Exports And Imports Clustered Bar Graph Designs PDF. This layout presents information on Exports And Imports, Trade Deficit, Economic Profits. It is also available for immediate download and adjustment. So, changes can be made in the color, design, graphics or any other component to create a unique layout.

Monthly Gantt Bar Chart Ppt PowerPoint Presentation Complete With Slides
Improve your presentation delivery using this Monthly Gantt Bar Chart Ppt PowerPoint Presentation Complete With Slides. Support your business vision and objectives using this well-structured PPT deck. This template offers a great starting point for delivering beautifully designed presentations on the topic of your choice. Comprising tweleve this professionally designed template is all you need to host discussion and meetings with collaborators. Each slide is self-explanatory and equipped with high-quality graphics that can be adjusted to your needs. Therefore, you will face no difficulty in portraying your desired content using this PPT slideshow. This PowerPoint slideshow contains every important element that you need for a great pitch. It is not only editable but also available for immediate download and utilization. The color, font size, background, shapes everything can be modified to create your unique presentation layout. Therefore, download it now.

Bar Graph Ppt PowerPoint Presentation Complete Deck With Slides
Improve your presentation delivery using this Bar Graph Ppt PowerPoint Presentation Complete Deck With Slides. Support your business vision and objectives using this well structured PPT deck. This template offers a great starting point for delivering beautifully designed presentations on the topic of your choice. Comprising Sixteen this professionally designed template is all you need to host discussion and meetings with collaborators. Each slide is self explanatory and equipped with high quality graphics that can be adjusted to your needs. Therefore, you will face no difficulty in portraying your desired content using this PPT slideshow. This PowerPoint slideshow contains every important element that you need for a great pitch. It is not only editable but also available for immediate download and utilization. The color, font size, background, shapes everything can be modified to create your unique presentation layout. Therefore, download it now.
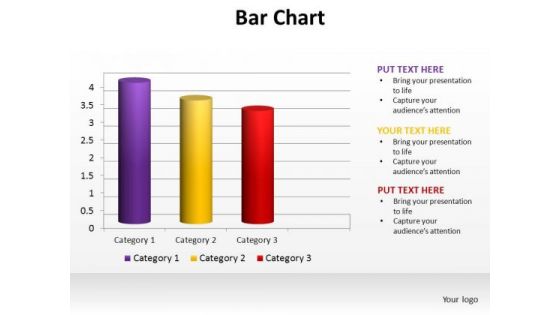
PowerPoint Slide Designs Data Driven Bar Chart Ppt Template
PowerPoint Slide Designs Data Driven Bar Chart PPT Template-These high quality powerpoint pre-designed slides and powerpoint templates have been carefully created by our professional team to help you impress your audience. All slides have been created and are 100% editable in powerpoint. Each and every property of any graphic - color, size, orientation, shading, outline etc. can be modified to help you build an effective powerpoint presentation. Any text can be entered at any point in the powerpoint template or slide. Simply DOWNLOAD, TYPE and PRESENT! Engineering changes is easier with our PowerPoint Slide Designs Data Driven Bar Chart Ppt Template. They enhance the chances of acceptance.
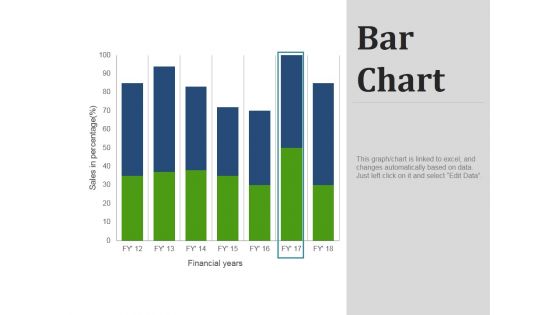
Bar Chart Ppt PowerPoint Presentation Visual Aids Files
This is a bar chart ppt powerpoint presentation visual aids files. This is a seven stage process. The stages in this process are bar, graph, finance, business, marketing.
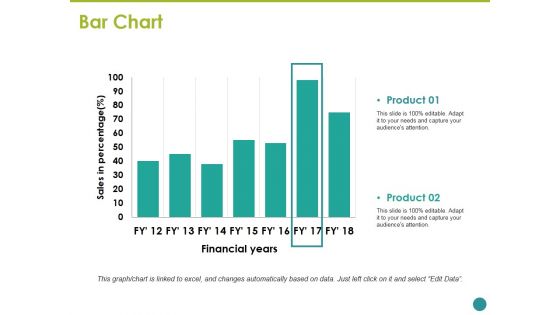
Bar Chart Ppt PowerPoint Presentation Visual Aids Slides
This is a bar chart ppt powerpoint presentation visual aids slides. This is a seven stage process. The stages in this process are bar, marketing, strategy, planning, finance.
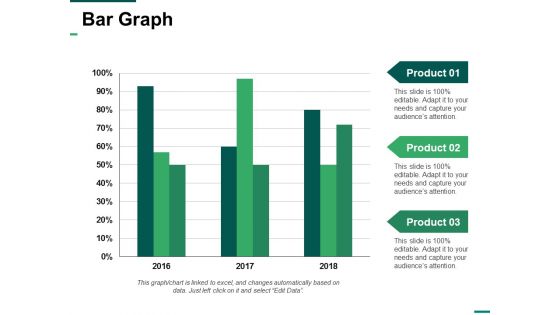
Bar Graph Ppt PowerPoint Presentation Styles Visual Aids
This is a bar graph ppt powerpoint presentation styles visual aids. This is a three stage process. The stages in this process are bar, marketing, strategy, finance, planning.
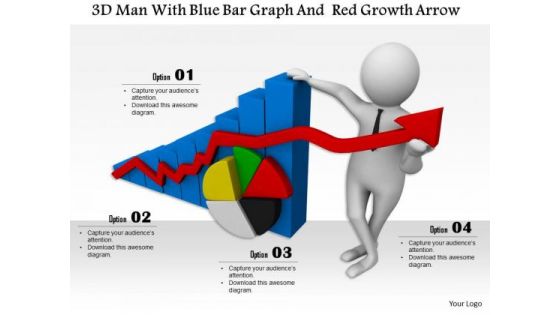
3d Man With Blue Bar Graph And Red Growth Arrow
This Power Point diagram has been designed with graphic of 3d man and business graphs. This conceptual image can be used to displays business progress and growth. Use this editable slide for business and sales growth related presentations.
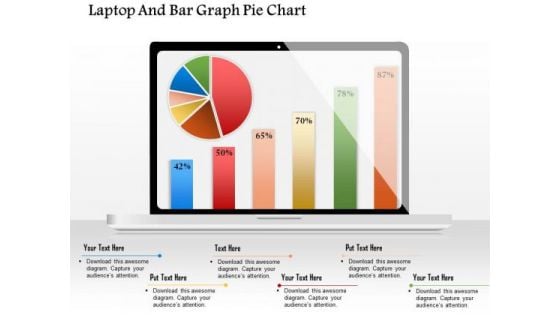
Business Diagram Laptop And Bar Graph Pie Chart Presentation Template
This Power Point template has been designed with graphic of target dart. This PPT diagram contains the concept of information communication. Use this PPT in your business communication related presentations.
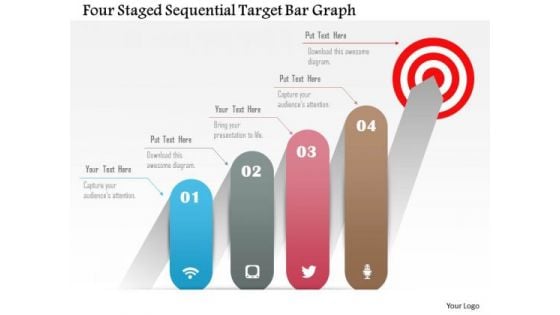
Business Diagram Four Staged Sequential Target Bar Graph Presentation Template
This business diagram has been designed with graphic of four steps towards target achievement. Use this diagram, in your presentations to express views on strategies, policies, success, achievements and opportunities. Create professional presentations using this diagram slide.
Business Diagram Two Bar Icons For Battery Charging Presentation Template
This business diagram has been designed with graphic of two icons for battery charging. This diagram contains the concept energy conservation. Download this diagram to build an exclusive presentation for your views.
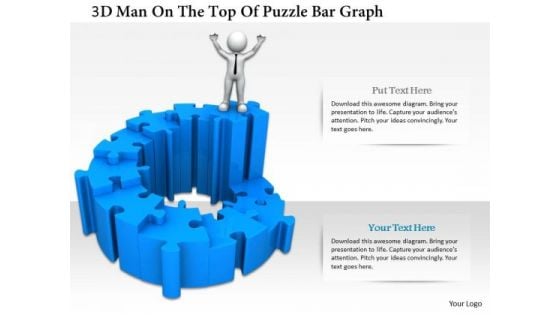
3d Man On The Top Of Puzzle Bar Graph
This PPT has been designed with graphic of 3d man and puzzle are graph. This PPT displays the concept of result analysis and financial growth. Use this PPT for your business and finance related presentations.
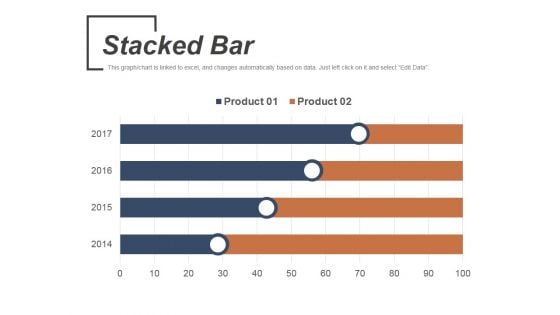
Stacked Bar Template 1 Ppt PowerPoint Presentation Infographic Template Format
This is a stacked bar template 1 ppt powerpoint presentation infographic template format. This is a four stage process. The stages in this process are product, stacked bar, business, marketing, bar graph.
Clustered Bar Ppt PowerPoint Presentation Icon Design Ideas
This is a clustered bar ppt powerpoint presentation icon design ideas. This is a three stage process. The stages in this process are product, unit count, clustered bar.
Clustered Bar Ppt PowerPoint Presentation Icon Example File
This is a clustered bar ppt powerpoint presentation icon example file. This is a three stage process. The stages in this process are product, clustered bar, business.
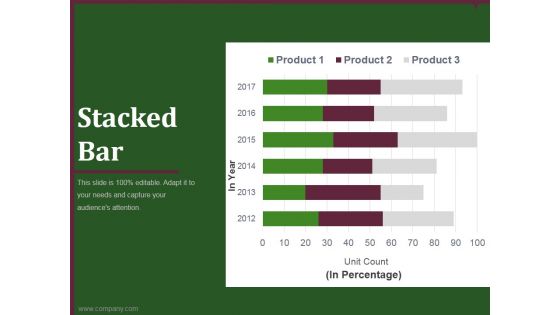
Stacked Bar Template 1 Ppt PowerPoint Presentation Inspiration
This is a stacked bar template 1 ppt powerpoint presentation inspiration. This is a six stage process. The stages in this process are bar, graph, business, marketing, strategy.
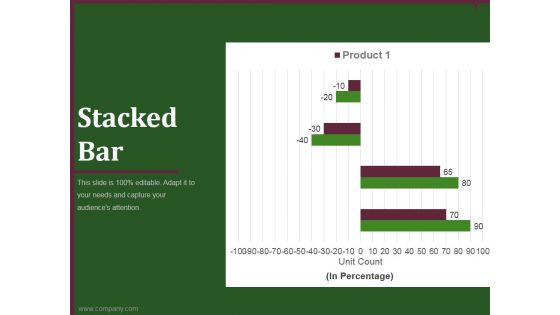
Stacked Bar Template 2 Ppt PowerPoint Presentation Themes
This is a stacked bar template 2 ppt powerpoint presentation themes. This is a four stage process. The stages in this process are bar, graph, business, marketing, strategy.
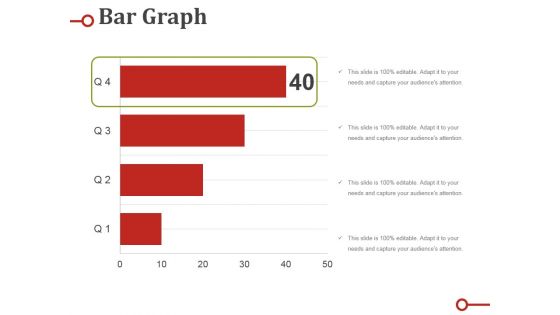
Bar Graph Ppt PowerPoint Presentation Portfolio Design Templates
This is a bar graph ppt powerpoint presentation portfolio design templates. This is a four stage process. The stages in this process are business, marketing, bar, graph, finance.
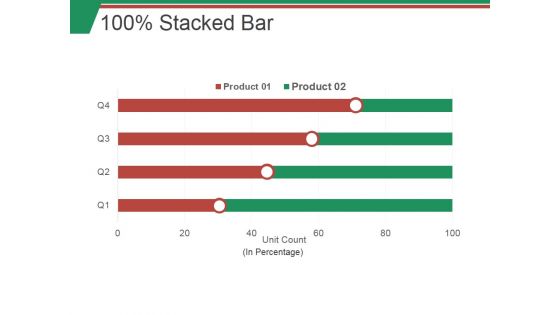
100 Stacked Bar Ppt PowerPoint Presentation Slides Skills
This is a 100 stacked bar ppt powerpoint presentation slides skills. This is a four stage process. The stages in this process are business, marketing, bar, finance, strategy.
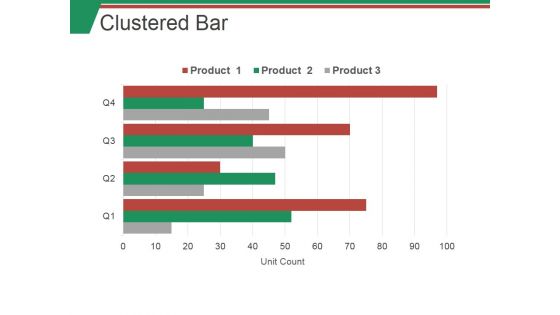
Clustered Bar Ppt PowerPoint Presentation Infographic Template Guidelines
This is a clustered bar ppt powerpoint presentation infographic template guidelines. This is a four stage process. The stages in this process are business, marketing, bar, finance, strategy.
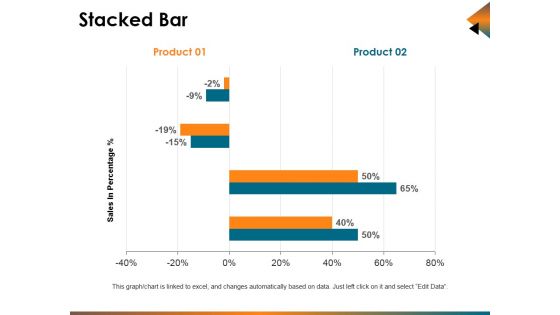
Stacked Bar Ppt PowerPoint Presentation Summary File Formats
This is a stacked bar ppt powerpoint presentation summary file formats. This is a four stage process. The stages in this process are business, marketing, finance, bar, analysis.
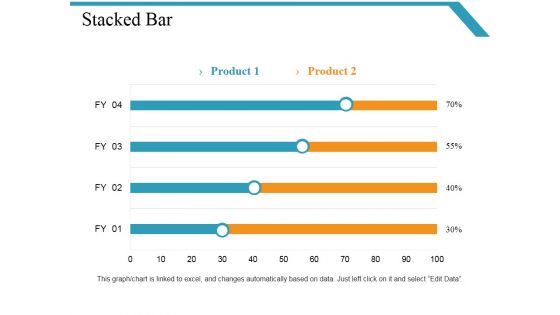
Stacked Bar Template Ppt PowerPoint Presentation Styles Show
This is a stacked bar template ppt powerpoint presentation styles show. This is a four stage process. The stages in this process are business, marketing, finance, bar, graph.
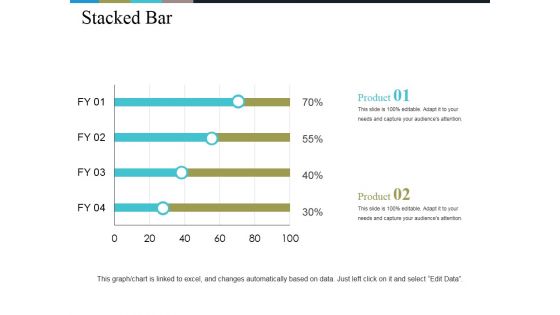
Stacked Bar Ppt PowerPoint Presentation Gallery Example Introduction
This is a stacked bar ppt powerpoint presentation gallery example introduction. This is a two stage process. The stages in this process are bar, percentage, business, marketing, finance.
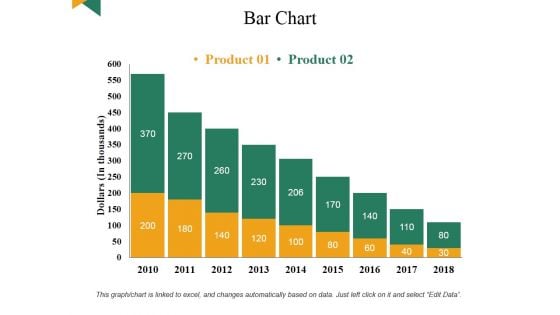
Bar Chart Ppt PowerPoint Presentation Infographic Template Portfolio
This is a bar chart ppt powerpoint presentation infographic template portfolio. This is a two stage process. The stages in this process are bar, strategy, finance, marketing, planning.
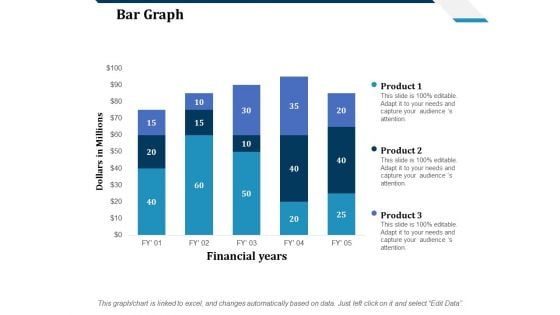
Bar Graph Ppt PowerPoint Presentation Ideas Design Inspiration
This is a bar graph ppt powerpoint presentation ideas design inspiration. This is a five stage process. The stages in this process are bar, marketing, strategy, planning, finance.
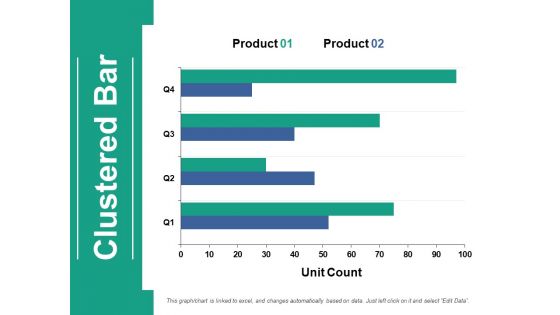
Clustered Bar Ppt PowerPoint Presentation Infographic Template Examples
This is a clustered bar ppt powerpoint presentation infographic template examples. This is a two stage process. The stages in this process are clustered bar, product, unit count.
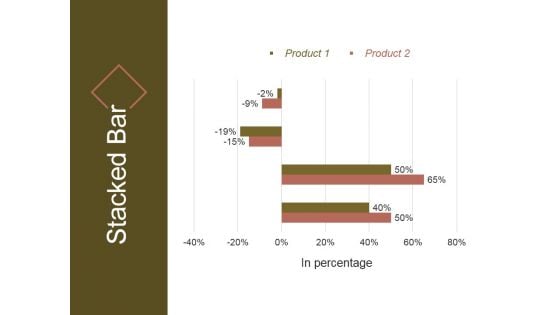
Stacked Bar Template 2 Ppt PowerPoint Presentation Pictures
This is a stacked bar template 2 ppt powerpoint presentation pictures. This is a four stage process. The stages in this process are in percentage, product, stacked bar.
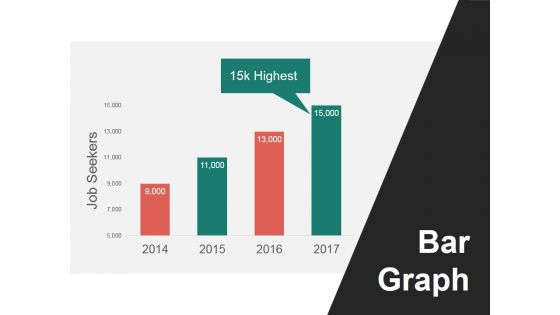
Bar Graph Ppt PowerPoint Presentation Model Slide Download
This is a bar graph ppt powerpoint presentation model slide download. This is a four stage process. The stages in this process are job seekers, bar graph, highest.
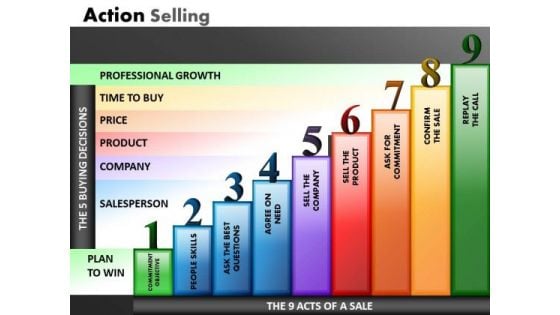
9 Stages Bar Graph Steps PowerPoint Templates Ppt Slides
9 Stages Bar Graph Steps PowerPoint templates PPT Slides-These high quality powerpoint pre-designed slides and powerpoint templates have been carefully created by our professional team to help you impress your audience. All slides have been created and are 100% editable in powerpoint. Each and every property of any graphic - color, size, orientation, shading, outline etc. can be modified to help you build an effective powerpoint presentation. Any text can be entered at any point in the powerpoint template or slide. Simply DOWNLOAD, TYPE and PRESENT! These PowerPoint presentation slides can be used to represent themes relating to - Dress up your presentations with our 9 Stages Bar Graph Steps PowerPoint Templates Ppt Slides. You will come out on top.
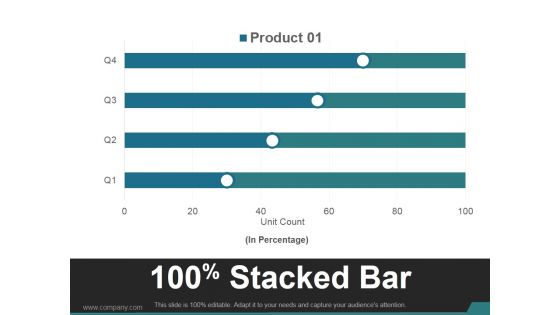
Stacked Bar Template 2 Ppt PowerPoint Presentation Visuals
This is a stacked bar template 2 ppt powerpoint presentation visuals. This is a two stage process. The stages in this process are business, marketing, product, stacked bar, management.
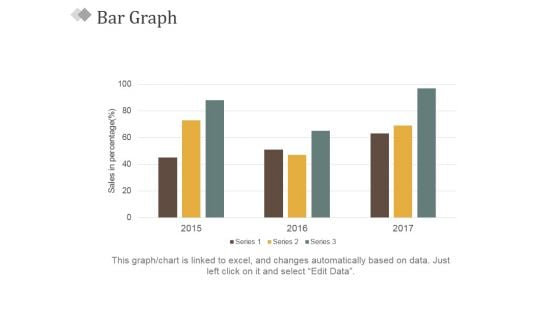
Bar Graph Ppt PowerPoint Presentation Slides Visual Aids
This is a bar graph ppt powerpoint presentation slides visual aids. This is a three stage process. The stages in this process are sales in percentage, bar graph, business, marketing, success.
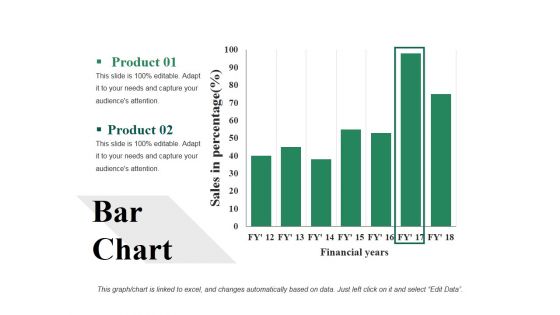
Bar Chart Ppt PowerPoint Presentation Visual Aids Backgrounds
This is a bar chart ppt powerpoint presentation visual aids backgrounds. This is a two stage process. The stages in this process are bar chart, analysis, strategy, finance, business.
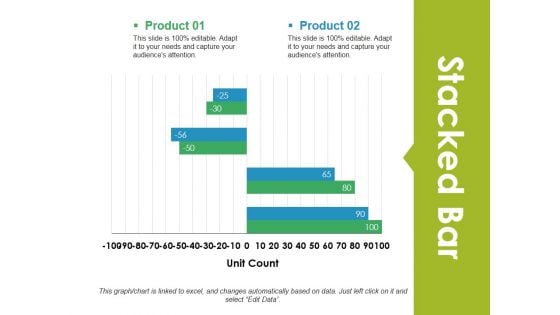
Stacked Bar Ppt PowerPoint Presentation Visual Aids Gallery
This is a stacked bar ppt powerpoint presentation visual aids gallery. This is a two stage process. The stages in this process are stacked bar, analysis, finance, marketing, strategy.
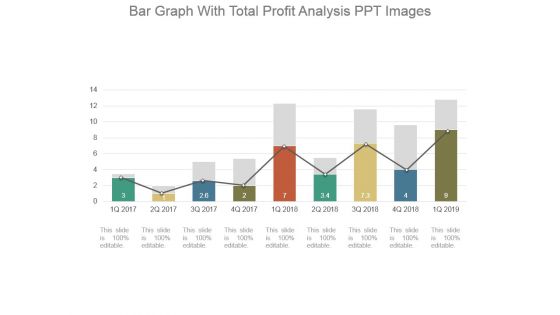
Bar Graph With Total Profit Analysis Ppt Images
This is a bar graph with total profit analysis ppt images. This is a nine stage process. The stages in this process are bar graph, business, marketing, growth, success.
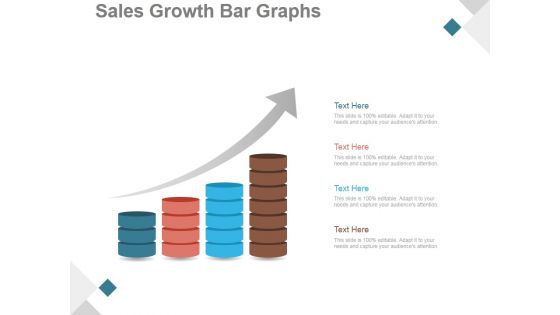
Sales Growth Bar Graphs Ppt PowerPoint Presentation Images
This is a sales growth bar graphs ppt powerpoint presentation images. This is a four stage process. The stages in this process are business, strategy, marketing, growth, bar graph, sales management.
Bar Graph Ppt PowerPoint Presentation Icon Clipart Images
This is a bar graph ppt powerpoint presentation icon clipart images. This is a three stage process. The stages in this process are bar graph, finance, marketing, strategy, analysis.
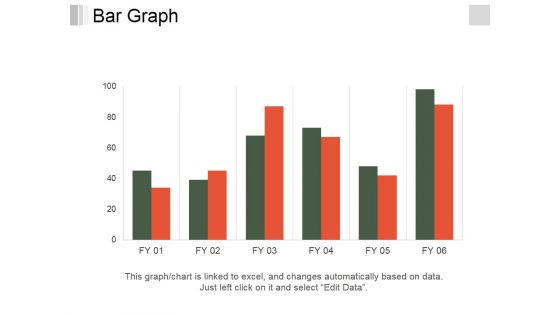
Bar Graph Ppt PowerPoint Presentation Slides Background Image
This is a bar graph ppt powerpoint presentation slides background image. This is a six stage process. The stages in this process are bar graph, finance, marketing, analysis, business.


 Continue with Email

 Home
Home


