Benefits Icon

Purchasing Policy Ppt Layout Ppt Background Graphics
This is a purchasing policy ppt layout ppt background graphics. This is a seven stage process. The stages in this process are purchase requisition, order placement, shipment tracking, quality products, profitability, rebates, improved pricing.
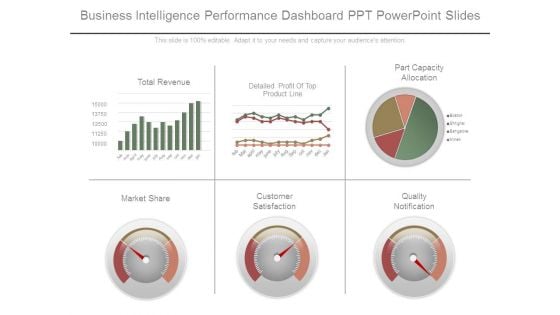
Business Intelligence Performance Dashboard Ppt Powerpoint Slides
This is a business intelligence performance dashboard ppt powerpoint slides. This is a six stage process. The stages in this process are total revenue, detailed profit of top product line, part capacity allocation, market share, customer satisfaction, quality notification.
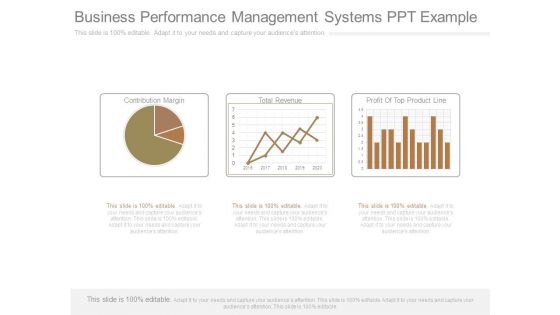
Business Performance Management Systems Ppt Example
This is a business performance management systems ppt example. This is a three stage process. The stages in this process are contribution margin, total revenue, profit of top product line.
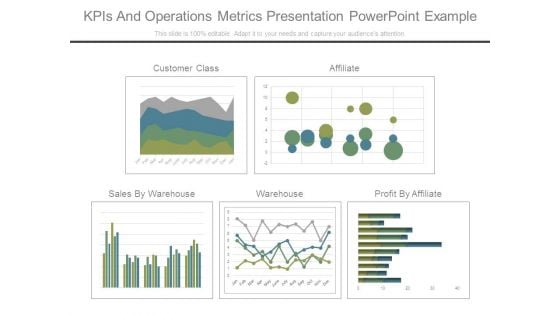
Kpis And Operations Metrics Presentation Powerpoint Example
This is a kpis and operations metrics presentation powerpoint example. This is a five stage process. The stages in this process are customer class, affiliate, sales by warehouse, warehouse, profit by affiliate.
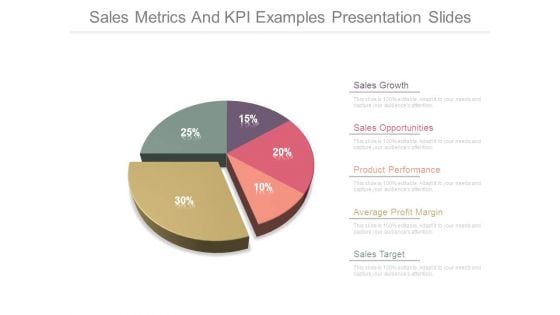
Sales Metrics And Kpi Examples Presentation Slides
This is a sales metrics and kpi examples presentation slides. This is a five stage process. The stages in this process are sales growth, sales opportunities, product performance, average profit margin, sales target.
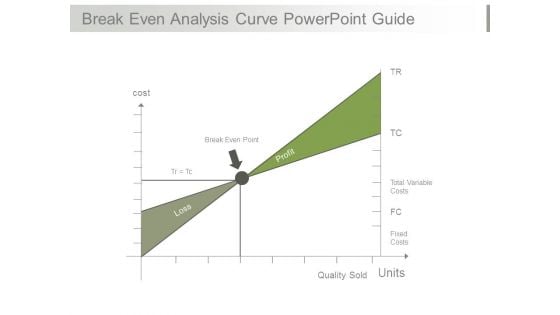
Break Even Analysis Curve Powerpoint Guide
This is a break even analysis curve powerpoint guide. This is a one stage process. The stages in this process are cost, break even point, loss, profit, total variable costs, fixed costs, quality sold, units.
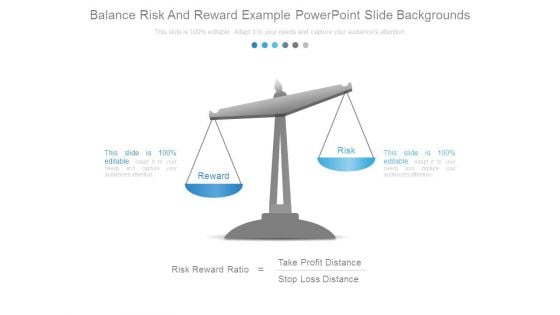
Balance Risk And Reward Example Powerpoint Slide Backgrounds
This is a balance risk and reward example powerpoint slide backgrounds. This is a two stage process. The stages in this process are reward, risk, risk reward ratio, take profit distance, stop loss distance.
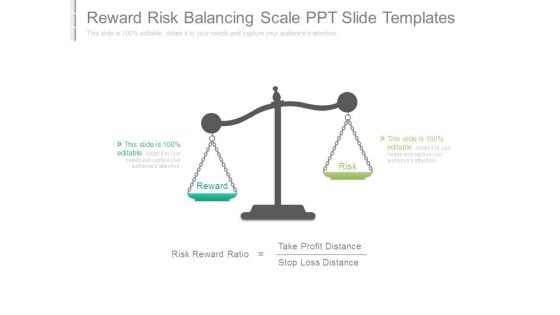
Reward Risk Balancing Scale Ppt Slide Templates
This is a reward risk balancing scale ppt slide templates. This is a two stage process. The stages in this process are risk reward ratio, reward, risk, take profit distance, stop loss distance.
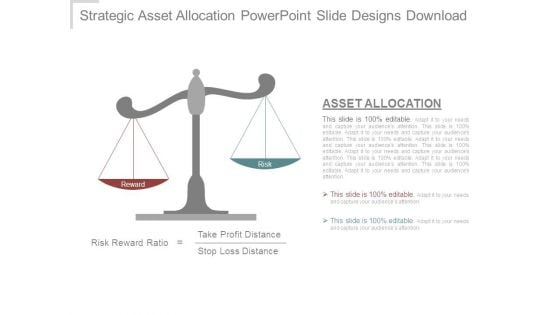
Strategic Asset Allocation Powerpoint Slide Designs Download
This is a strategic asset allocation powerpoint slide designs download. This is a two stage process. The stages in this process are reward, risk, risk reward ratio, take profit distance, stop loss distance, asset allocation.
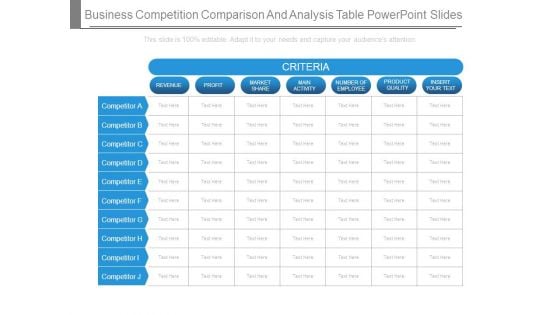
Business Competition Comparison And Analysis Table Powerpoint Slides
This is a business competition comparison and analysis table powerpoint slides. This is a six stage process. The stages in this process are criteria, revenue, profit, market share, main activity, number of employee, product quality, competitor.

Criteria Based Competition Comparison Table Powerpoint Slides
This is a criteria based competition comparison table powerpoint slides. This is a seven stage process. The stages in this process are revenue, profit, market share, main activity, number of employee, product quality.
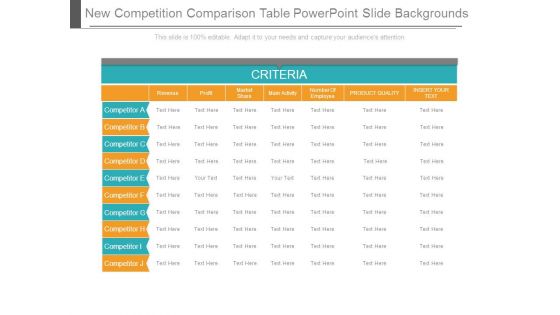
New Competition Comparison Table Powerpoint Slide Backgrounds
This is a new competition comparison table powerpoint slide backgrounds. This is a seven stage process. The stages in this process are revenue, profit, market share, main activity, number of employee, product quality, insert your text.
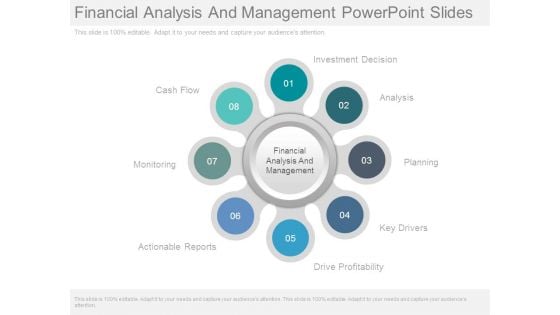
Financial Analysis And Management Powerpoint Slides
This is a financial analysis and management powerpoint slides. This is a eight stage process. The stages in this process are cash flow, monitoring, actionable reports, investment decision, analysis, financial, analysis and management, planning, key drivers, drive profitability.
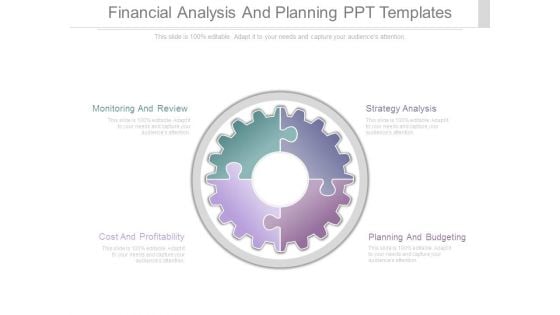
Financial Analysis And Planning Ppt Templates
This is a financial analysis and planning ppt templates. This is a four stage process. The stages in this process are monitoring and review, cost and profitability, strategy analysis, planning and budgeting.

Financial Analysis Exercise Example Ppt Templates
This is a financial analysis exercise example ppt templates. This is a four stage process. The stages in this process are begin balance sheet, profit loss report, equity contribution, end.
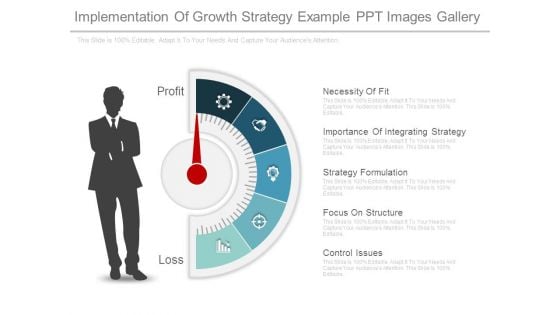
Implementation Of Growth Strategy Example Ppt Images Gallery
This is a implementation of growth strategy example ppt images gallery. This is a five stage process. The stages in this process are necessity of fit , importance of integrating strategy, strategy formulation, focus on structure, control issues, loss, profit.
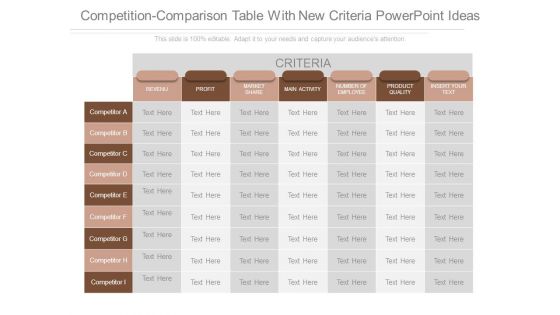
Competition Comparison Table With New Criteria Powerpoint Ideas
This is a competition comparison table with new criteria powerpoint ideas. This is a seven stage process. The stages in this process are revenu, profit, market share, main activity, number of employee, product quality, insert your text.

Effect Of Workplace On Productivity Powerpoint Images
This is a effect of workplace on productivity powerpoint images. This is a four stage process. The stages in this process are satisfied and loyal customer, committed employees, proactive and profitable organization, high performing workforce.
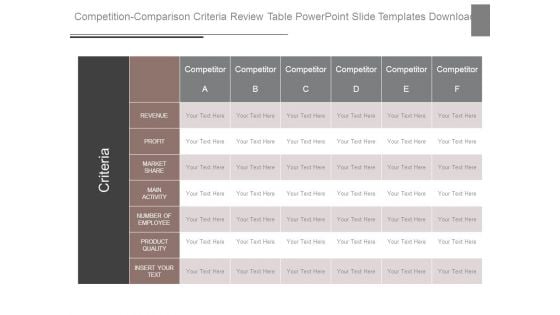
Competition Comparison Criteria Review Table Powerpoint Slide Templates Download
This is a competition comparison criteria review table powerpoint slide templates download. This is a six stage process. The stages in this process are criteria, competitor revenue, profit, market share, main activity, number of employee, product quality, insert your text.
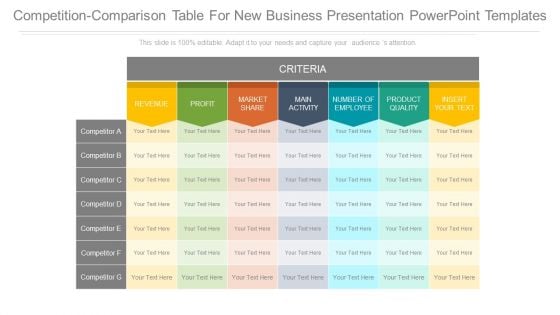
Competition Comparison Table For New Business Presentation Powerpoint Templates
This is a competition comparison table for new business presentation powerpoint templates. This is a seven stage process. The stages in this process are criteria, revenue, profit, market share, main activity, number of employee, product quality, insert your text.
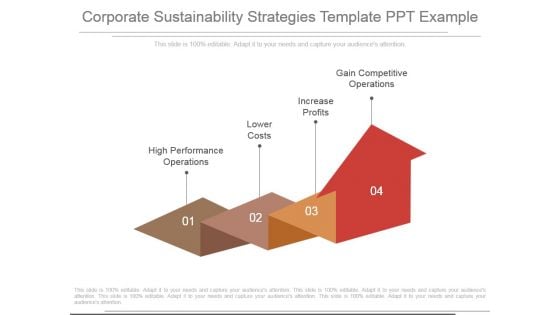
Corporate Sustainability Strategies Template Ppt Example
This is a corporate sustainability strategies template ppt example. This is a four stage process. The stages in this process are high performance operations, lower costs, increase profits, gain competitive operations.
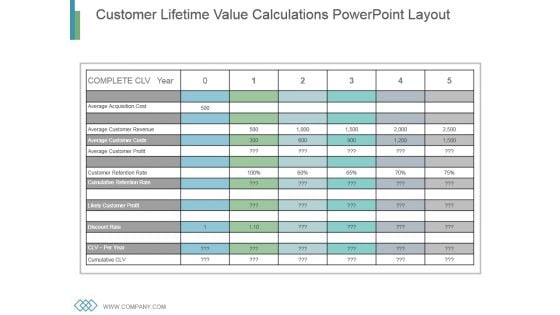
Customer Lifetime Value Calculations Powerpoint Layout
This is a customer lifetime value calculations powerpoint layout. This is a six stage process. The stages in this process are average acquisition cost, average customer revenue, average customer profit, customer retention rate, discount rate.

Business Comparison Table Sample Ppt Presentation
This is a business comparison table sample ppt presentation. This is a seven stage process. The stages in this process are criteria, revenue, profit, market, share, main activity, number of employee, product quality, insert your text, competitor.
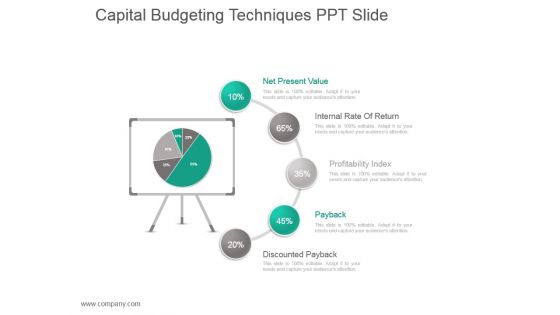
Capital Budgeting Techniques Ppt Slide
This is a capital budgeting techniques ppt slide. This is a five stage process. The stages in this process are net present value, internal rate of return, profitability index, payback, discounted payback.
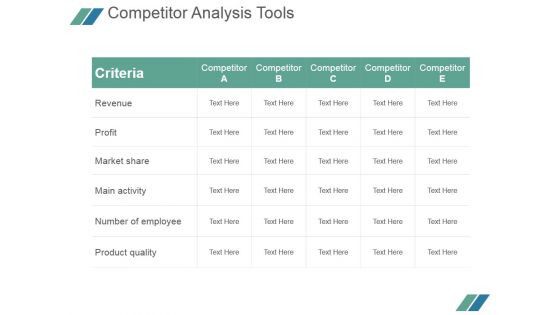
Competitor Analysis Tools Ppt PowerPoint Presentation Example File
This is a competitor analysis tools ppt powerpoint presentation example file. This is a five stage process. The stages in this process are criteria, revenue, profit, market share, main activity, number of employee, product quality.
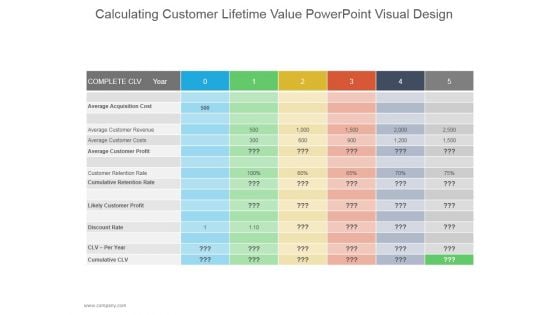
Calculating Customer Lifetime Value Ppt PowerPoint Presentation Introduction
This is a calculating customer lifetime value ppt powerpoint presentation introduction. This is a five stage process. The stages in this process are average acquisition cost, average customer revenue, likely customer profit.
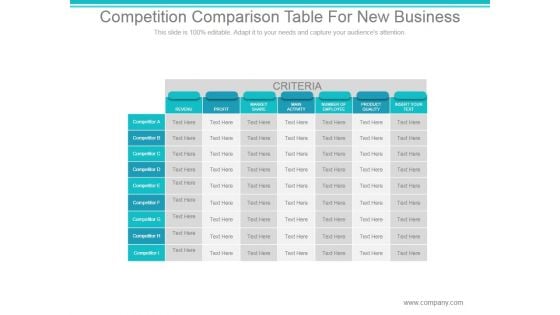
Competition Comparison Table For New Business Ppt PowerPoint Presentation Slides
This is a competition comparison table for new business ppt powerpoint presentation slides. This is a seven stage process. The stages in this process are criteria, revenue, profit, market share, main activity, number of employee, product quality, competitor.
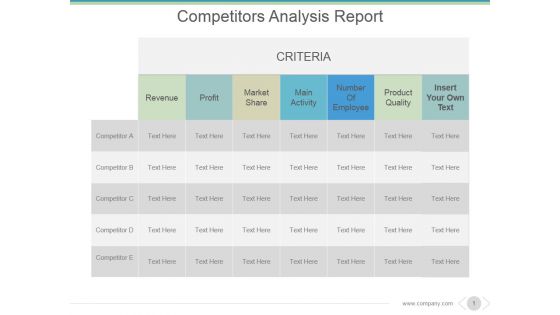
Competitors Analysis Report Ppt PowerPoint Presentation Introduction
This is a competitors analysis report ppt powerpoint presentation introduction. This is a seven stage process. The stages in this process are criteria, revenue, profit, market share, main activity, number of employee.
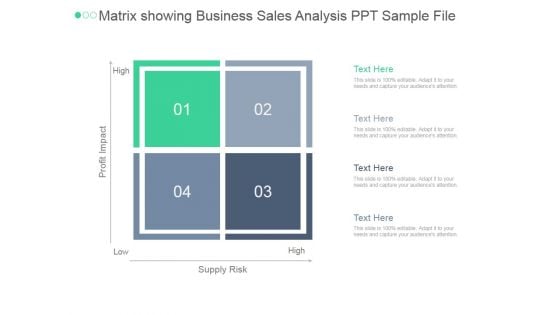
Matrix Showing Business Sales Analysis Ppt PowerPoint Presentation Introduction
This is a matrix showing business sales analysis ppt powerpoint presentation introduction. This is a four stage process. The stages in this process are profit impact, low, supply risk, high, high.
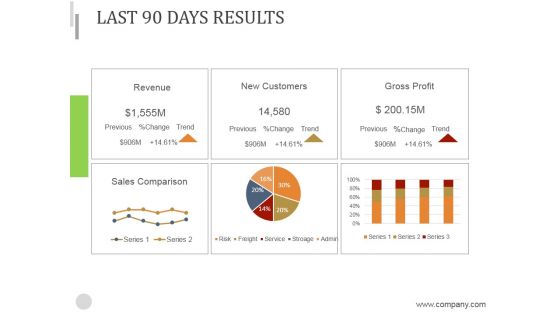
Last 90 Days Results Ppt PowerPoint Presentation Introduction
This is a last 90 days results ppt powerpoint presentation introduction. This is a six stage process. The stages in this process are revenue, new customers, gross profit, sales comparison.
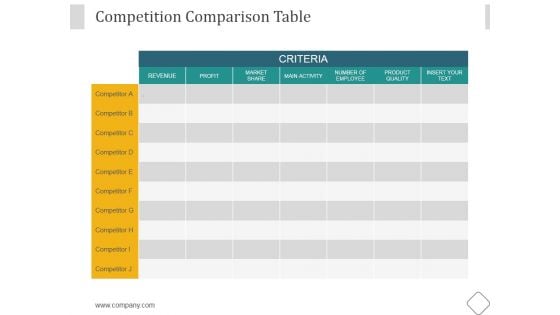
Competition Comparison Table Ppt PowerPoint Presentation Outline
This is a competition comparison table ppt powerpoint presentation outline. This is a seven stage process. The stages in this process are revenue, profit, market share, main activity, number of employee, product quality.
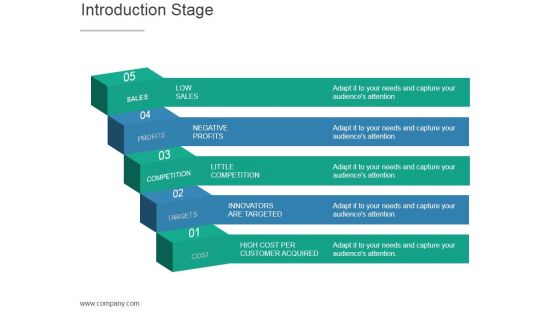
Introduction Stage Ppt PowerPoint Presentation Graphics
This is a introduction stage ppt powerpoint presentation graphics. This is a five stage process. The stages in this process are low sales, negative profits, little competition, innovators are targeted, high cost per customer acquired.
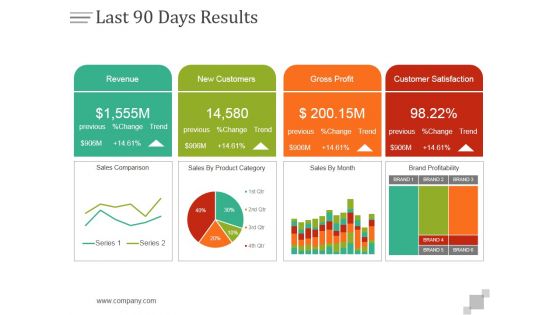
Last 90 Days Results Ppt PowerPoint Presentation Design Templates
This is a last 90 days results ppt powerpoint presentation design templates. This is a four stage process. The stages in this process are revenue, new customers, gross profit, customer satisfaction.
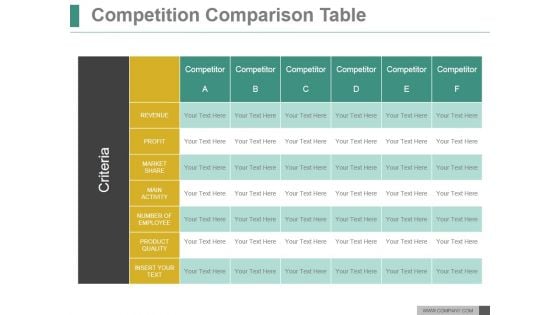
Competition Comparison Table Ppt PowerPoint Presentation Slide
This is a competition comparison table ppt powerpoint presentation slide. This is a six stage process. The stages in this process are revenue, profit, market share, main activity, number of employee, product quality.
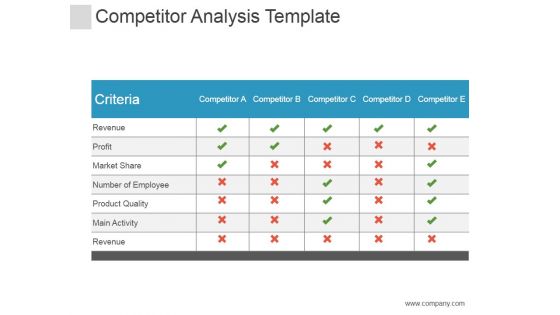
Competitor Analysis Template Ppt PowerPoint Presentation Guidelines
This is a competitor analysis template ppt powerpoint presentation guidelines. This is a five stage process. The stages in this process are revenue, profit, market share, competitor, number of employee.
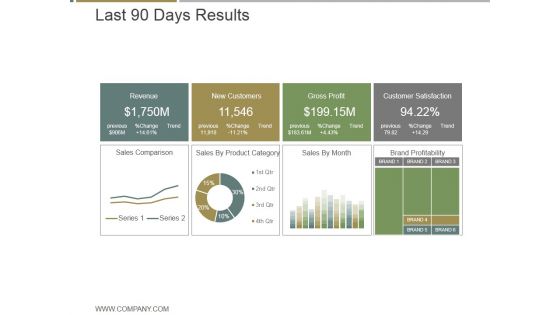
Last 90 Days Results Ppt PowerPoint Presentation Microsoft
This is a last 90 days results ppt powerpoint presentation microsoft. This is a four stage process. The stages in this process are revenue, new customers, gross profit, customer satisfaction.
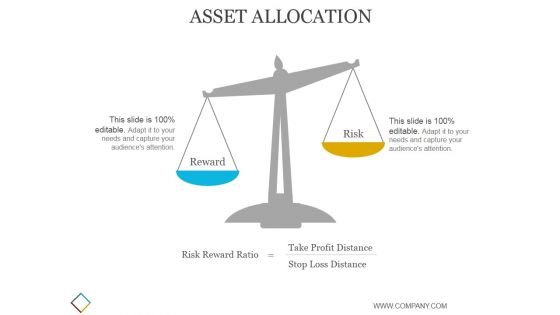
Asset Allocation Ppt PowerPoint Presentation Show
This is a asset allocation ppt powerpoint presentation show. This is a two stage process. The stages in this process are reward, risk, take profit distance, stop loss distance.
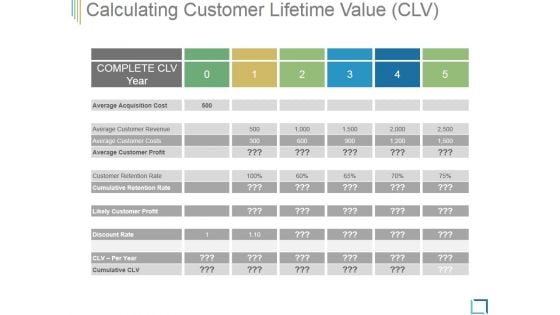
Calculating Customer Lifetime Value Ppt PowerPoint Presentation Templates
This is a calculating customer lifetime value ppt powerpoint presentation templates. This is a five stage process. The stages in this process are average acquisition cost, average customer revenue, average customer costs, average customer profit, customer retention rate.
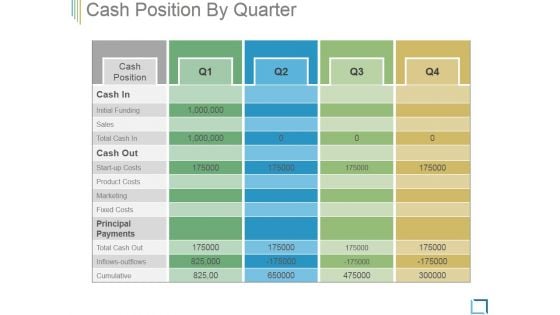
Cash Position By Quarter Ppt PowerPoint Presentation Model
This is a cash position by quarter ppt powerpoint presentation model. This is a four stage process. The stages in this process are average acquisition cost, average customer revenue, average customer costs, average customer profit, customer retention rate.

Asset Allocation Ppt PowerPoint Presentation Backgrounds
This is a asset allocation ppt powerpoint presentation backgrounds. This is a two stage process. The stages in this process are reward, risk, risk reward ratio, take profit distance, stop loss distance.
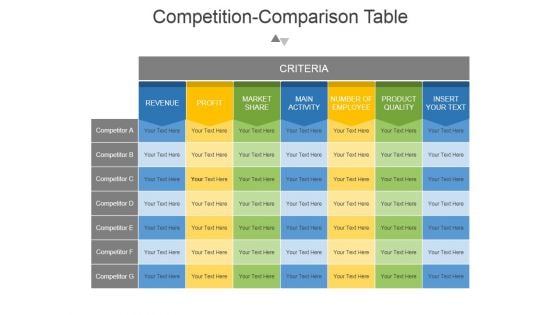
Competition Comparison Table Ppt PowerPoint Presentation Backgrounds
This is a competition comparison table ppt powerpoint presentation backgrounds. This is a seven stage process. The stages in this process are revenue, profit, market share , main activity, number of employee, product quality , insert your text.
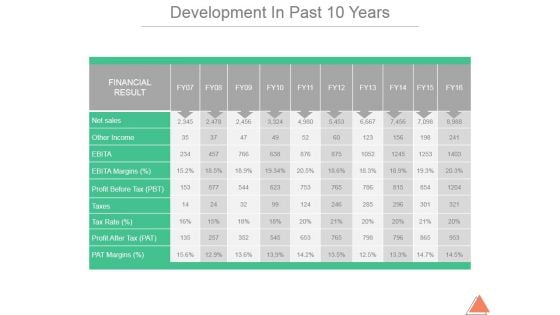
Development In Past 10 Years Template 1 Ppt PowerPoint Presentation Infographics
This is a development in past 10 years template 1 ppt powerpoint presentation infographics. This is a ten stage process. The stages in this process are net sales, other income, ebita margins, profit before tax, taxes.
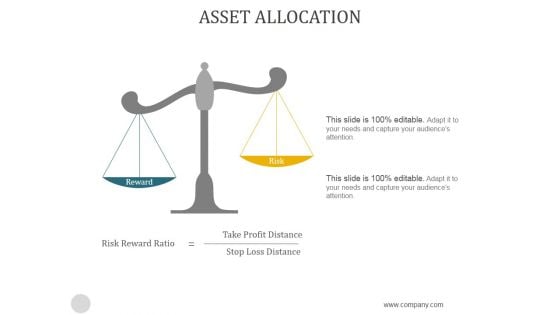
Asset Allocation Ppt PowerPoint Presentation Designs
This is a asset allocation ppt powerpoint presentation designs. This is a two stage process. The stages in this process are risk reward ratio, take profit distance, stop loss distance.
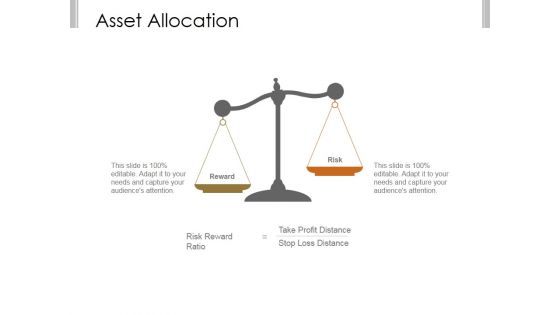
Asset Allocation Ppt PowerPoint Presentation Design Templates
This is a asset allocation ppt powerpoint presentation design templates. This is a two stage process. The stages in this process are risk reward ratio, take profit distance, stop loss distance.
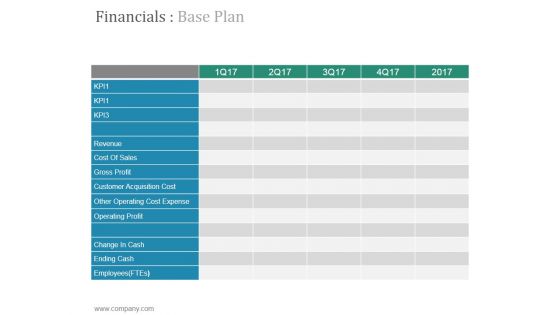
Financials Base Plan Ppt PowerPoint Presentation Portfolio
This is a financials base plan ppt powerpoint presentation portfolio. This is a five stage process. The stages in this process are revenue, cost of sales, gross profit, customer acquisition cost, other operating cost expense.
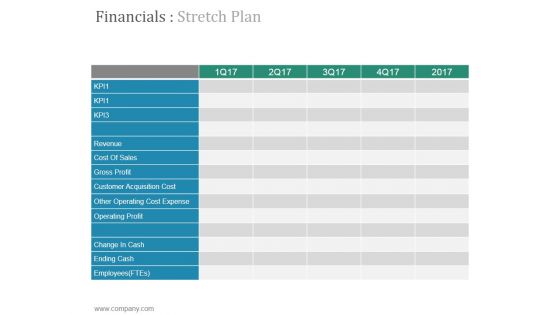
Financials Stretch Plan Ppt PowerPoint Presentation Designs
This is a financials stretch plan ppt powerpoint presentation designs. This is a five stage process. The stages in this process are revenue, cost of sales, gross profit, customer acquisition cost, other operating cost expense.
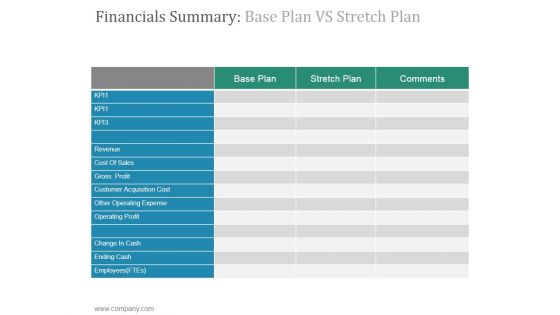
Financials Summary Base Plan VS Stretch Plan Ppt PowerPoint Presentation Design Ideas
This is a financials summary base plan vs stretch plan ppt powerpoint presentation design ideas. This is a three stage process. The stages in this process are ending cash, change in cash, operating profit, other operating expense.
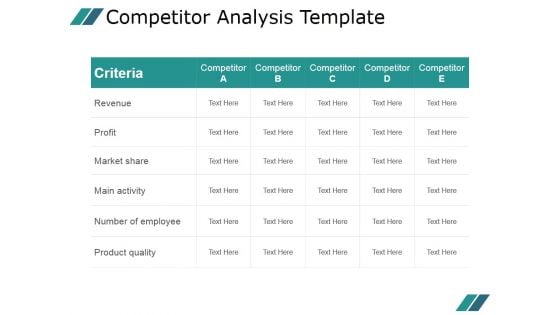
Competitor Analysis Template Ppt PowerPoint Presentation Model
This is a competitor analysis template ppt powerpoint presentation model. This is a five stage process. The stages in this process are revenue, profit, market share, main activity, number of employee, product quality.
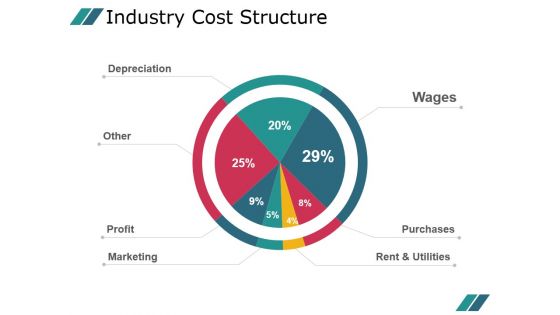
Industry Cost Structure Template 1 Ppt PowerPoint Presentation Example 2015
This is a industry cost structure template 1 ppt powerpoint presentation example 2015. This is a seven stage process. The stages in this process are wages, purchases, rent and utilities, depreciation, other, profit, marketing.
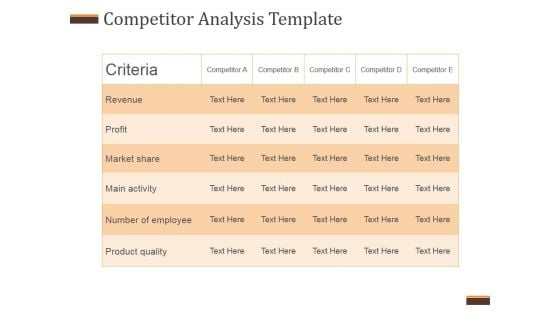
Competitor Analysis Template Ppt PowerPoint Presentation Example File
This is a competitor analysis template ppt powerpoint presentation example file. This is a five stage process. The stages in this process are revenue, profit, market share, main activity, number of employee, product quality.

Industry Cost Structure Template 1 Ppt PowerPoint Presentation Guidelines
This is a industry cost structure template 1 ppt powerpoint presentation guidelines. This is a seven stage process. The stages in this process are profit, marketing, rent and utilities, purchases, wages, other, depreciation.
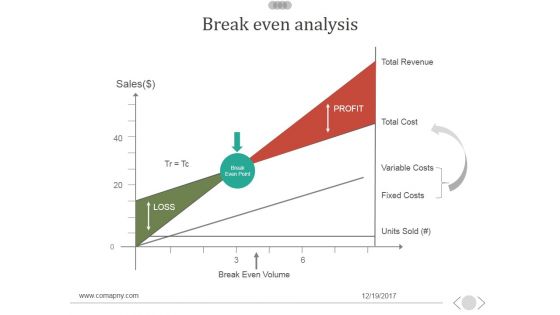
Break Even Analysis Ppt PowerPoint Presentation Design Templates
This is a break even analysis ppt powerpoint presentation design templates. This is a two stage process. The stages in this process are sales, break even volume, total revenue, loss, profit.
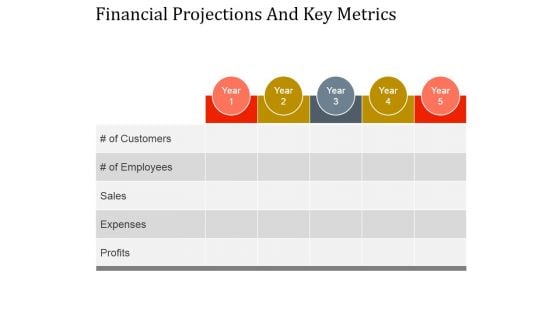
Financial Projections And Key Metrics Ppt PowerPoint Presentation Designs
This is a financial projections and key metrics ppt powerpoint presentation designs. This is a five stage process. The stages in this process are profits, expenses, sales, of employees, of customers.
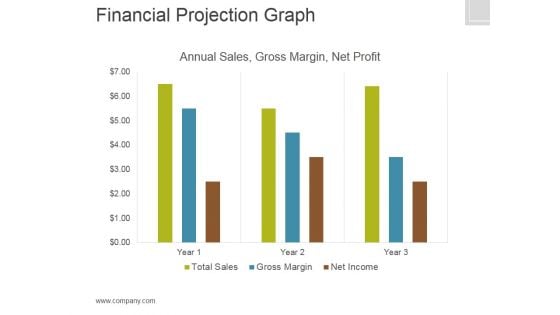
Financial Projection Graph Template 2 Ppt PowerPoint Presentation Graphics
This is a financial projection graph template 2 ppt powerpoint presentation graphics. This is a three stage process. The stages in this process are annual sales, gross margin, net profit, finance.
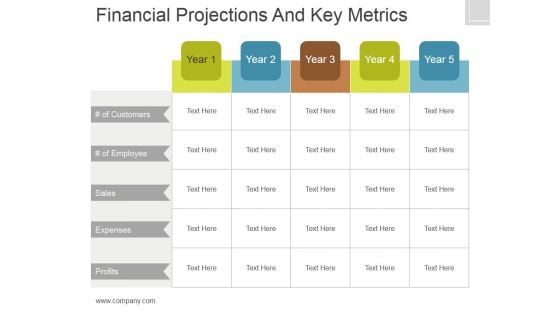
Financial Projections And Key Metrics Ppt PowerPoint Presentation Show
This is a financial projections and key metrics ppt powerpoint presentation show. This is a five stage process. The stages in this process are of customers, sales, expenses, profits.
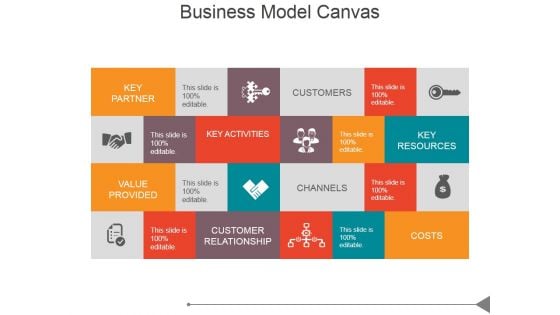
Business Model Canvas Ppt PowerPoint Presentation Designs
This is a business model canvas ppt powerpoint presentation designs. This is a three stage process. The stages in this process are profit models, unique value proposition, market attractiveness, sales performance model, sustainability.
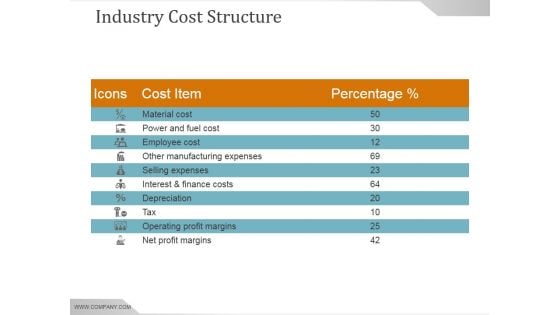
Industry Cost Structure Template Ppt PowerPoint Presentation Tips
This is a industry cost structure template ppt powerpoint presentation tips. This is a seven stage process. The stages in this process are purchases, rent and utilities, marketing, profit, depreciation, wages.
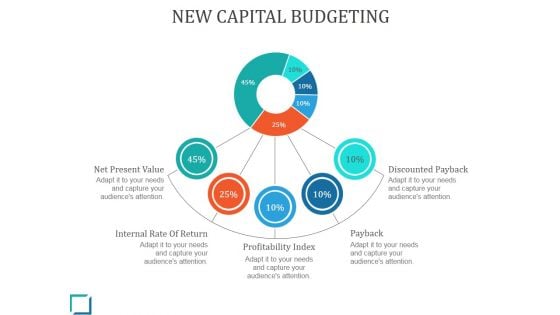
New Capital Budgeting Ppt PowerPoint Presentation Influencers
This is a new capital budgeting ppt powerpoint presentation influencers. This is a five stage process. The stages in this process are discounted payback, payback, profitability index, net present value.
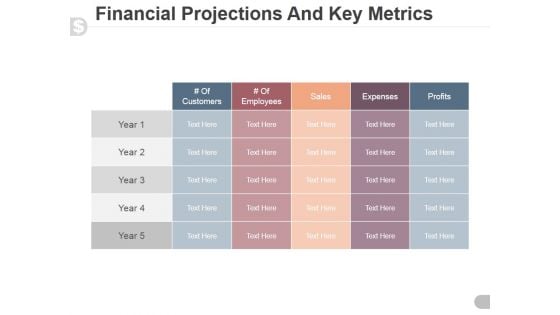
Financial Projections And Key Metrics Ppt PowerPoint Presentation Professional
This is a financial projections and key metrics ppt powerpoint presentation professional. This is a five stage process. The stages in this process are customers, employees, sales, expenses, profits.
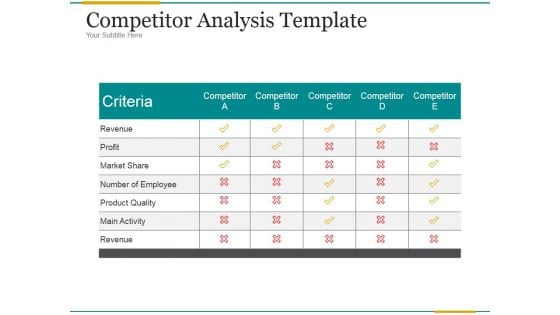
Competitor Analysis Template Ppt PowerPoint Presentation Ideas
This is a competitor analysis template ppt powerpoint presentation ideas. This is a five stage process. The stages in this process are revenue, profit, market share, number of employee, product quality, main activity, revenue.


 Continue with Email

 Home
Home


