Brick
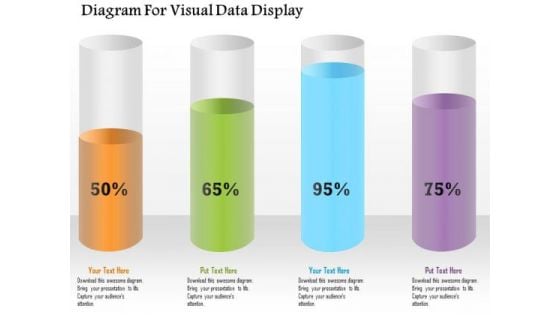
Business Diagram Diagram For Visual Data Display Presentation Template
Four colored cylindrical bars with percentage values are used to design this power point template. This diagram slide helps to display financial data analysis. Use this diagram for your business and finance related presentations.
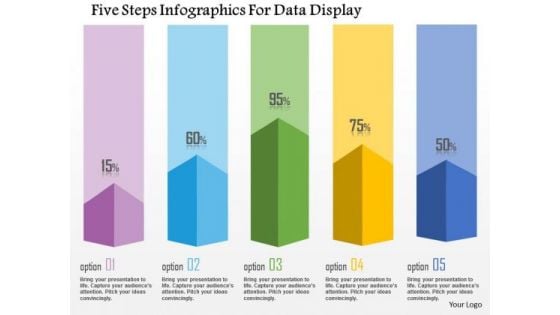
Business Diagram Five Steps Infographics For Data Display Presentation Template
This business diagram has been designed with graphic of five staged info graphics. This diagram can be used to display statistical information. Use this bar graph for your business and sales related presentations.

Business Diagram Thermometer Graphics Indicating Progress Presentation Template
This power point template diagram has been designed with graphic of thermometer and bar graph. This PPT contains the concept of growth analysis. Use this PPT for business and marketing related presentations.
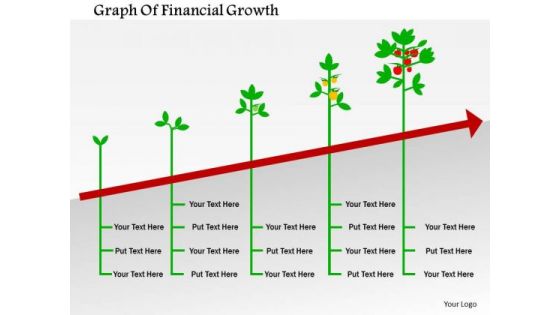
Business Diagram Graph Of Financial Growth Presentation Template
Tree design bar graph has been used to craft this power point template diagram. This PPT contains the concept of financial growth. Use this PPT diagram for finance and business related presentations.
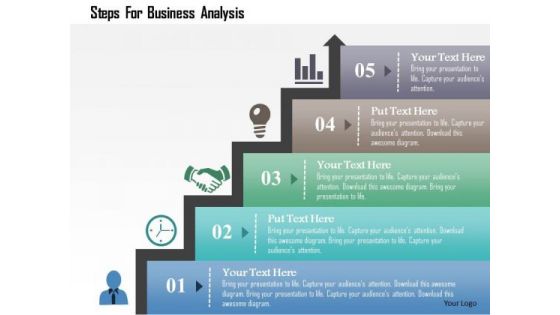
Business Diagram Steps For Business Analysis Presentation Template
Concept of time management has been defined in this power point template diagram. This diagram contains the graphic of bar graph. Amplify your thoughts via this appropriate business template.
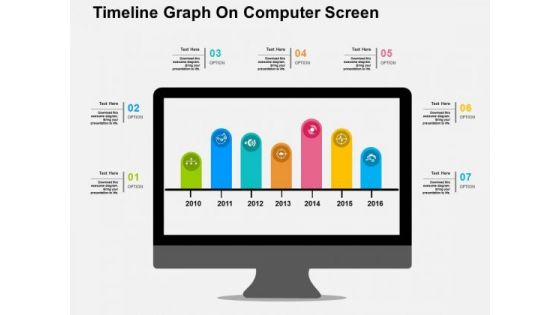
Timeline Graph On Computer Screen PowerPoint Template
Create dynamic presentations with our professional template containing diagram of bar graph on computer screen. This diagram is useful to display business timeline. Download this template to leave permanent impression on your audience.
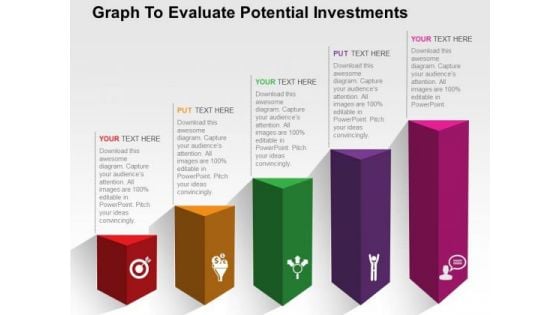
Graph To Evaluate Potential Investments PowerPoint Templates
Use this diagram to evaluate potential investments. This PPT slide contains bar graph with icons. This slide is designed to attract the attention of your audience towards business plan evaluation.
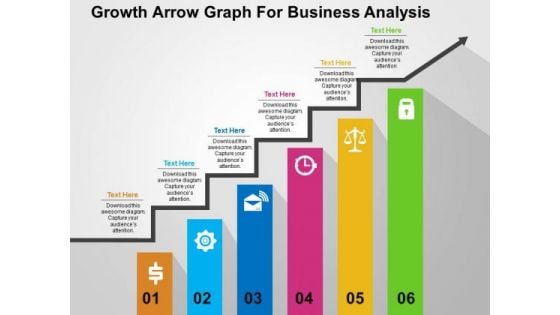
Growth Arrow Graph For Business Analysis PowerPoint Templates
Use this PowerPoint template containing growth arrow graph for business analysis. This PPT slide contains bar graph with icons. This slide is designed to attract the attention of your audience towards business plan evaluation.
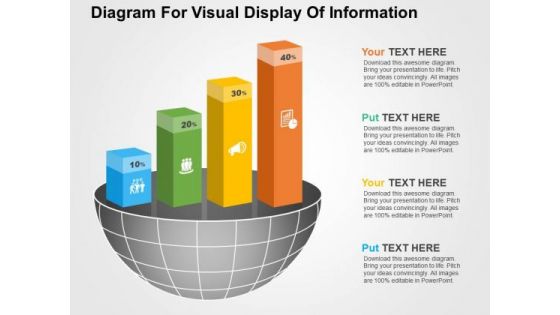
Diagram For Visual Display Of Information PowerPoint Templates
Visually support your presentation with our above template illustrating quantitative information. It contains graphics of bars. Etch your views in the brains of your audience with this diagram slide.
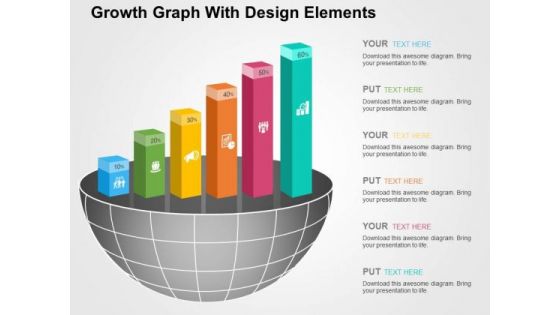
Growth Graph With Design Elements PowerPoint Templates
The above template displays growth bar graph. This PowerPoint template signifies the concept of business and financial planning. Adjust the above diagram in your business presentations to visually support your content.
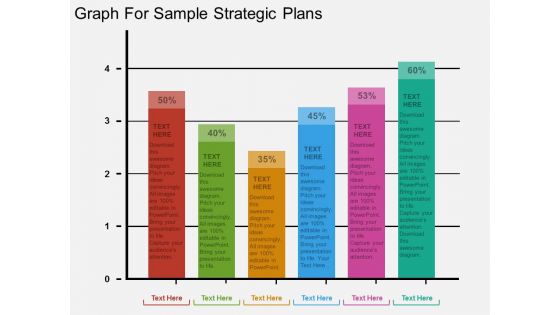
Graph For Sample Strategic Plans Powerpoint Template
Create dynamic presentations with our professional template containing bar graph. This diagram is useful to depict sample strategic plan. Download this template to leave permanent impression on your audience.
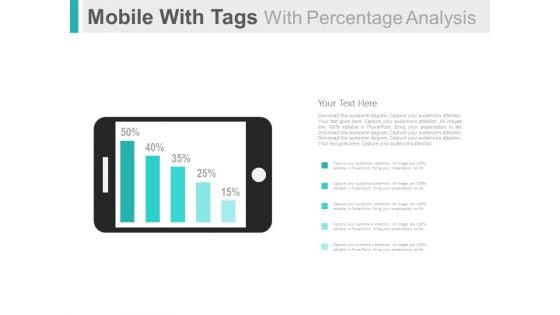
Mobile For Online Survey And Analysis Powerpoint Slides
This PowerPoint template has been designed with graphics of mobile and percentage bar graph. This PPT slide can be used to display online survey and analysis. You can download finance PowerPoint template to prepare awesome presentations.
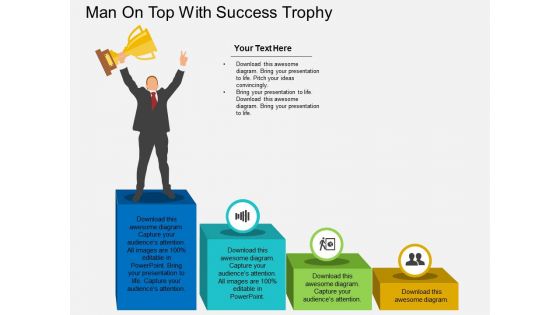
Man On Top With Success Trophy Powerpoint Template
This PowerPoint template has been designed with graphics man standing on top bar with trophy. This Professional may be used to display concept of win, success and strategy. Download this business slide to build impressive presentation.
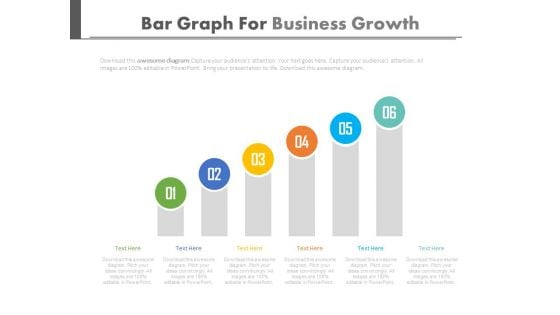
Setting Goals And Developing Strategies Powerpoint Slides
This PowerPoint template is useful for setting goals and developing strategies. This PPT background has a design of six steps bar graph. This PPT slide is suitable for topics like corporate strategic planning.
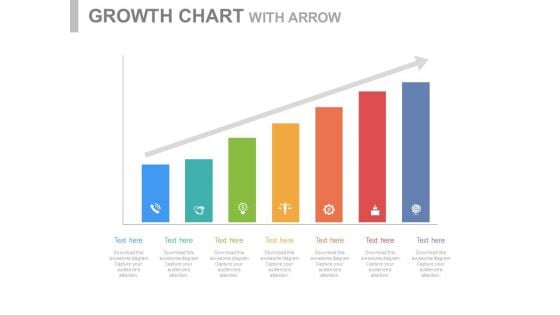
Steps For Developing Strategic Plan Powerpoint Slides
This PowerPoint template is useful for setting goals and developing strategies. This PPT background has a design of seven steps bar graph. This PPT slide is suitable for topics like corporate strategic planning.
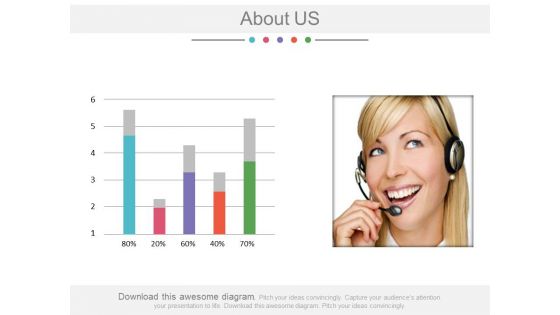
About Us Companys Data Information Powerpoint Slides
Download this PowerPoint template to create an attention grabbing introductory slide. It contains slide bar graph with employee image. Use this professional slide design to build a good reputation of your company.
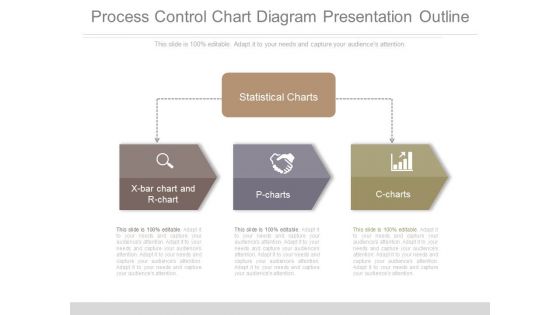
Process Control Chart Diagram Presentation Outline
This is a process control chart diagram presentation outline. This is a three stage process. The stages in this process are statistical charts, x bar chart and r chart, p charts, c charts.
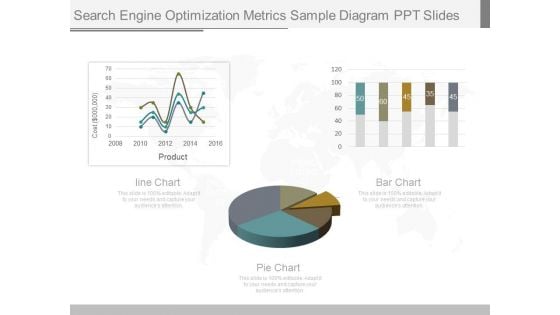
Search Engine Optimization Metrics Sample Diagram Ppt Slides
This is a search engine optimization metrics sample diagram ppt slides. This is a three stage process. The stages in this process are cost, product, line chart, bar chart, pie chart.
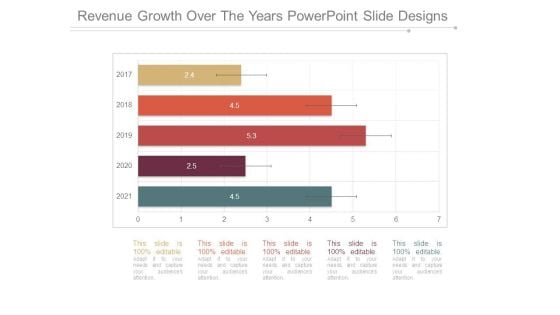
Revenue Growth Over The Years Powerpoint Slide Designs
This is a revenue growth over the years powerpoint slide designs. This is a five stage process. The stages in this process are bar graph, years, business, growth, marketing.
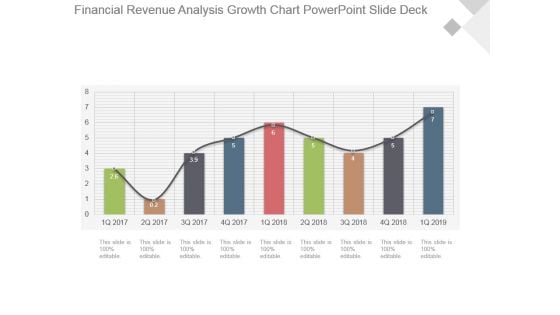
Financial Revenue Analysis Growth Chart Powerpoint Slide Deck
This is a financial revenue analysis growth chart powerpoint slide deck. This is a nine stage process. The stages in this process are growth, success, business, marketing, bar graph.
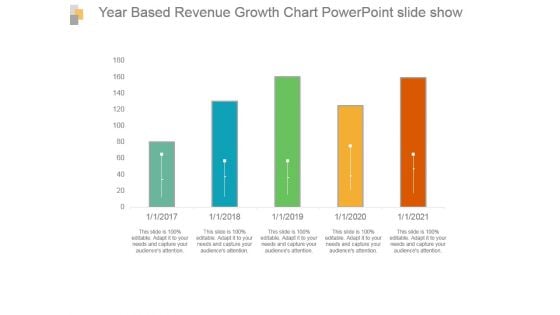
Year Based Revenue Growth Chart Powerpoint Slide Show
This is a year based revenue growth chart powerpoint slide show. This is a five stage process. The stages in this process are bar graph, growth, revenue, year, success.
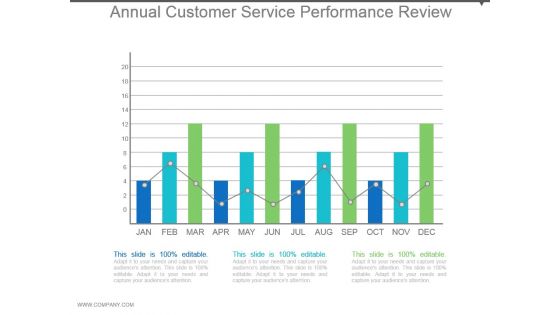
Annual Customer Service Performance Review Example Of Ppt
This is a annual customer service performance review example of ppt. This is a twelve stage process. The stages in this process are bar graph, growth, data, customer, success.
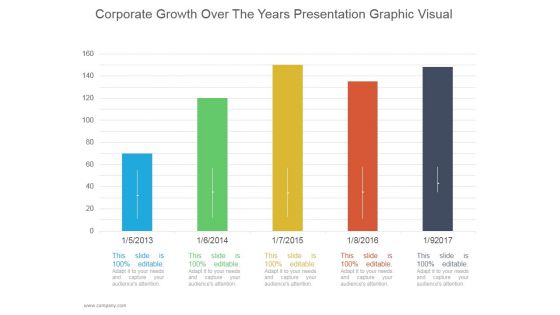
Corporate Growth Over The Years Ppt PowerPoint Presentation Good
This is a corporate growth over the years ppt powerpoint presentation good. This is a five stage process. The stages in this process are business, strategy, marketing, growth, bar graph.
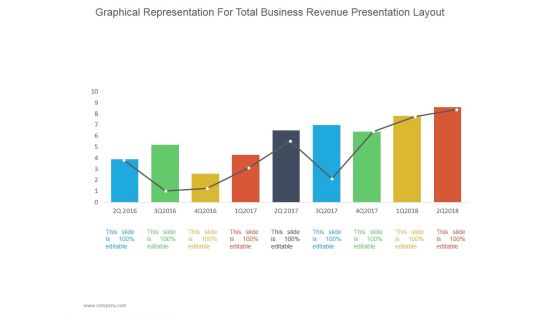
Graphical Representation For Total Business Revenue Ppt PowerPoint Presentation Diagrams
This is a graphical representation for total business revenue ppt powerpoint presentation diagrams. This is a nine stage process. The stages in this process are business, strategy, line chart, bar graph, marketing, management.
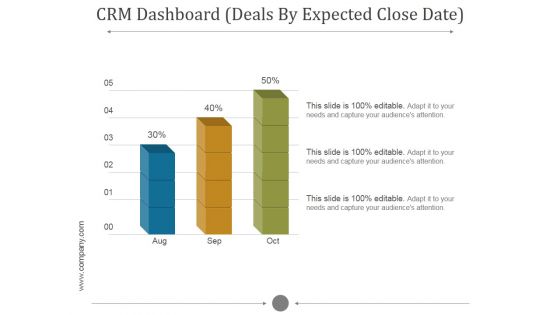
Crm Dashboard Deals By Expected Close Date Ppt PowerPoint Presentation Background Images
This is a crm dashboard deals by expected close date ppt powerpoint presentation background images. This is a five stage process. The stages in this process are bar graph, aug, sep, oct, growth.
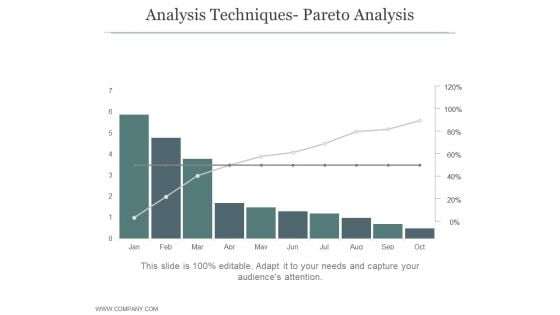
Analysis Techniques Pareto Analysis Ppt PowerPoint Presentation Example
This is a analysis techniques pareto analysis ppt powerpoint presentation example. This is a ten stage process. The stages in this process are business, strategy, bar graph, line graph, process.
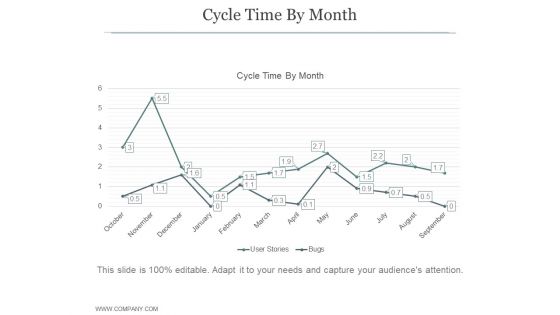
Cycle Time By Month Ppt PowerPoint Presentation Guidelines
This is a cycle time by month ppt powerpoint presentation guidelines. This is a twelve stage process. The stages in this process are business, strategy, marketing, process, arrow, finance, bar graph.
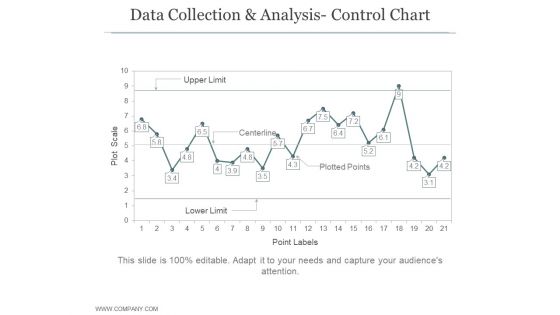
Data Collection And Analysis Control Chart Ppt PowerPoint Presentation Example File
This is a data collection and analysis control chart ppt powerpoint presentation example file. This is a four stage process. The stages in this process are business, strategy, marketing, bar graph, growth strategy.
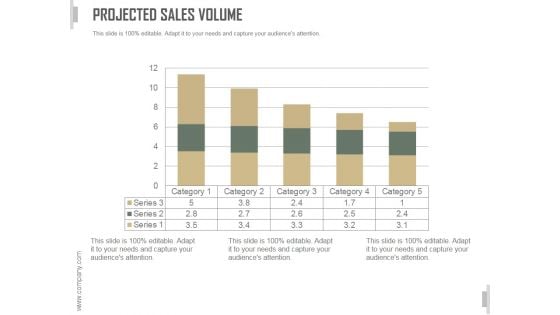
Projected Sales Volume Ppt PowerPoint Presentation Pictures
This is a projected sales volume ppt powerpoint presentation pictures. This is a five stage process. The stages in this process are business, strategy, marketing, analysis, liner process, bar graph.
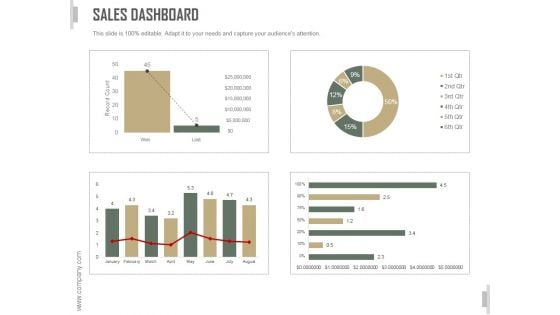
Sales Dashboard Slide Ppt PowerPoint Presentation Template
This is a sales dashboard slide ppt powerpoint presentation template. This is a three stage process. The stages in this process are business, strategy, marketing, analysis, bar graph, growth strategy.
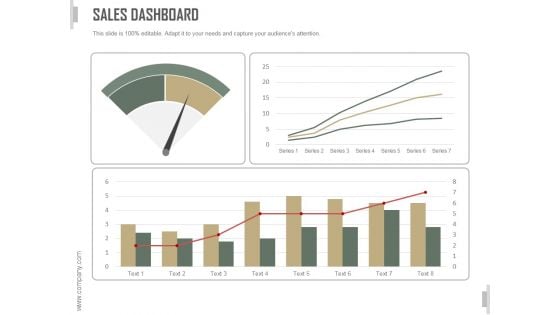
Sales Dashboard Ppt PowerPoint Presentation Design Templates
This is a sales dashboard ppt powerpoint presentation design templates. This is a four stage process. The stages in this process are business, strategy, marketing, analysis, bar graph, growth strategy.

Quarter Track Record Ppt PowerPoint Presentation Samples
This is a quarter track record ppt powerpoint presentation samples. This is a two stage process. The stages in this process are business, strategy, marketing, analysis, growth strategy, bar graph.
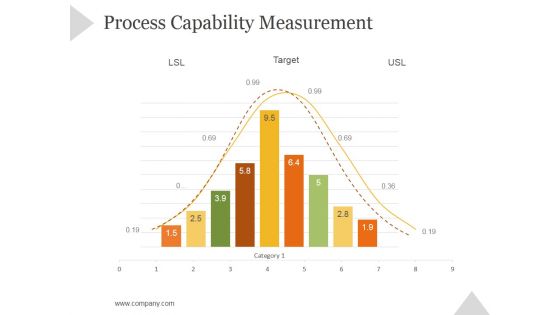
Process Capability Measurement Ppt PowerPoint Presentation Rules
This is a process capability measurement ppt powerpoint presentation rules. This is a nine stage process. The stages in this process are business, strategy, marketing, success, bar graph, growth strategy.
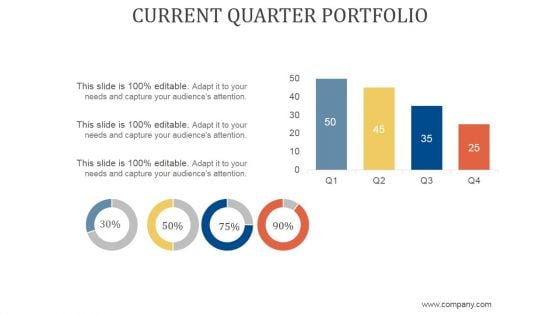
Current Quarter Portfolio Ppt PowerPoint Presentation Visual Aids
This is a current quarter portfolio ppt powerpoint presentation visual aids. This is a two stage process. The stages in this process are business, strategy, marketing, finance, growth strategy, bar graph.
Pitch Deck For Entrepreneurs Raising Money For A New Business Ppt PowerPoint Presentation Complete Deck With Slides
This is a pitch deck for entrepreneurs raising money for a new business ppt powerpoint presentation complete deck with slides. This is a one stage process. The stages in this process are business, growth strategy, marketing, management, bar graph.
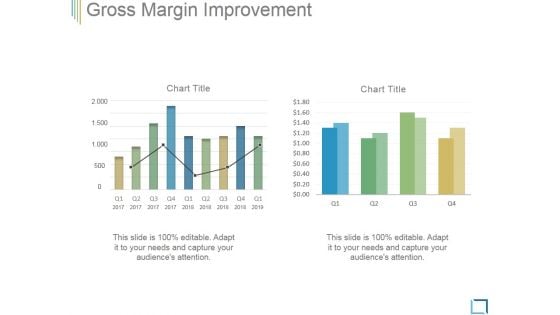
Gross Margin Improvement Ppt PowerPoint Presentation Guidelines
This is a gross margin improvement ppt powerpoint presentation guidelines. This is a two stage process. The stages in this process are business, bar graph, investment, marketing, strategy, success.
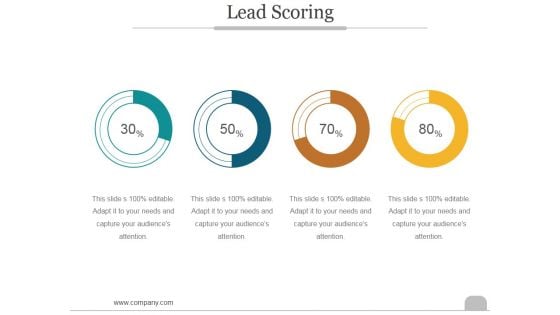
Lead Scoring Template Ppt PowerPoint Presentation Model
This is a lead scoring template ppt powerpoint presentation model. This is a four stage process. The stages in this process are business, marketing, success, bar graph, lead scoring.
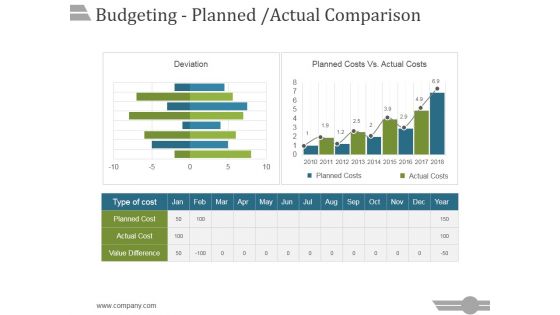
Budgeting Planned Actual Comparison Ppt PowerPoint Presentation Portfolio
This is a budgeting planned actual comparison ppt powerpoint presentation portfolio. This is a three stage process. The stages in this process are business, strategy, marketing, analysis, success, bar graph.
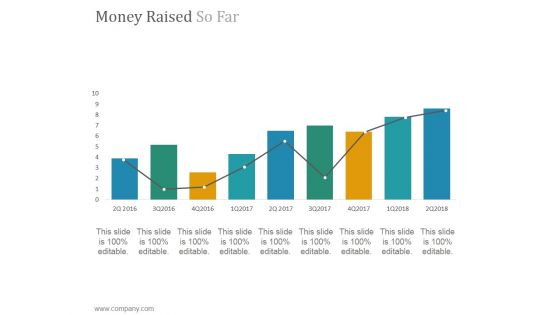
Money Raised So Far Ppt PowerPoint Presentation Layout
This is a money raised so far ppt powerpoint presentation layout. This is a nine stage process. The stages in this process are chart, bar graph, success, growth, marketing.
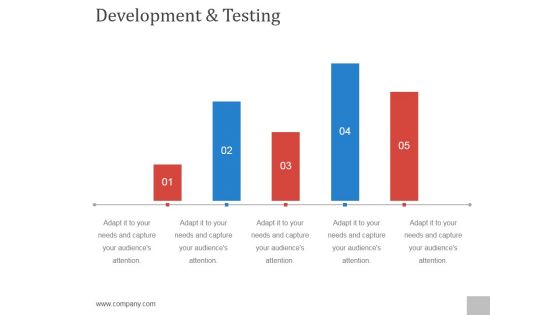
Development And Testing Ppt PowerPoint Presentation Background Designs
This is a development and testing ppt powerpoint presentation background designs. This is a five stage process. The stages in this process are step, business, growth, success, bar graph.
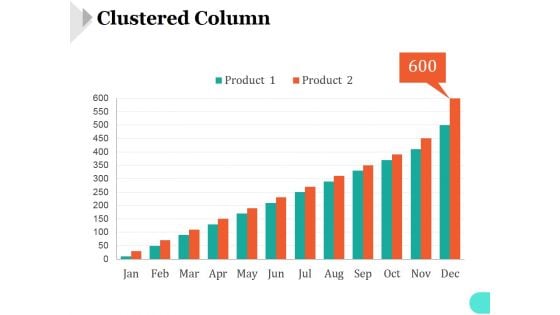
Clustered Column Template 1 Ppt PowerPoint Presentation Inspiration
This is a clustered column template 1 ppt powerpoint presentation inspiration. This is a twelve stage process. The stages in this process are bar graph, marketing, strategy, analysis, business, success.
Clustered Column Template 2 Ppt PowerPoint Presentation Icon
This is a clustered column template 2 ppt powerpoint presentation icon. This is a two stage process. The stages in this process are bar graph, marketing, strategy, analysis, business, success.
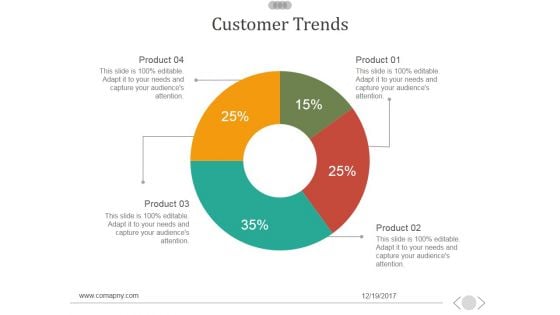
Customer Trends Template 1 Ppt PowerPoint Presentation Diagrams
This is a customer trends template 1 ppt powerpoint presentation diagrams. This is a five stage process. The stages in this process are business, marketing, bar graph, finance, management.
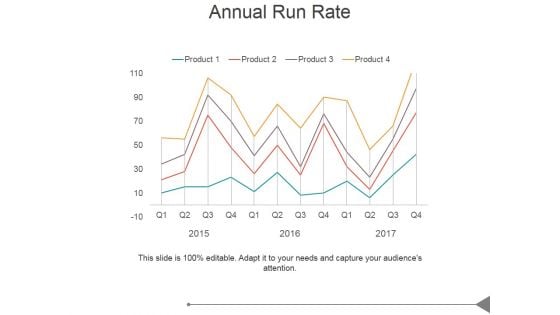
Annual Run Rate Ppt PowerPoint Presentation Designs Download
This is a annual run rate ppt powerpoint presentation designs download. This is a four stage process. The stages in this process are business, marketing, success, business plan, bar graph.
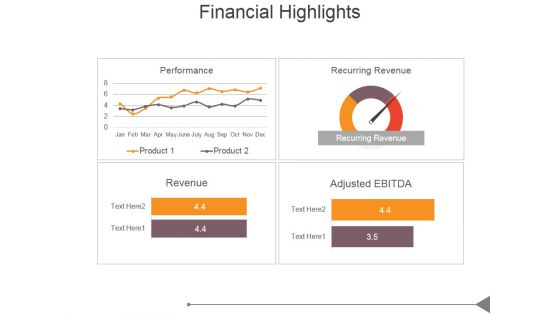
Financial Highlights Template 1 Ppt PowerPoint Presentation Model
This is a financial highlights template 1 ppt powerpoint presentation model. This is a four stage process. The stages in this process are business, marketing, success, business plan, bar graph.
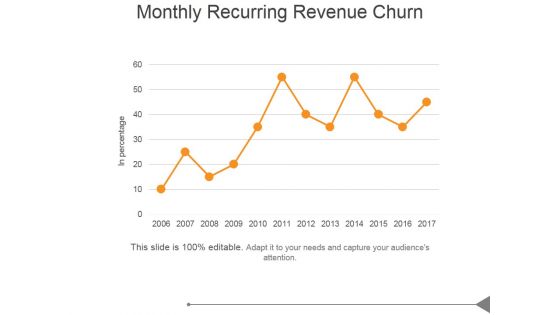
Monthly Recurring Revenue Churn Ppt PowerPoint Presentation Images
This is a monthly recurring revenue churn ppt powerpoint presentation images. This is a five stage process. The stages in this process are business, marketing, success, bar graph, growth.
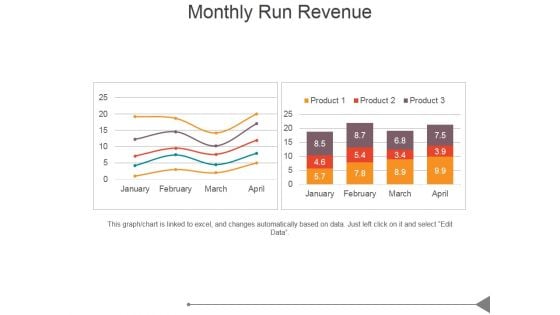
Monthly Run Revenue Ppt PowerPoint Presentation Design Ideas
This is a monthly run revenue ppt powerpoint presentation design ideas. This is a two stage process. The stages in this process are business, marketing, success, bar graph, growth.
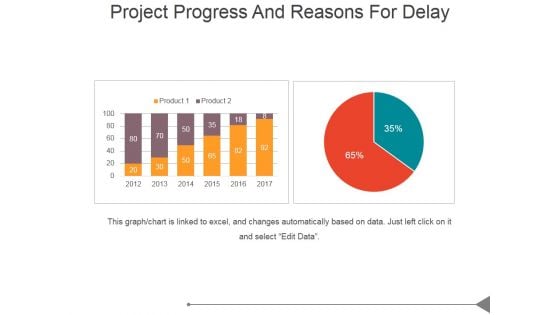
Project Progress And Reasons For Delay Ppt PowerPoint Presentation Designs Download
This is a project progress and reasons for delay ppt powerpoint presentation designs download. This is a two stage process. The stages in this process are business, marketing, success, bar graph, management.
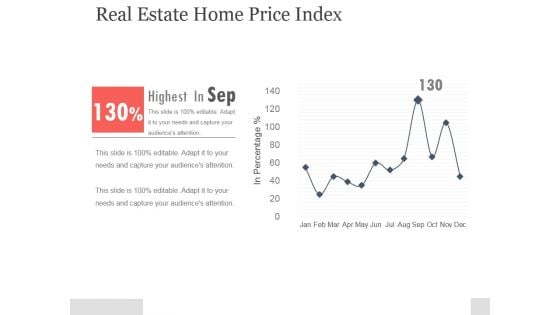
Real Estate Home Price Index Ppt PowerPoint Presentation Example
This is a real estate home price index ppt powerpoint presentation example. This is a one stage process. The stages in this process are bar graph, business, marketing, success, management.
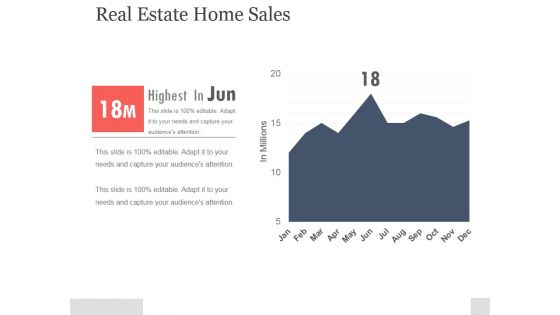
Real Estate Home Sales Ppt PowerPoint Presentation Pictures
This is a real estate home sales ppt powerpoint presentation pictures. This is a one stage process. The stages in this process are bar graph, business, marketing, success, management.
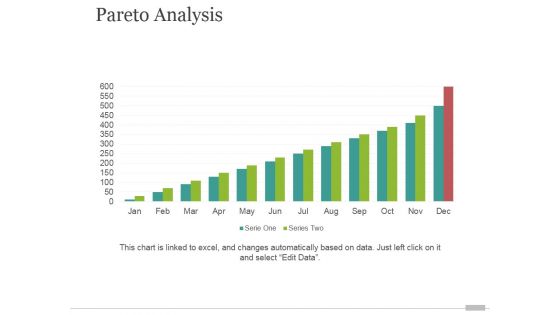
Pareto Analysis Tamplate 2 Ppt PowerPoint Presentation Graphics
This is a pareto analysis tamplate 2 ppt powerpoint presentation graphics. This is a twelve stage process. The stages in this process are bar graph, finance, marketing, strategy, analysis, business.
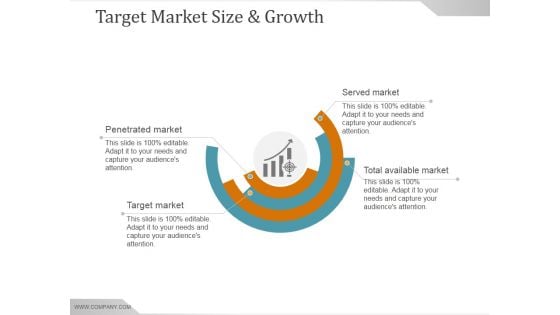
Target Market Size And Growth Ppt PowerPoint Presentation Slide Download
This is a target market size and growth ppt powerpoint presentation slide download. This is a eight stage process. The stages in this process are business, marketing, success, planning, bar graph.
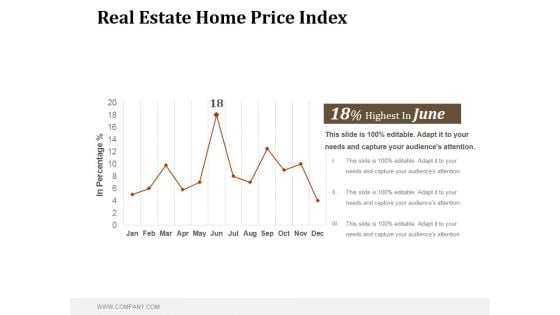
Real Estate Home Price Index Ppt PowerPoint Presentation Samples
This is a real estate home price index ppt powerpoint presentation samples. This is a one stage process. The stages in this process are in percentage, business, bar graph, marketing, success, management.
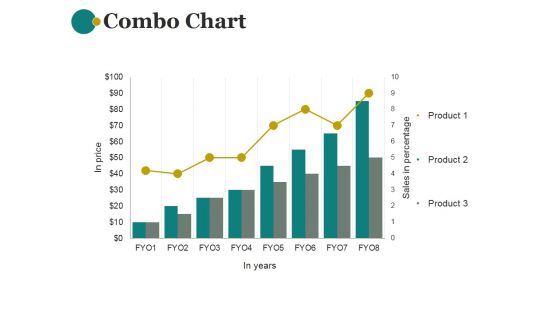
Combo Chart Ppt PowerPoint Presentation Shapes
This is a combo chart ppt powerpoint presentation shapes. This is a eight stage process. The stages in this process are combo chart, business, marketing, sales in percentage, bar graph.
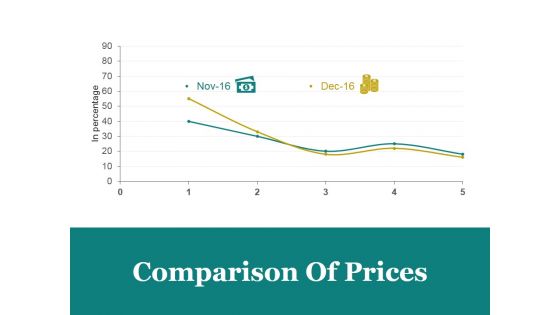
Comparison Of Prices Ppt PowerPoint Presentation Designs Download
This is a comparison of prices ppt powerpoint presentation designs download. This is a two stage process. The stages in this process are comparison of prices, marketing, in percentage, bar graph, business.
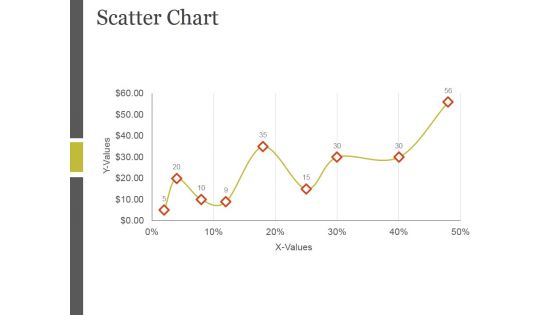
Scatter Chart Ppt PowerPoint Presentation Microsoft
This is a scatter chart ppt powerpoint presentation microsoft. This is a one stage process. The stages in this process are x values, scatter chart, bar graph, growth, business.
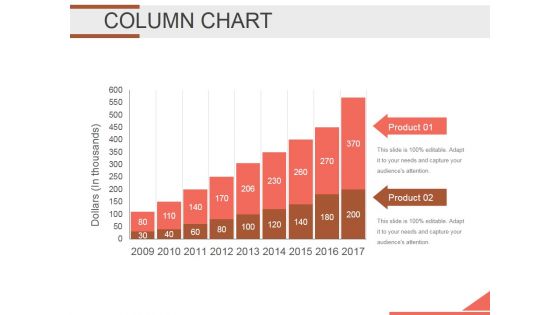
Column Chart Ppt PowerPoint Presentation Background Designs
This is a column chart ppt powerpoint presentation background designs. This is a two stage process. The stages in this process are bar graph, finance, marketing, strategy, analysis, business.
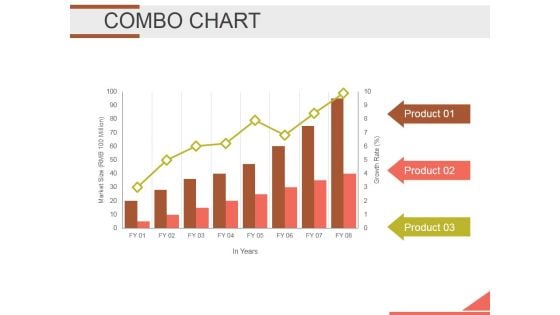
Combo Chart Ppt PowerPoint Presentation Infographics Infographics
This is a combo chart ppt powerpoint presentation infographics infographics. This is a three stage process. The stages in this process are bar graph, growth, finance, marketing, strategy, business.
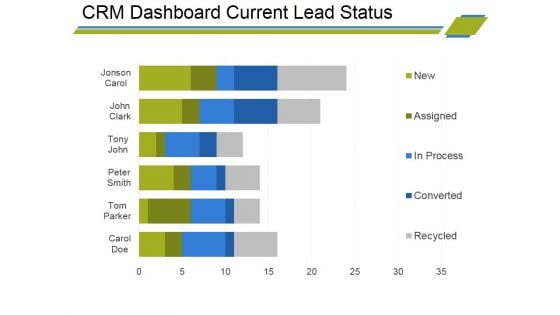
Crm Dashboard Current Lead Status Ppt PowerPoint Presentation Infographic Template Visual Aids
This is a crm dashboard current lead status ppt powerpoint presentation infographic template visual aids. This is a six stage process. The stages in this process are bar graph, finance, marketing, strategy, business, analysis.
Crm Dashboard Deals By Expected Close Date Ppt PowerPoint Presentation Portfolio Icons
This is a crm dashboard deals by expected close date ppt powerpoint presentation portfolio icons. This is a three stage process. The stages in this process are bar graph, finance, marketing, strategy, business, analysis, growth.


 Continue with Email

 Home
Home


