Brick
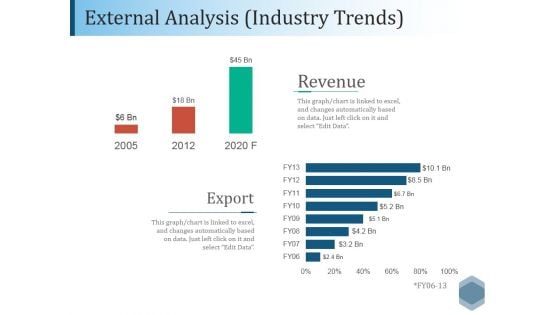
External Analysis Industry Trends Ppt PowerPoint Presentation File Outfit
This is a external analysis industry trends ppt powerpoint presentation file outfit. This is a two stage process. The stages in this process are revenue, export, bar, finance, analysis.
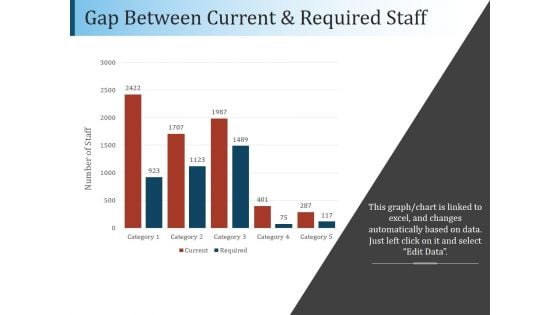
Gap Between Current And Required Staff Ppt PowerPoint Presentation File Diagrams
This is a gap between current and required staff ppt powerpoint presentation file diagrams. This is a five stage process. The stages in this process are bar, finance, analysis, planning, business.
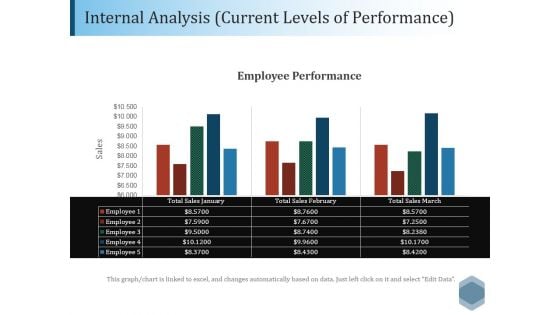
Internal Analysis Current Levels Of Performance Ppt PowerPoint Presentation Outline Format Ideas
This is a internal analysis current levels of performance ppt powerpoint presentation outline format ideas. This is a three stage process. The stages in this process are employee performance, bar, business, success, marketing.
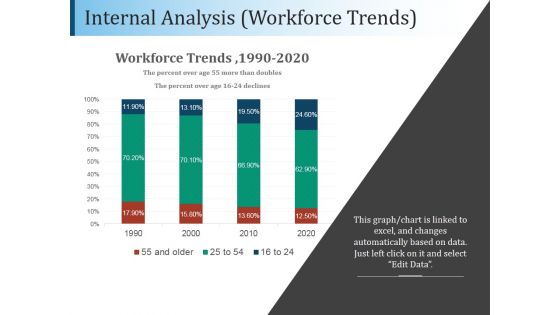
Internal Analysis Workforce Trends Ppt PowerPoint Presentation Example
This is a internal analysis workforce trends ppt powerpoint presentation example. This is a four stage process. The stages in this process are workforce trends, business, marketing, bar, finance.
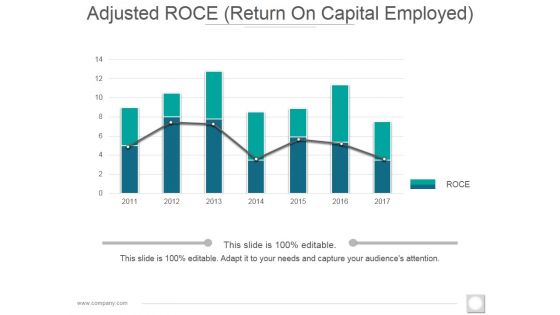
Adjusted Roce Template 1 Ppt PowerPoint Presentation Styles Background Designs
This is a adjusted roce template 1 ppt powerpoint presentation styles background designs. This is a seven stage process. The stages in this process are bar graph, finance, year, business, marketing.
Adjusted Roce Template 2 Ppt PowerPoint Presentation Icon Pictures
This is a adjusted roce template 2 ppt powerpoint presentation icon pictures. This is a five stage process. The stages in this process are bar graph, finance, percentage, business, marketing.
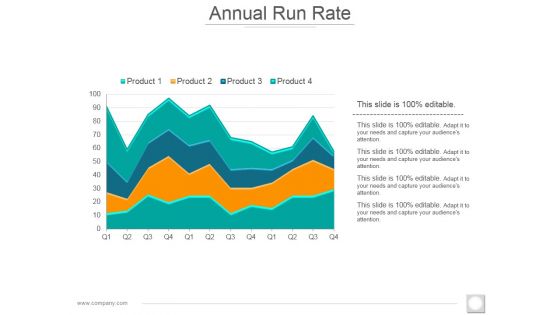
Annual Run Rate Ppt PowerPoint Presentation Gallery Mockup
This is a annual run rate ppt powerpoint presentation gallery mockup. This is a four stage process. The stages in this process are bar graph, growth, success, business, marketing.
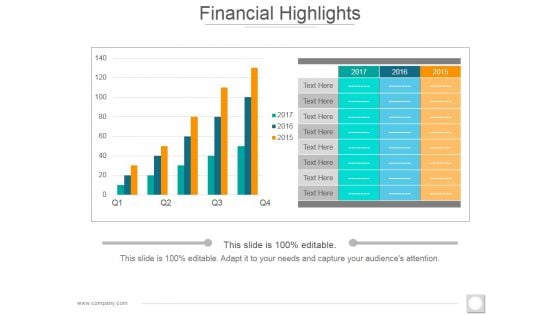
Financial Highlights Template 2 Ppt PowerPoint Presentation Slides Ideas
This is a financial highlights template 2 ppt powerpoint presentation slides ideas. This is a two stage process. The stages in this process are bar graph, growth, success, business, marketing.
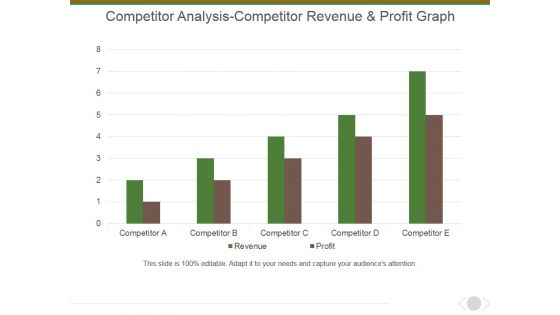
Competitor Analysis Competitor Revenue And Profit Graph Ppt PowerPoint Presentation Gallery Vector
This is a competitor analysis competitor revenue and profit graph ppt powerpoint presentation gallery vector. This is a five stage process. The stages in this process are bar graph, marketing, management, business, presentation.
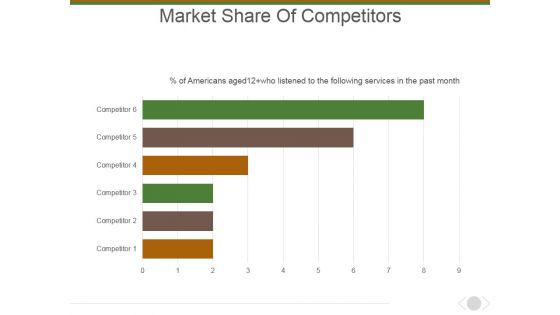
Market Share Of Competitors Ppt PowerPoint Presentation Layouts Picture
This is a market share of competitors ppt powerpoint presentation layouts picture. This is a six stage process. The stages in this process are marketing, business, management, bar graph, presentation.
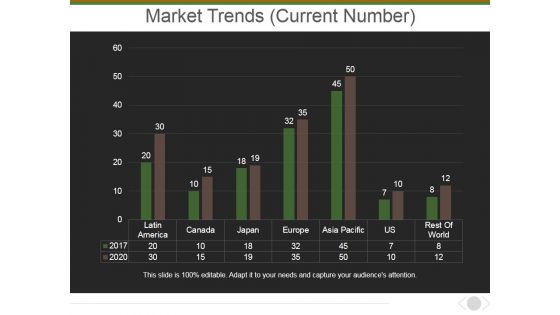
Market Trends Current Number Ppt PowerPoint Presentation Outline Rules
This is a market trends current number ppt powerpoint presentation outline rules. This is a seven stage process. The stages in this process are market, bar graph, business, country, planning.
Monthly Recurring Revenue Churn Template 1 Ppt PowerPoint Presentation Icon Microsoft
This is a monthly recurring revenue churn template 1 ppt powerpoint presentation icon microsoft. This is a four stage process. The stages in this process are bar graph, growth, success, business, marketing.
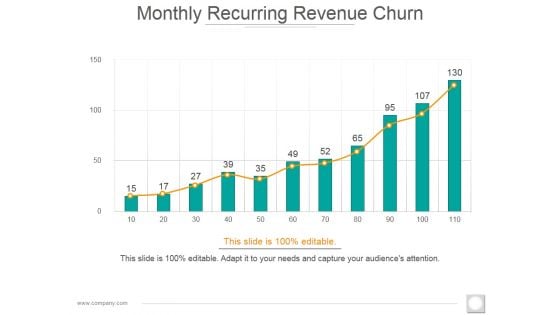
Monthly Recurring Revenue Churn Template 2 Ppt PowerPoint Presentation Diagram Images
This is a monthly recurring revenue churn template 2 ppt powerpoint presentation diagram images. This is a eleven stage process. The stages in this process are bar graph, growth, success, business, marketing.
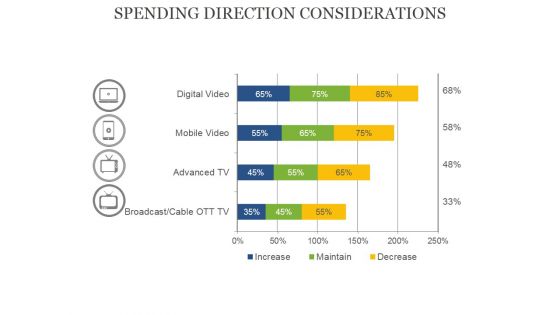
Spending Direction Considerations Ppt PowerPoint Presentation Portfolio Graphics Template
This is a spending direction considerations ppt powerpoint presentation portfolio graphics template. This is a four stage process. The stages in this process are bar graph, business, presentation, percentage, finance.
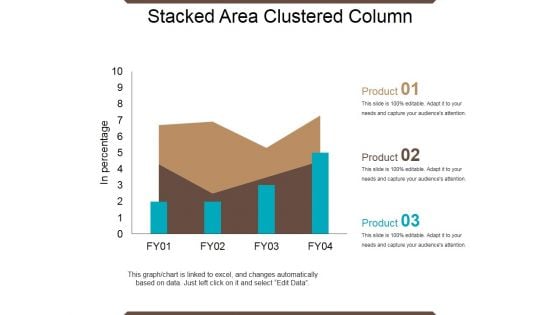
Stacked Area Clustered Column Ppt PowerPoint Presentation Show Guidelines
This is a stacked area clustered column ppt powerpoint presentation show guidelines. This is a four stage process. The stages in this process are in percentage, product, bar graph, growth, success.
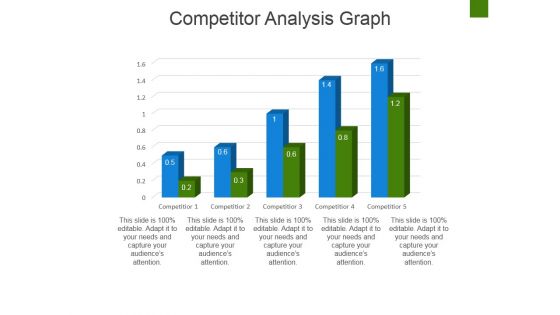
Competitor Analysis Graph Ppt PowerPoint Presentation Slides Elements
This is a competitor analysis graph ppt powerpoint presentation slides elements. This is a five stage process. The stages in this process are bar graph, finance, marketing, strategy, business.
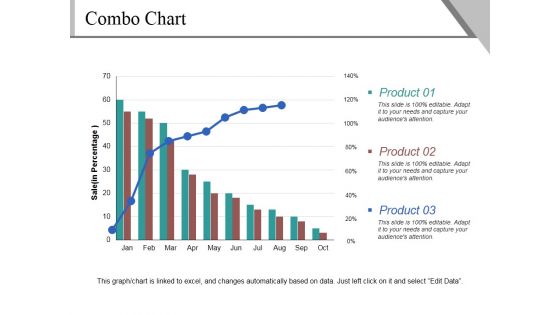
Combo Chart Ppt PowerPoint Presentation Ideas Visual Aids
This is a combo chart ppt powerpoint presentation ideas visual aids. This is a three stage process. The stages in this process are product, sales, bar graph, business, marketing.
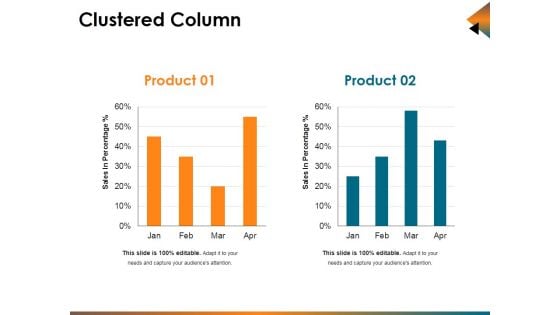
Clustered Column Ppt PowerPoint Presentation Infographic Template Background Designs
This is a clustered column ppt powerpoint presentation infographic template background designs. This is a two stage process. The stages in this process are sales in percentage, bar, business, marketing, planning.
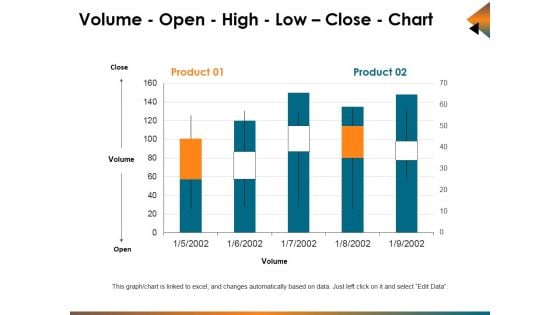
Volume Open High Low Close Chart Ppt PowerPoint Presentation Ideas Graphics Example
This is a volume open high low close chart ppt powerpoint presentation ideas graphics example. This is a five stage process. The stages in this process are business, bar graph, stock, cost, market.
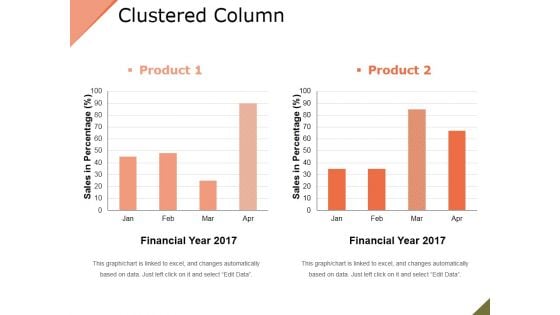
Clustered Column Ppt PowerPoint Presentation File Slide
This is a clustered column ppt powerpoint presentation file slide. This is a two stage process. The stages in this process are product, financial year, sales in percentage, bar graph.

Clustered Column Line Ppt PowerPoint Presentation Slide
This is a clustered column line ppt powerpoint presentation slide. This is a three stage process. The stages in this process are bar graph, growth, finance, product, sales in percentage.
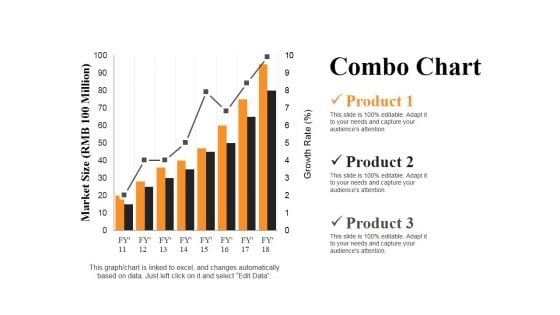
Combo Chart Ppt PowerPoint Presentation Summary Slides
This is a combo chart ppt powerpoint presentation summary slides. This is a three stage process. The stages in this process are market size, product, growth rate, bar graph, success.
Stacked Area Clustered Column Ppt PowerPoint Presentation Icon Aids
This is a stacked area clustered column ppt powerpoint presentation icon aids. This is a three stage process. The stages in this process are business, marketing, finance, bar, graph.
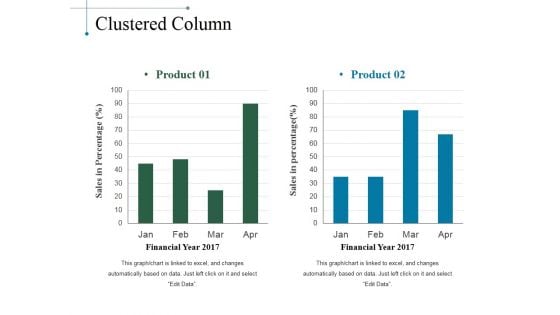
Clustered Column Ppt PowerPoint Presentation Slides Smartart
This is a clustered column ppt powerpoint presentation slides smartart. This is a two stage process. The stages in this process are product, sales in percentage, financial year, bar graph.
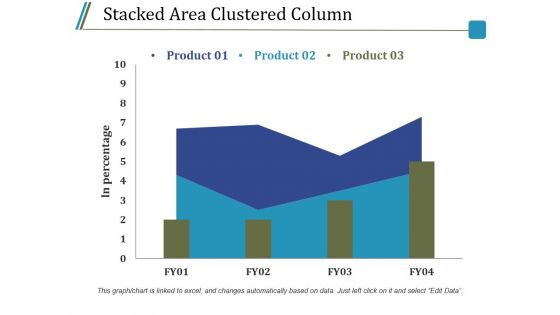
Stacked Area Clustered Column Ppt PowerPoint Presentation Model Guidelines
This is a stacked area clustered column ppt powerpoint presentation model guidelines. This is a three stage process. The stages in this process are product, in percentage, bar graph, growth, success.
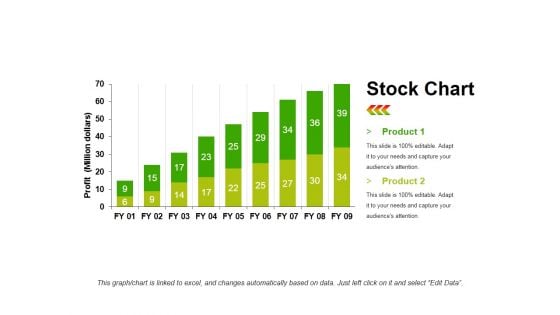
Stock Chart Template 1 Ppt PowerPoint Presentation Infographic Template Objects
This is a stock chart template 1 ppt powerpoint presentation infographic template objects. This is a two stage process. The stages in this process are product, profit, bar graph, growth, success.
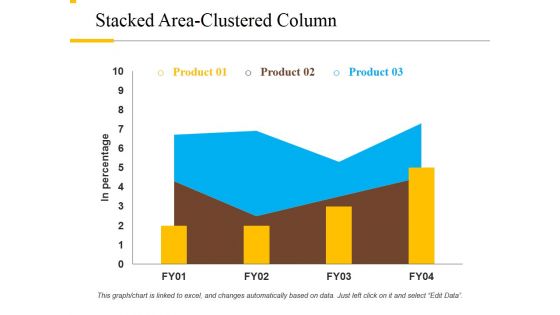
Stacked Area Clustered Column Ppt PowerPoint Presentation File Background Designs
This is a stacked area clustered column ppt powerpoint presentation file background designs. This is a three stage process. The stages in this process are product, in percentage, growth, success, bar graph.
Clustered Column Line Ppt PowerPoint Presentation Icon Ideas
This is a clustered column line ppt powerpoint presentation icon ideas. This is a three stage process. The stages in this process are product, in percentage, bar graph, success, growth.
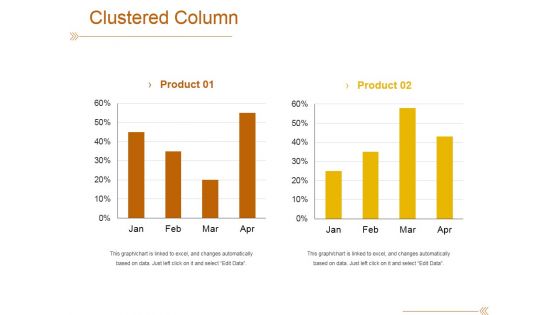
Clustered Column Template 1 Ppt PowerPoint Presentation Outline File Formats
This is a clustered column template 1 ppt powerpoint presentation outline file formats. This is a two stage process. The stages in this process are product, bar graph, success, growth, finance.
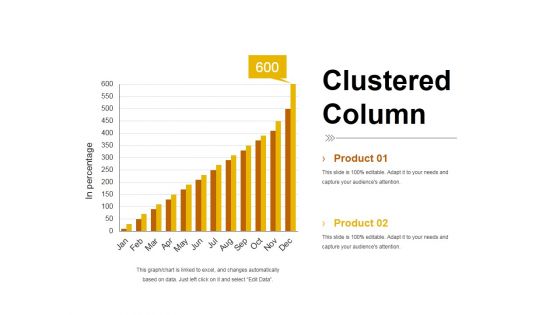
Clustered Column Template 2 Ppt PowerPoint Presentation Summary Smartart
This is a clustered column template 2 ppt powerpoint presentation summary smartart. This is a two stage process. The stages in this process are product, bar graph, in percentage, clustered column, growth.
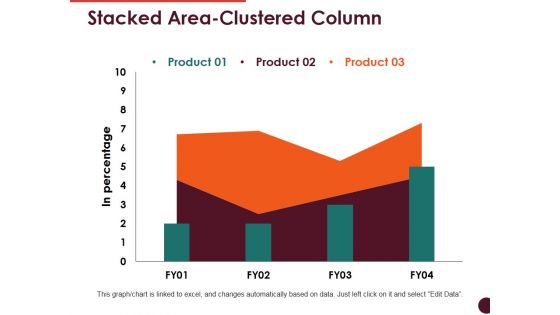
Stacked Area Clustered Column Ppt PowerPoint Presentation Summary Professional
This is a stacked area clustered column ppt powerpoint presentation summary professional. This is a three stage process. The stages in this process are product, bar graph, growth, success, in percentage.
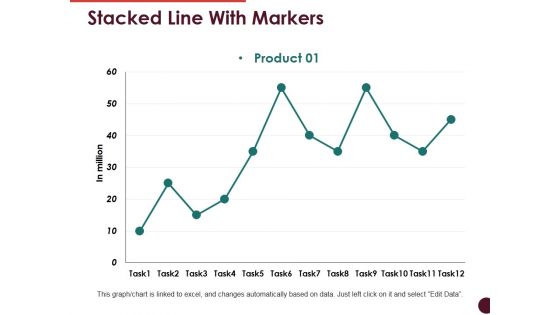
Stacked Line With Markers Ppt PowerPoint Presentation Show Templates
This is a stacked line with markers ppt powerpoint presentation show templates. This is a one stage process. The stages in this process are product, bar graph, growth, success, business.
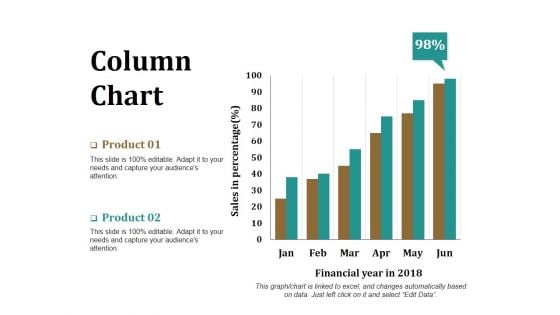
Column Chart Ppt PowerPoint Presentation Model Graphics Download
This is a column chart ppt powerpoint presentation model graphics download. This is a two stage process. The stages in this process are product, financial year, sales in percentage, bar graph, success.
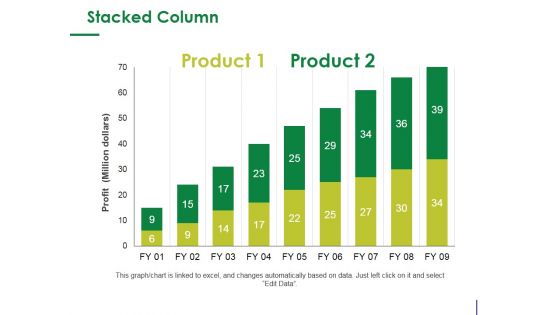
Stacked Column Ppt PowerPoint Presentation Infographic Template Design Ideas
This is a stacked column ppt powerpoint presentation infographic template design ideas. This is a two stage process. The stages in this process are product, profit, bar graph, growth, success.
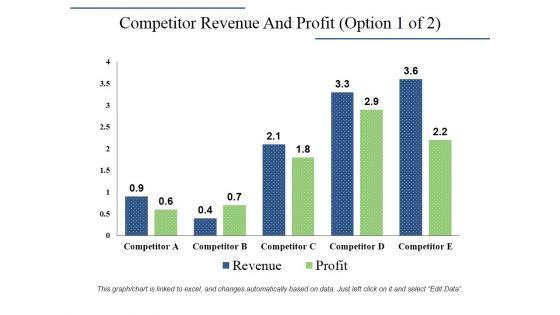
Competitor Revenue And Profit Template 1 Ppt PowerPoint Presentation Infographic Template Designs Download
This is a competitor revenue and profit template 1 ppt powerpoint presentation infographic template designs download. This is a five stage process. The stages in this process are revenue, profit, competitor, bar graph, growth.
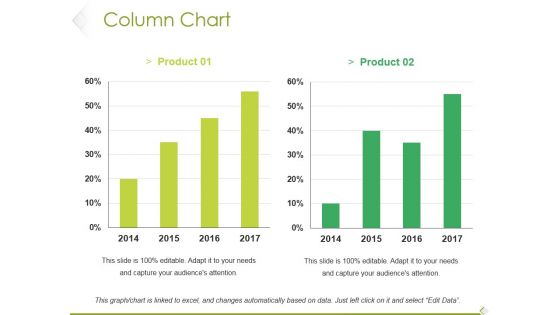
Column Chart Ppt PowerPoint Presentation Model Clipart Images
This is a column chart ppt powerpoint presentation model clipart images. This is a two stage process. The stages in this process are product, bar graph, growth, success, business.
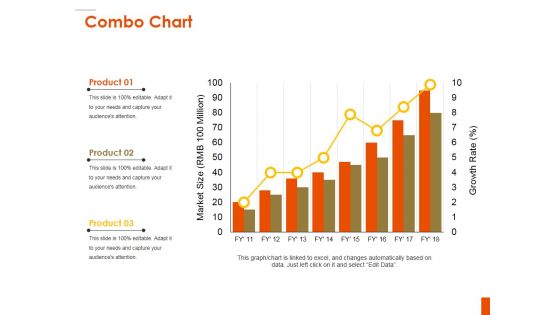
Combo Chart Ppt PowerPoint Presentation Inspiration Background
This is a combo chart ppt powerpoint presentation inspiration background. This is a three stage process. The stages in this process are product, bar graph, market size, growth, growth rate.
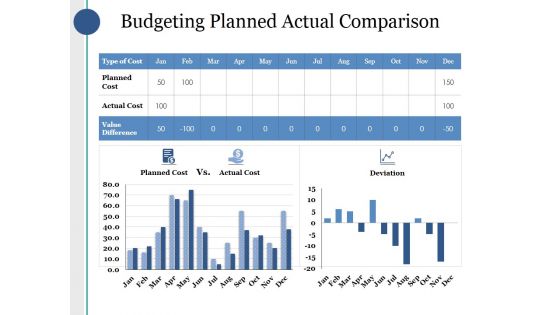
Budgeting Planned Actual Comparison Ppt PowerPoint Presentation Portfolio Background
This is a budgeting planned actual comparison ppt powerpoint presentation portfolio background. This is a three stage process. The stages in this process are planned cost, actual cost, value difference, deviation, bar graph.
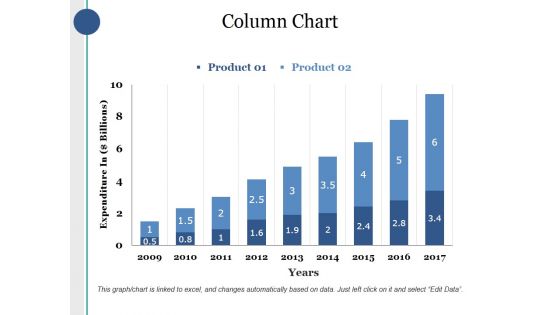
Column Chart Ppt PowerPoint Presentation Infographics Deck
This is a column chart ppt powerpoint presentation infographics deck. This is a two stage process. The stages in this process are product, expenditure in, years, bar graph, growth.
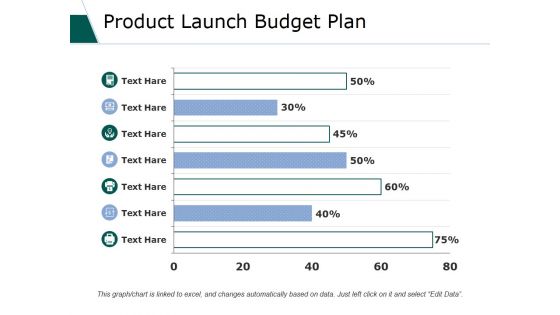
Product Launch Budget Plan Ppt PowerPoint Presentation File Formats
This is a product launch budget plan ppt powerpoint presentation file formats. This is a seven stage process. The stages in this process are business, marketing, strategy, planning, bar graph.
Clustered Column Line Ppt PowerPoint Presentation Icon Good
This is a clustered column line ppt powerpoint presentation icon good. This is a three stage process. The stages in this process are product, financial year, bar graph, business, growth.
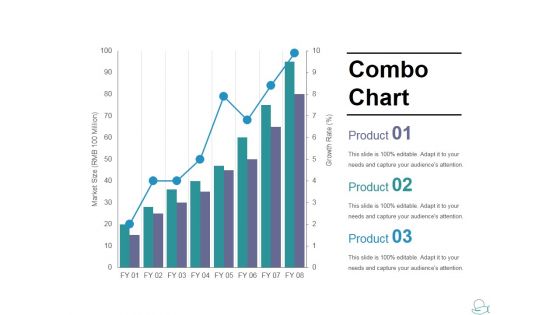
Combo Chart Ppt PowerPoint Presentation Slides Show
This is a combo chart ppt powerpoint presentation slides show. This is a three stage process. The stages in this process are combo chart, market size, product, bar graph, growth.
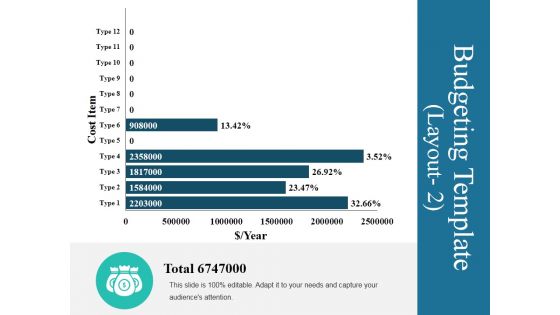
Budgeting Template 3 Ppt PowerPoint Presentation Visual Aids Model
This is a budgeting template 3 ppt powerpoint presentation visual aids model. This is a five stage process. The stages in this process are bar graph, business, marketing, finance, planning.
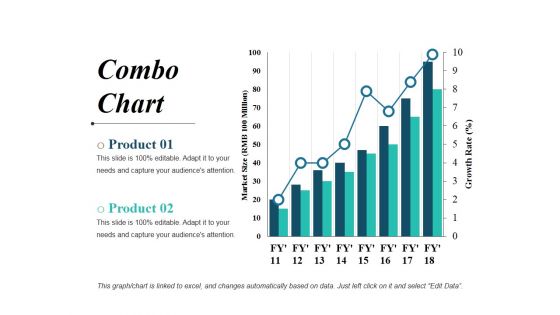
Combo Chart Ppt PowerPoint Presentation File Visual Aids
This is a combo chart ppt powerpoint presentation file visual aids. This is a two stage process. The stages in this process are bar graph, business, marketing, finance, planning.
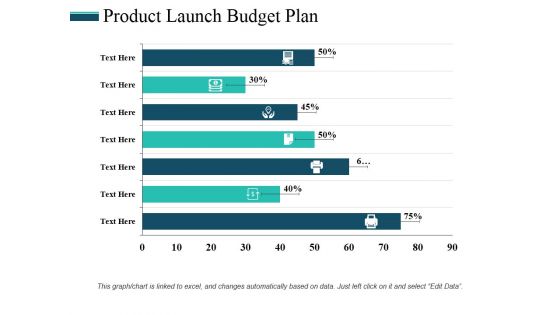
Product Launch Budget Plan Ppt PowerPoint Presentation Professional Rules
This is a product launch budget plan ppt powerpoint presentation professional rules. This is a seven stage process. The stages in this process are bar graph, finance, business, marketing, planning.
Product Launch Budget Plan Ppt PowerPoint Presentation Icon Slide
This is a product launch budget plan ppt powerpoint presentation icon slide. This is a seven stage process. The stages in this process are bar graph, icons, percentage, finance, business.
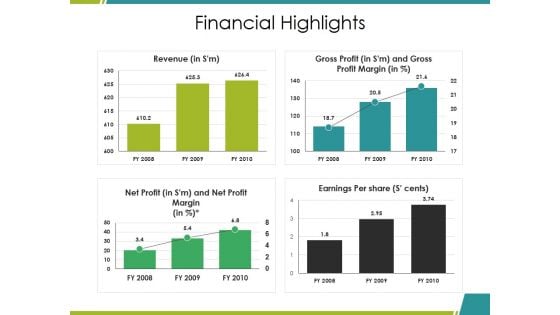
Financial Highlights Ppt PowerPoint Presentation Ideas Graphics Download
This is a financial highlights ppt powerpoint presentation ideas graphics download. This is a four stage process. The stages in this process are revenue, gross profit, net profit, earnings per share, bar graph.
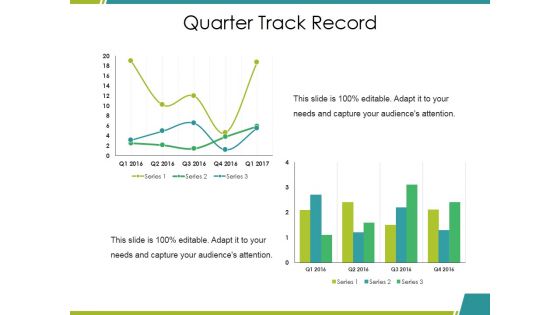
Quarter Track Record Ppt PowerPoint Presentation File Clipart Images
This is a quarter track record ppt powerpoint presentation file clipart images. This is a two stage process. The stages in this process are bar graph, growth, success, business, marketing.
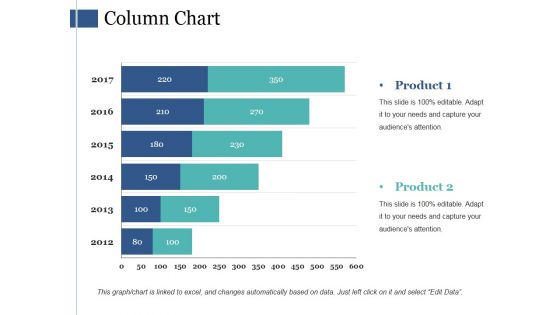
Column Chart Ppt PowerPoint Presentation Model Background Images
This is a column chart ppt powerpoint presentation model background images. This is a six stage process. The stages in this process are bar graph, marketing, finance, strategy, planning.
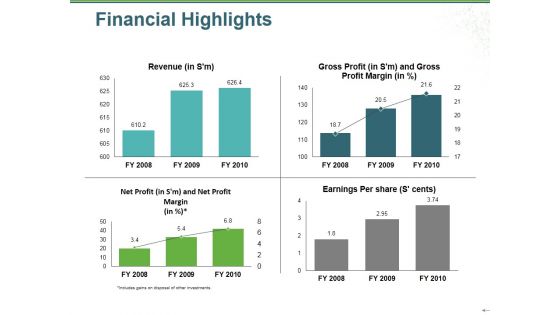
Financial Highlights Ppt PowerPoint Presentation Gallery Graphics Example
This is a financial highlights ppt powerpoint presentation gallery graphics example. This is a four stage process. The stages in this process are revenue, gross profit, net profit, earnings per share, bar graph.
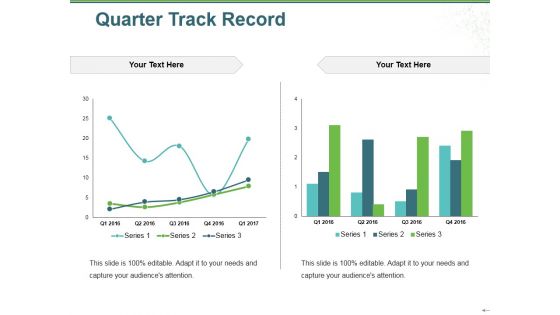
Quarter Track Record Ppt PowerPoint Presentation Gallery Images
This is a quarter track record ppt powerpoint presentation gallery images. This is a two stage process. The stages in this process are series, bar graph, growth, success, business.
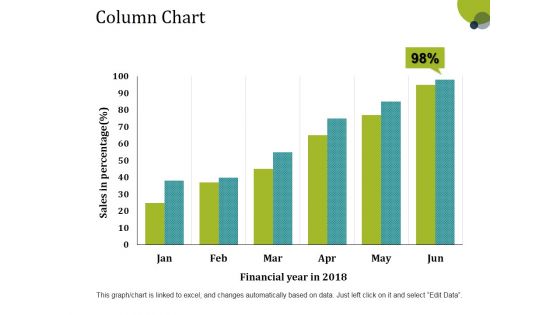
Column Chart Ppt PowerPoint Presentation Layouts Tips
This is a column chart ppt powerpoint presentation layouts tips. This is a six stage process. The stages in this process are sales in percentage, financial year, bar graph, growth, success.
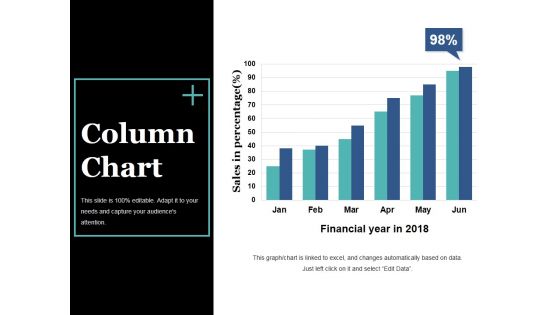
Column Chart Ppt PowerPoint Presentation Slides Visual Aids
This is a column chart ppt powerpoint presentation slides visual aids. This is a six stage process. The stages in this process are bar graph, growth, success, sales in percentage, financial year.

Combo Chart Ppt PowerPoint Presentation Inspiration Slide Portrait
This is a combo chart ppt powerpoint presentation inspiration slide portrait. This is a three stage process. The stages in this process are product, market size, bar chart, growth, success.
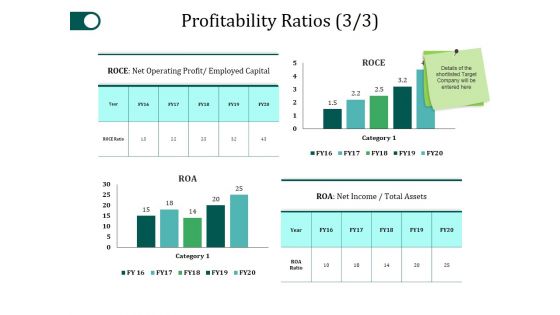
Profitability Ratios Template 3 Ppt PowerPoint Presentation Gallery Slide Portrait
This is a profitability ratios template 3 ppt powerpoint presentation gallery slide portrait. This is a four stage process. The stages in this process are category, roce, net income, business, bar graph.
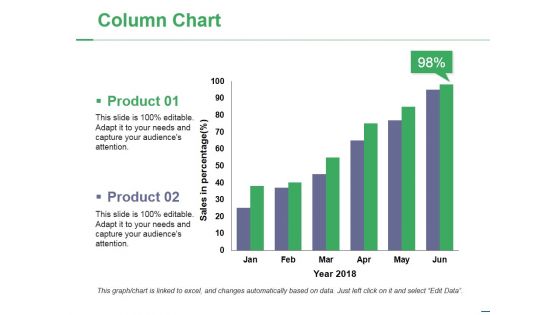
Column Chart Ppt PowerPoint Presentation Portfolio Slide Download
This is a column chart ppt powerpoint presentation portfolio slide download. This is a two stage process. The stages in this process are product, year, bar graph, success, business.
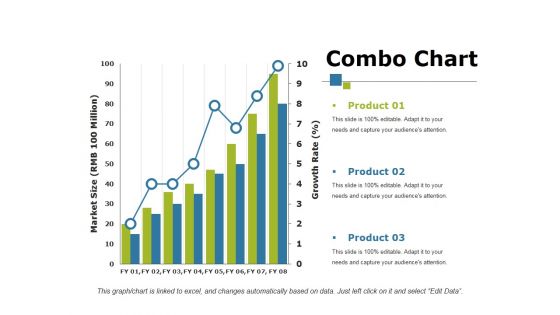
Combo Chart Ppt PowerPoint Presentation Show Influencers
This is a combo chart ppt powerpoint presentation show influencers. This is a three stage process. The stages in this process are product, bar graph, growth, growth rate, market size.
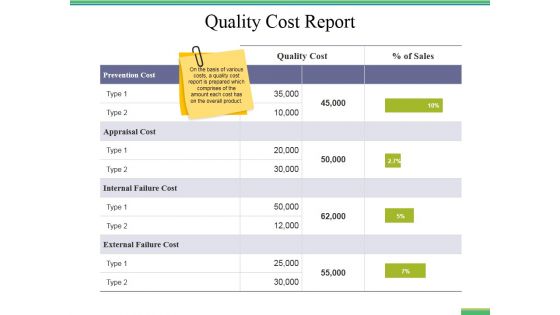
Quality Cost Report Ppt PowerPoint Presentation Styles Infographic Template
This is a quality cost report ppt powerpoint presentation styles infographic template. This is a five stage process. The stages in this process are business, finance, marketing, strategy, bar graph, analysis.
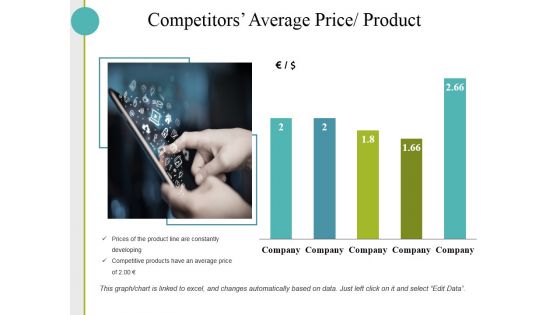
Competitors Average Price Product Ppt PowerPoint Presentation Inspiration Templates
This is a competitors average price product ppt powerpoint presentation inspiration templates. This is a five stage process. The stages in this process are business, finance, analysis, growth, investment, bar graph.
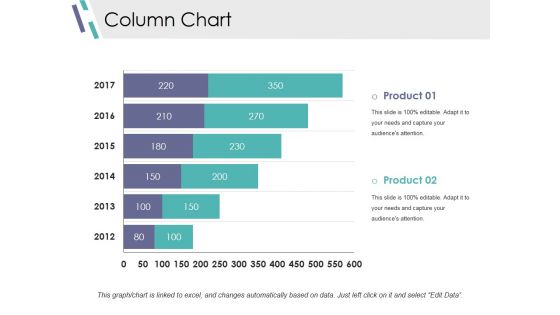
Column Chart Ppt PowerPoint Presentation Infographics Design Inspiration
This is a column chart ppt powerpoint presentation infographics design inspiration. This is a two stage process. The stages in this process are slide bar, marketing, strategy, finance, planning.


 Continue with Email

 Home
Home


