Budget Change
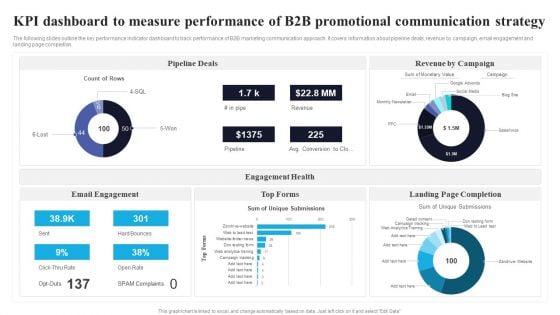
KPI Dashboard To Measure Performance Of B2B Promotional Communication Strategy Mockup PDF
The following slides outline the key performance indicator dashboard to track performance of B2B marketing communication approach. It covers information about pipeline deals, revenue by campaign, email engagement and landing page completion. Pitch your topic with ease and precision using this KPI Dashboard To Measure Performance Of B2B Promotional Communication Strategy Mockup PDF. This layout presents information on Pipeline Deals, Engagement Health, Email Engagement. It is also available for immediate download and adjustment. So, changes can be made in the color, design, graphics or any other component to create a unique layout.
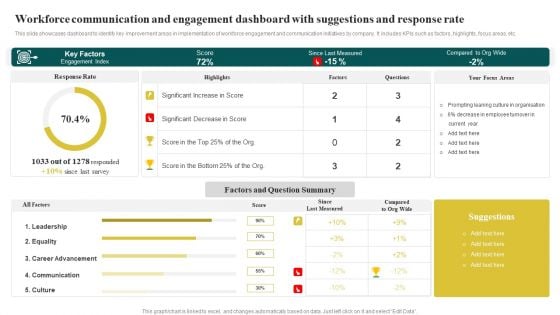
Workforce Communication And Engagement Dashboard With Suggestions And Response Rate Microsoft PDF
This slide showcases dashboard to identify key improvement areas in implementation of workforce engagement and communication initiatives by company. It includes KPIs such as factors, highlights, focus areas, etc. Pitch your topic with ease and precision using this Workforce Communication And Engagement Dashboard With Suggestions And Response Rate Microsoft PDF. This layout presents information on Key Factors, Since Last Measured, Factors And Que. It is also available for immediate download and adjustment. So, changes can be made in the color, design, graphics or any other component to create a unique layout.
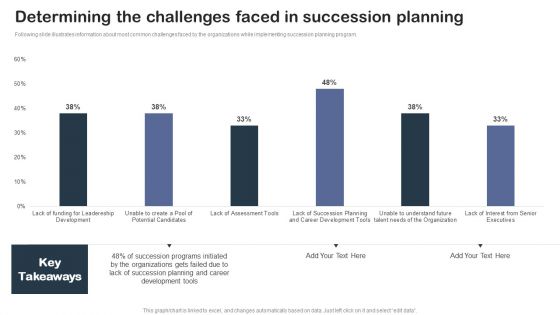
Staff Succession Planning And Development Determining The Challenges Faced Introduction PDF
Following slide illustrates information about most common challenges faced by the organizations while implementing succession planning program.Present like a pro with Staff Succession Planning And Development Determining The Challenges Faced Introduction PDF Create beautiful presentations together with your team, using our easy-to-use presentation slides. Share your ideas in real-time and make changes on the fly by downloading our templates. So whether you are in the office, on the go, or in a remote location, you can stay in sync with your team and present your ideas with confidence. With Slidegeeks presentation got a whole lot easier. Grab these presentations today.
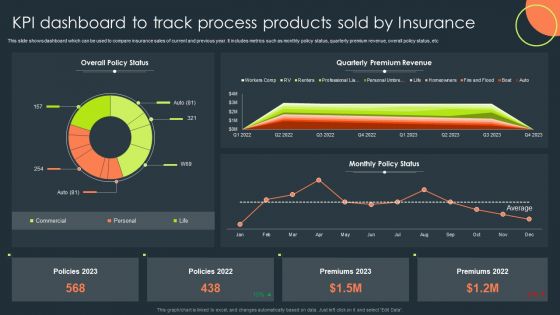
KPI Dashboard To Track Process Products Sold By Insurance Topics PDF
This slide shows dashboard which can be used to compare insurance sales of current and previous year. It includes metrics such as monthly policy status, quarterly premium revenue, overall policy status, etc. Pitch your topic with ease and precision using this KPI Dashboard To Track Process Products Sold By Insurance Topics PDF. This layout presents information on Overall Policy Status, Quarterly Premium Revenue, Monthly Policy Status. It is also available for immediate download and adjustment. So, changes can be made in the color, design, graphics or any other component to create a unique layout.
Stock Performance Dashboard For Metrics Team Management Ppt Outline Icons PDF
This slide represents the dashboard for tracking the management team member, manager, and teams ability to ensure inventory accuracy over time. It includes KPIs such as inventory, average result area scores and result areas. Pitch your topic with ease and precision using this Stock Performance Dashboard For Metrics Team Management Ppt Outline Icons PDF. This layout presents information on Result areas, Metrics Team, Needs Help. It is also available for immediate download and adjustment. So, changes can be made in the color, design, graphics or any other component to create a unique layout.
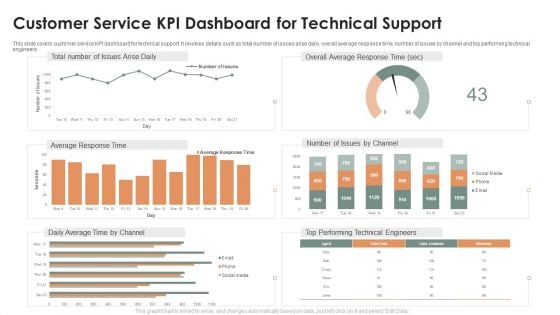
Customer Service KPI Dashboard For Technical Support Ppt Model Vector PDF
This slide covers customer service KPI dashboard for technical support. It involves details such as total number of issues arise daily, overall average response time, number of issues by channel and top performing technical engineers. Pitch your topic with ease and precision using this Customer Service KPI Dashboard For Technical Support Ppt Model Vector PDF. This layout presents information on Overall Average, Response Time, Total Number, Issues Arise Daily. It is also available for immediate download and adjustment. So, changes can be made in the color, design, graphics or any other component to create a unique layout.
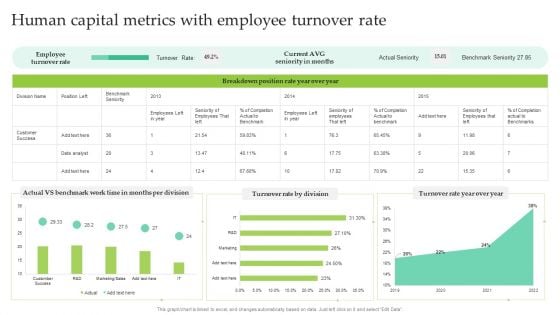
Human Capital Metrics With Employee Turnover Rate Ppt File Mockup PDF
This graph or chart is linked to excel, and changes automatically based on data. Just left click on it and select Edit Data. Showcasing this set of slides titled Human Capital Metrics With Employee Turnover Rate Ppt File Mockup PDF. The topics addressed in these templates are Employee Turnover Rate, Turnover Rate Division, Turnover Rate Year, Over Year. All the content presented in this PPT design is completely editable. Download it and make adjustments in color, background, font etc. as per your unique business setting.
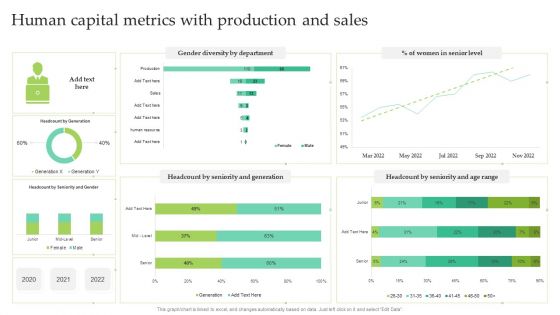
Human Capital Metrics With Production And Sales Ppt Infographic Template Summary PDF
This graph or chart is linked to excel, and changes automatically based on data. Just left click on it and select Edit Data. Showcasing this set of slides titled Human Capital Metrics With Production And Sales Ppt Infographic Template Summary PDF. The topics addressed in these templates are Women Senior Level, Gender Diversity Department, Seniority And Generation. All the content presented in this PPT design is completely editable. Download it and make adjustments in color, background, font etc. as per your unique business setting.
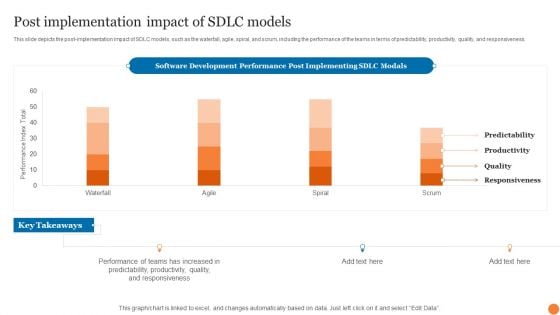
Post Implementation Impact Of SDLC Models Phases Of Software Development Procedure Portrait PDF
This slide shows the waterfall model phases, including requirement gathering analysis, system design, implementation, integration testing, Deployment, and maintenance.Present like a pro with Post Implementation Impact Of SDLC Models Phases Of Software Development Procedure Portrait PDF Create beautiful presentations together with your team, using our easy-to-use presentation slides. Share your ideas in real-time and make changes on the fly by downloading our templates. So whether you are in the office, on the go, or in a remote location, you can stay in sync with your team and present your ideas with confidence. With Slidegeeks presentation got a whole lot easier. Grab these presentations today.
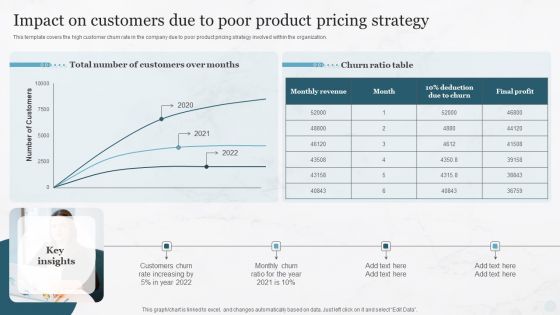
Impact On Customers Due To Poor Product Pricing Strategy Pricing Strategies For New Diagrams PDF
This template covers the high customer churn rate in the company due to poor product pricing strategy involved within the organization.Present like a pro with Impact On Customers Due To Poor Product Pricing Strategy Pricing Strategies For New Diagrams PDF Create beautiful presentations together with your team, using our easy-to-use presentation slides. Share your ideas in real-time and make changes on the fly by downloading our templates. So whether you are in the office, on the go, or in a remote location, you can stay in sync with your team and present your ideas with confidence. With Slidegeeks presentation got a whole lot easier. Grab these presentations today.
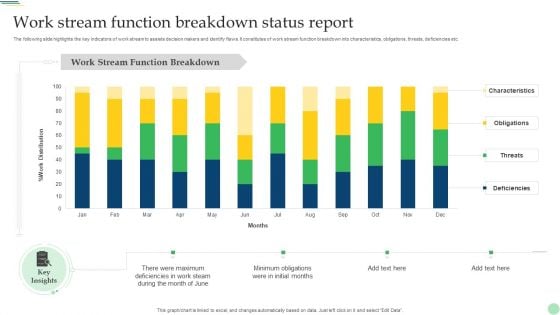
Work Stream Function Breakdown Status Report Demonstration PDF
The following slide highlights the key indicators of work stream to assists decision makers and identify flaws. It constitutes of work stream function breakdown into characteristics, obligations, threats, deficiencies etc. Pitch your topic with ease and precision using this Work Stream Function Breakdown Status Report Demonstration PDF. This layout presents information on Characteristics, Obligations, Threats, Deficiencies. It is also available for immediate download and adjustment. So, changes can be made in the color, design, graphics or any other component to create a unique layout.
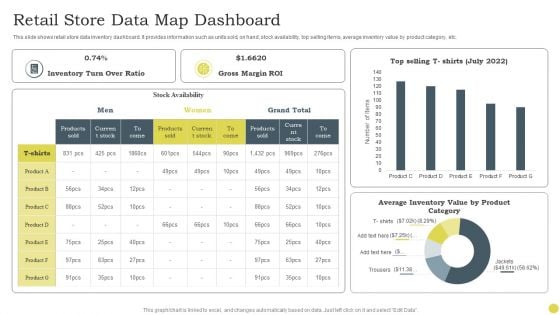
Retail Store Data Map Dashboard Ppt PowerPoint Presentation Gallery Display PDF
This slide shows retail store data inventory dashboard. It provides information such as units sold, on hand, stock availability, top selling items, average inventory value by product category, etc. Pitch your topic with ease and precision using this Retail Store Data Map Dashboard Ppt PowerPoint Presentation Gallery Display PDF. This layout presents information on Inventory Turn, Over Ratio, Gross Margin ROI. It is also available for immediate download and adjustment. So, changes can be made in the color, design, graphics or any other component to create a unique layout.
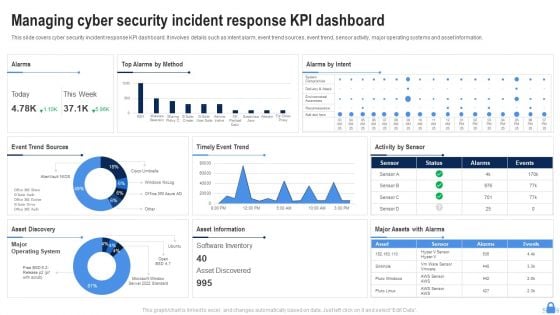
Managing Cyber Security Incident Response KPI Dashboard Ppt Layouts Shapes PDF
This slide covers cyber security incident response KPI dashboard. It involves details such as intent alarm, event trend sources, event trend, sensor activity, major operating systems and asset information. Pitch your topic with ease and precision using this Managing Cyber Security Incident Response KPI Dashboard Ppt Layouts Shapes PDF. This layout presents information on Top Alarms Method, Alarms Intent, Timely Event Trend. It is also available for immediate download and adjustment. So, changes can be made in the color, design, graphics or any other component to create a unique layout.
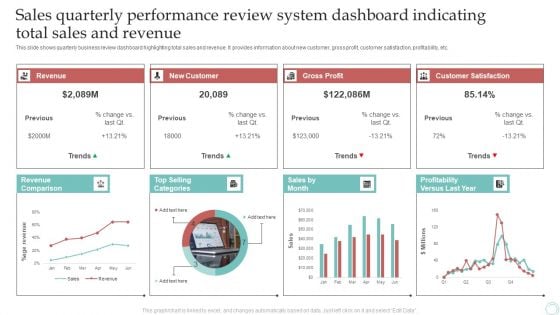
Sales Quarterly Performance Review System Dashboard Indicating Total Sales And Revenue Download PDF
This slide shows quarterly business review dashboard highlighting total sales and revenue. It provides information about new customer, gross profit, customer satisfaction, profitability, etc. Pitch your topic with ease and precision using this Sales Quarterly Performance Review System Dashboard Indicating Total Sales And Revenue Download PDF. This layout presents information on Revenue, New Customer, Gross Profit. It is also available for immediate download and adjustment. So, changes can be made in the color, design, graphics or any other component to create a unique layout.
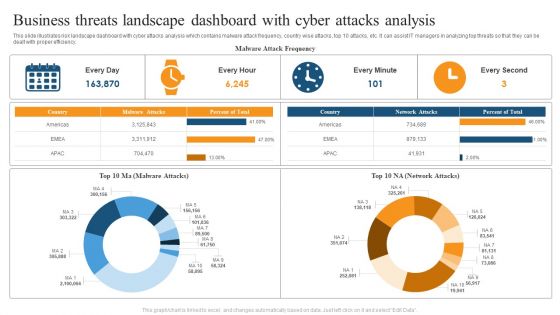
Business Threats Landscape Dashboard With Cyber Attacks Analysis Ppt Summary Brochure PDF
This slide illustrates risk landscape dashboard with cyber attacks analysis which contains malware attack frequency, country wise attacks, top 10 attacks, etc. It can assist IT managers in analyzing top threats so that they can be dealt with proper efficiency. Pitch your topic with ease and precision using this Business Threats Landscape Dashboard With Cyber Attacks Analysis Ppt Summary Brochure PDF. This layout presents information on Malware Attack Frequency, Every Minute, Every Second. It is also available for immediate download and adjustment. So, changes can be made in the color, design, graphics or any other component to create a unique layout.
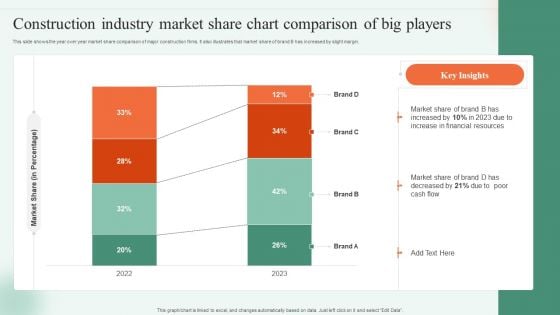
Construction Industry Market Share Chart Comparison Of Big Players Ppt Portfolio Shapes PDF
This slide shows the year over year market share comparison of major construction firms. It also illustrates that market share of brand B has increased by slight margin. Pitch your topic with ease and precision using this Construction Industry Market Share Chart Comparison Of Big Players Ppt Portfolio Shapes PDF. This layout presents information on Market Share Percentage, 2022 To 2023, Market Share. It is also available for immediate download and adjustment. So, changes can be made in the color, design, graphics or any other component to create a unique layout.
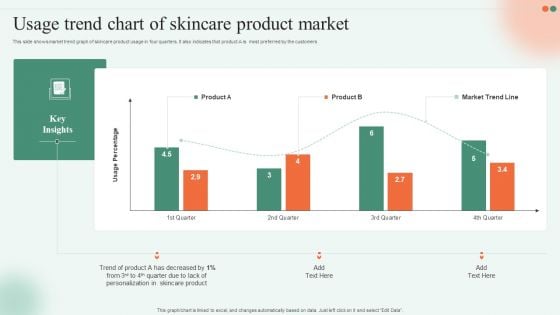
Usage Trend Chart Of Skincare Product Market Ppt Slides Graphics Download PDF
This slide shows market trend graph of skincare product usage in four quarters. It also indicates that product A is most preferred by the customers. Pitch your topic with ease and precision using this Usage Trend Chart Of Skincare Product Market Ppt Slides Graphics Download PDF. This layout presents information on Trend Product, Skincare Product, Quarter Due. It is also available for immediate download and adjustment. So, changes can be made in the color, design, graphics or any other component to create a unique layout.
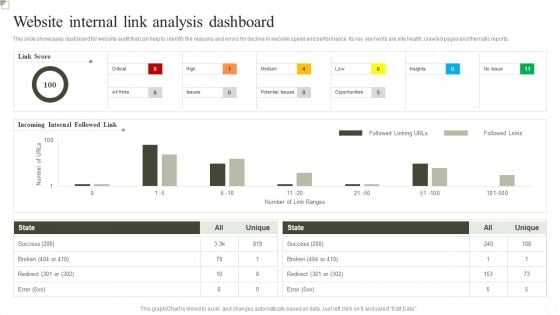
Website Internal Link Analysis Dashboard Ppt Inspiration Outline PDF
This slide showcases dashboard for website Analysis that can help to identify the reasons and errors for decline in website speed and performance. Its key elements are site health, crawled pages and thematic reports. Pitch your topic with ease and precision using this Website Internal Link Analysis Dashboard Ppt Inspiration Outline PDF. This layout presents information on Success, Incoming Internal Followed Link, Link Score. It is also available for immediate download and adjustment. So, changes can be made in the color, design, graphics or any other component to create a unique layout.
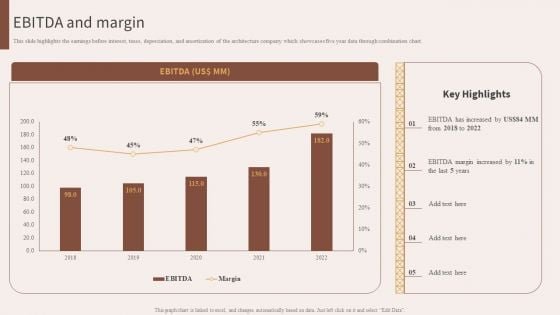
Architecture Engineering Planning Services Company EBITDA And Margin Guidelines PDF
This slide highlights the earnings before interest, taxes, depreciation, and amortization of the architecture company which showcases five year data through combination chart. This Architecture Engineering Planning Services Company EBITDA And Margin Guidelines PDF from Slidegeeks makes it easy to present information on your topic with precision. It provides customization options, so you can make changes to the colors, design, graphics, or any other component to create a unique layout. It is also available for immediate download, so you can begin using it right away. Slidegeeks has done good research to ensure that you have everything you need to make your presentation stand out. Make a name out there for a brilliant performance.
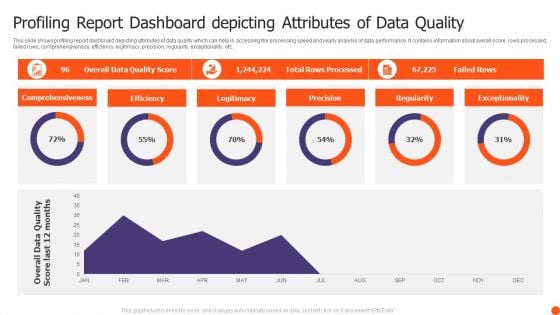
Profiling Report Dashboard Depicting Attributes Of Data Quality Themes PDF
This slide shows profiling report dashboard depicting attributes of data quality which can help in accessing the processing speed and yearly analysis of data performance. It contains information about overall score, rows processed, failed rows, comprehensiveness, efficiency, legitimacy, precision, regularity, exceptionality, etc. Pitch your topic with ease and precision using this Profiling Report Dashboard Depicting Attributes Of Data Quality Themes PDF. This layout presents information on Comprehensiveness, Efficiency, Legitimacy, Precision. It is also available for immediate download and adjustment. So, changes can be made in the color, design, graphics or any other component to create a unique layout.
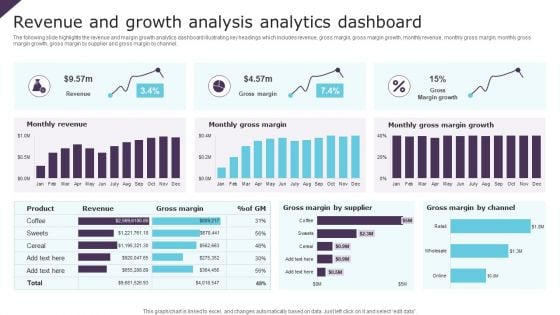
Revenue And Growth Analysis Analytics Dashboard Ppt Infographic Template Brochure PDF
The following slide highlights the revenue and margin growth analytics dashboard illustrating key headings which includes revenue, gross margin, gross margin growth, monthly revenue, monthly gross margin, monthly gross margin growth, gross margin by supplier and gross margin by channel. Pitch your topic with ease and precision using this Revenue And Growth Analysis Analytics Dashboard Ppt Infographic Template Brochure PDF. This layout presents information on Monthly Revenue, Monthly Gross Margin, Gross Margin Growth. It is also available for immediate download and adjustment. So, changes can be made in the color, design, graphics or any other component to create a unique layout.
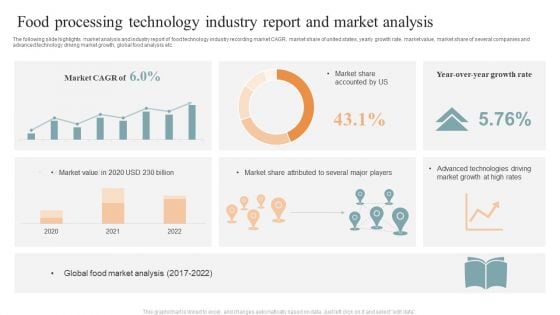
Food Processing Technology Industry Report And Market Analysis Brochure PDF
The following slide highlights market analysis and industry report of food technology industry recording market CAGR, market share of united states, yearly growth rate, market value, market share of several companies and advanced technology driving market growth, global food analysis etc. Pitch your topic with ease and precision using this Food Processing Technology Industry Report And Market Analysis Brochure PDF. This layout presents information on Market CAGR, Market Share Accounted, Global Food, Market Analysis. It is also available for immediate download and adjustment. So, changes can be made in the color, design, graphics or any other component to create a unique layout.
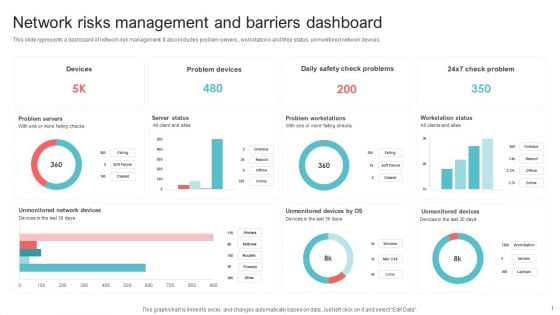
Network Risks Management And Barriers Dashboard Ppt PowerPoint Presentation Gallery Graphic Tips PDF
This slide represents a dashboard of network risk management. It also includes problem servers , workstations and their status, unmonitored network devices. Pitch your topic with ease and precision using this Network Risks Management And Barriers Dashboard Ppt PowerPoint Presentation Gallery Graphic Tips PDF. This layout presents information on Problem Servers, Server Status, Problem Workstations, Workstation Status. It is also available for immediate download and adjustment. So, changes can be made in the color, design, graphics or any other component to create a unique layout.
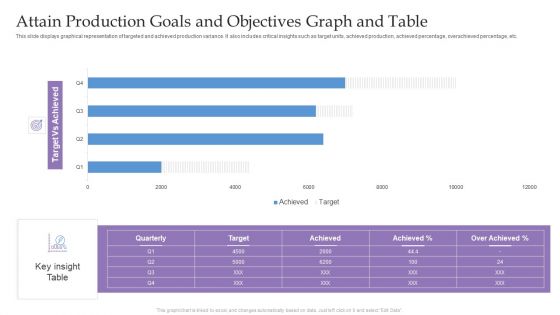
Attain Production Goals And Objectives Graph And Table Ppt Infographic Template Visuals PDF
This slide displays graphical representation of targeted and achieved production variance. It also includes critical insights such as target units, achieved production, achieved percentage, overachieved percentage, etc. Pitch your topic with ease and precision using this Attain Production Goals And Objectives Graph And Table Ppt Infographic Template Visuals PDF. This layout presents information on Target Vs Achieved, Key insight Table, Quarterly. It is also available for immediate download and adjustment. So, changes can be made in the color, design, graphics or any other component to create a unique layout.
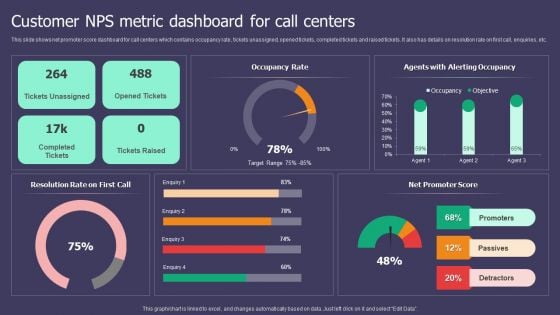
Customer NPS Metric Dashboard For Call Centers Ppt Inspiration Smartart PDF
This slide shows net promoter score dashboard for call centers which contains occupancy rate, tickets unassigned, opened tickets, completed tickets and raised tickets. It also has details on resolution rate on first call, enquiries, etc. Pitch your topic with ease and precision using this Customer NPS Metric Dashboard For Call Centers Ppt Inspiration Smartart PDF. This layout presents information on Occupancy Rate, Resolution Rate, Net Promoter Score. It is also available for immediate download and adjustment. So, changes can be made in the color, design, graphics or any other component to create a unique layout.
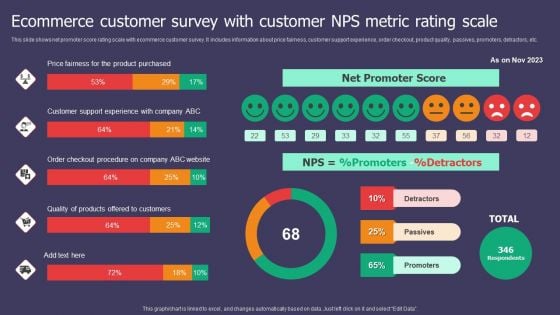
Ecommerce Customer Survey With Customer NPS Metric Rating Scale Ppt Inspiration Visual Aids PDF
This slide shows net promoter score rating scale with ecommerce customer survey. It includes information about price fairness, customer support experience, order checkout, product quality, passives, promoters, detractors, etc. Pitch your topic with ease and precision using this Ecommerce Customer Survey With Customer NPS Metric Rating Scale Ppt Inspiration Visual Aids PDF. This layout presents information on Net Promoter Score, Price Fairness, Product Purchased. It is also available for immediate download and adjustment. So, changes can be made in the color, design, graphics or any other component to create a unique layout.
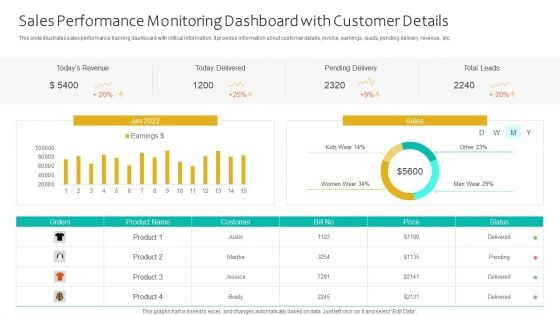
Sales Performance Monitoring Dashboard With Customer Details Ppt Infographics Themes PDF
This slide illustrates sales performance tracking dashboard with critical information. It provides information about customer details, invoice, earnings, leads, pending delivery, revenue, etc. Pitch your topic with ease and precision using this Sales Performance Monitoring Dashboard With Customer Details Ppt Infographics Themes PDF. This layout presents information on Todays Revenue, Today Delivered, Pending Delivery, Total Leads. It is also available for immediate download and adjustment. So, changes can be made in the color, design, graphics or any other component to create a unique layout.
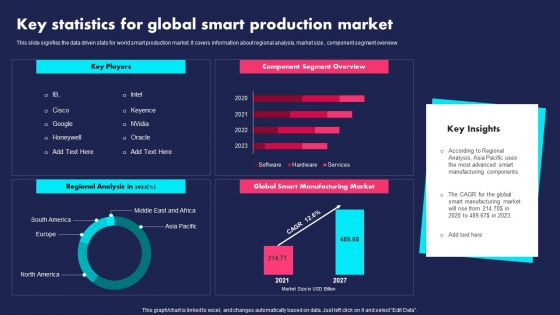
Key Statistics For Global Smart Production Market Ppt PowerPoint Presentation File Slides PDF
This slide signifies the data driven stats for world smart production market. It covers information about regional analysis, market size, component segment overview. Pitch your topic with ease and precision using this Key Statistics For Global Smart Production Market Ppt PowerPoint Presentation File Slides PDF. This layout presents information on Key Players, Component Segment Overview, Regional Analysis. It is also available for immediate download and adjustment. So, changes can be made in the color, design, graphics or any other component to create a unique layout.
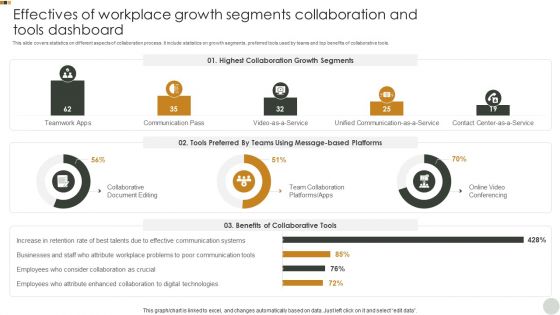
Effectives Of Workplace Growth Segments Collaboration And Tools Dashboard Graphics PDF
This slide covers statistics on different aspects of collaboration process. It include statistics on growth segments, preferred tools used by teams and top benefits of collaborative tools. Pitch your topic with ease and precision using this Effectives Of Workplace Growth Segments Collaboration And Tools Dashboard Graphics PDF. This layout presents information on Highest Collaboration, Growth Segments, Tools Preferred. It is also available for immediate download and adjustment. So, changes can be made in the color, design, graphics or any other component to create a unique layout.
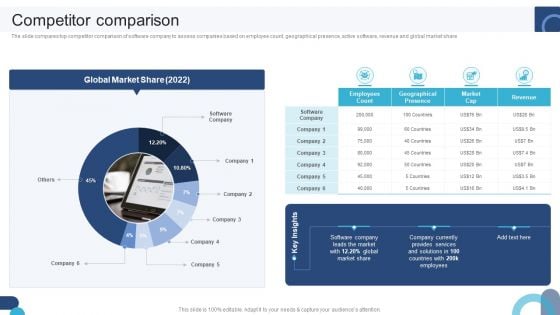
Digital Application Software Development Business Profile Competitor Comparison Graphics PDF
The slide compares top competitor comparison of software company to assess companies based on employee count, geographical presence, active software, revenue and global market share. Present like a pro with Digital Application Software Development Business Profile Competitor Comparison Graphics PDF Create beautiful presentations together with your team, using our easy-to-use presentation slides. Share your ideas in real-time and make changes on the fly by downloading our templates. So whether youre in the office, on the go, or in a remote location, you can stay in sync with your team and present your ideas with confidence. With Slidegeeks presentation got a whole lot easier. Grab these presentations today.
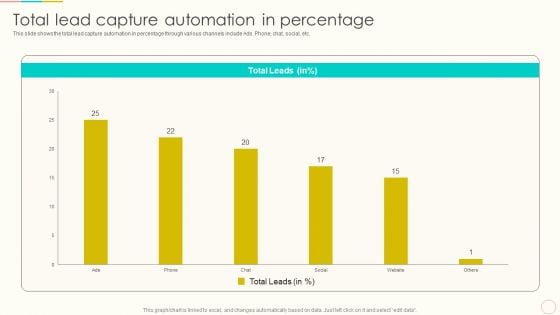
Lead Management To Engage Potential Customers Total Lead Capture Automation In Percentage Rules PDF
This slide shows the total lead capture automation in percentage through various channels include Ads. Phone, chat, social, etc. This Lead Management To Engage Potential Customers Total Lead Capture Automation In Percentage Rules PDF from Slidegeeks makes it easy to present information on your topic with precision. It provides customization options, so you can make changes to the colors, design, graphics, or any other component to create a unique layout. It is also available for immediate download, so you can begin using it right away. Slidegeeks has done good research to ensure that you have everything you need to make your presentation stand out. Make a name out there for a brilliant performance.
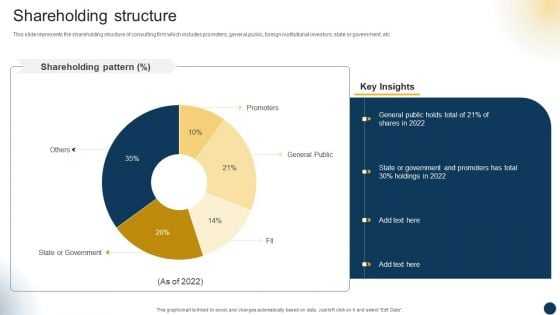
Organizational Advisory Solutions Business Profile Shareholding Structure Designs PDF
This slide represents the shareholding structure of consulting firm which includes promoters, general public, foreign institutional investors, state or government, etc. This Organizational Advisory Solutions Business Profile Shareholding Structure Designs PDF from Slidegeeks makes it easy to present information on your topic with precision. It provides customization options, so you can make changes to the colors, design, graphics, or any other component to create a unique layout. It is also available for immediate download, so you can begin using it right away. Slidegeeks has done good research to ensure that you have everything you need to make your presentation stand out. Make a name out there for a brilliant performance.
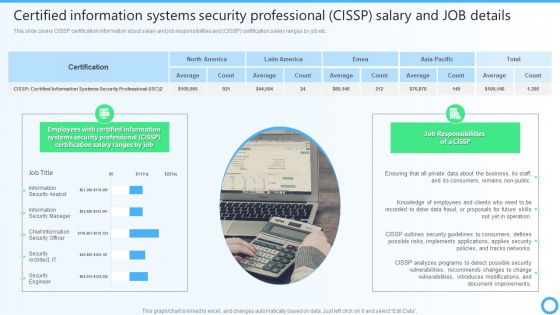
Certified Information Systems Security Professional CISSP Salary And JOB Details IT Certifications To Enhance Introduction PDF
This slide covers CISSP certification information about salary and job responsibilities and CISSP certification salary ranges by job etc. Present like a pro with Certified Information Systems Security Professional CISSP Salary And JOB Details IT Certifications To Enhance Introduction PDF Create beautiful presentations together with your team, using our easy-to-use presentation slides. Share your ideas in real-time and make changes on the fly by downloading our templates. So whether you are in the office, on the go, or in a remote location, you can stay in sync with your team and present your ideas with confidence. With Slidegeeks presentation got a whole lot easier. Grab these presentations today.
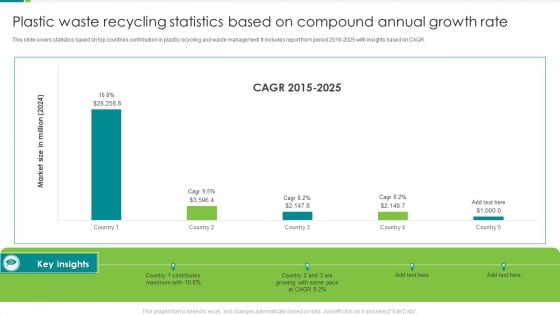
Plastic Waste Recycling Statistics Based On Compound Annual Growth Rate Inspiration PDF
This slide covers statistics based on top countries contribution in plastic recycling and waste management. It includes report from period 2019-2025 with insights based on CAGR. Pitch your topic with ease and precision using this Plastic Waste Recycling Statistics Based On Compound Annual Growth Rate Inspiration PDF. This layout presents information on Contributes Maximum, 2015 To 2025. It is also available for immediate download and adjustment. So, changes can be made in the color, design, graphics or any other component to create a unique layout.
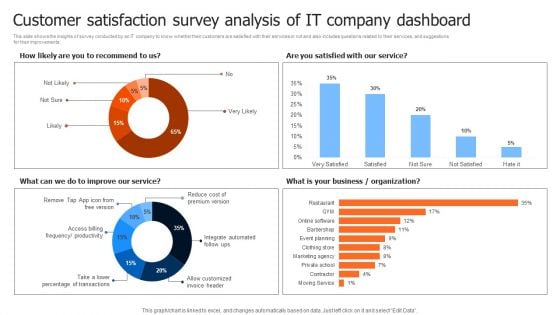
Customer Satisfaction Survey Analysis Of It Company Dashboard Themes PDF
This slide shows the insights of survey conducted by an IT company to know whether their customers are satisfied with their services or not and also includes questions related to their services, and suggestions for their improvements. Pitch your topic with ease and precision using this Customer Satisfaction Survey Analysis Of It Company Dashboard Themes PDF. This layout presents information on Organization, Business, Service. It is also available for immediate download and adjustment. So, changes can be made in the color, design, graphics or any other component to create a unique layout.
VR Technology Market Overview Ppt PowerPoint Presentation Icon Example PDF
The following slide highlights VR technology market overview, including its growth drivers such as increase in smartphone penetration, post COVID-19 growth of virtual reality market and boost in gaming industry. Pitch your topic with ease and precision using this VR Technology Market Overview Ppt PowerPoint Presentation Icon Example PDF. This layout presents information on Growth Drivers, Key Takeaways, Exponential Virtual Reality. It is also available for immediate download and adjustment. So, changes can be made in the color, design, graphics or any other component to create a unique layout.
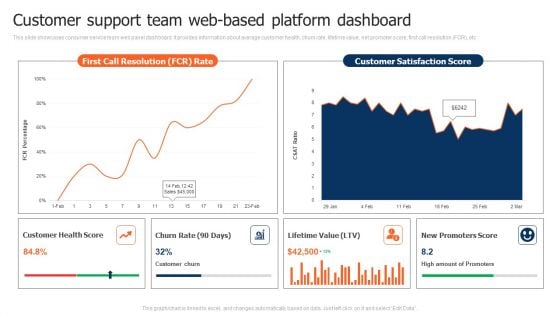
Customer Support Team Web Based Platform Dashboard Demonstration PDF
This slide showcases consumer service team web panel dashboard. It provides information about average customer health, churn rate, lifetime value, net promoter score, first call resolution FCR, etc. Pitch your topic with ease and precision using this Customer Support Team Web Based Platform Dashboard Demonstration PDF. This layout presents information on Churn Rate, Lifetime Value, Customer Health Score. It is also available for immediate download and adjustment. So, changes can be made in the color, design, graphics or any other component to create a unique layout.
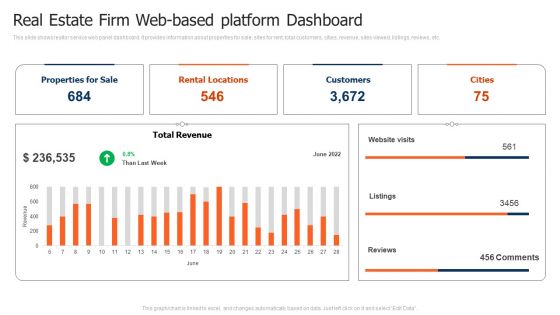
Real Estate Firm Web Based Platform Dashboard Background PDF
This slide shows realtor service web panel dashboard. It provides information about properties for sale, sites for rent, total customers, cities, revenue, sites viewed, listings, reviews, etc. Pitch your topic with ease and precision using this Real Estate Firm Web Based Platform Dashboard Background PDF. This layout presents information on Total Revenue, Rental Locations, Properties For Sale. It is also available for immediate download and adjustment. So, changes can be made in the color, design, graphics or any other component to create a unique layout.

Financial Highlights For Construction Company Yearly Report Template PDF
This slide showcases report for construction company annual financial highlights that can help in analyzing the financial health of organization and help investors to make informed decisions. It outlines information about turnover, profit before tax, profit after, equity capital and reserves. Pitch your topic with ease and precision using this Financial Highlights For Construction Company Yearly Report Template PDF. This layout presents information on Reserve And Surplus, Profit, Turnover. It is also available for immediate download and adjustment. So, changes can be made in the color, design, graphics or any other component to create a unique layout.
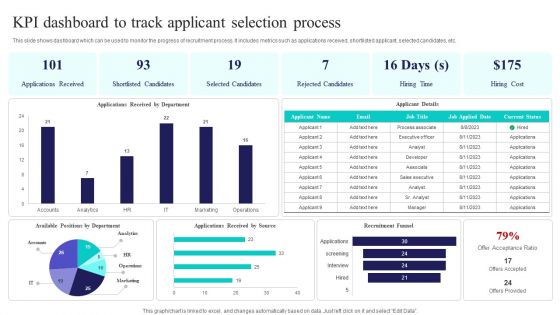
Kpi Dashboard To Track Applicant Selection Process Ppt PowerPoint Presentation File Graphics Template PDF
This slide shows dashboard which can be used to monitor the progress of recruitment process. It includes metrics such as applications received, shortlisted applicant, selected candidates, etc. Pitch your topic with ease and precision using this Kpi Dashboard To Track Applicant Selection Process Ppt PowerPoint Presentation File Graphics Template PDF. This layout presents information on Applications Received, Shortlisted Candidates, Selected Candidates. It is also available for immediate download and adjustment. So, changes can be made in the color, design, graphics or any other component to create a unique layout.
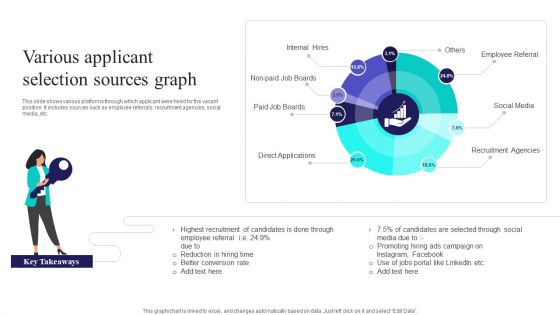
Various Applicant Selection Sources Graph Ppt PowerPoint Presentation Gallery Slide Download PDF
This slide shows various platforms through which applicant were hired for the vacant position. It includes sources such as employee referrals, recruitment agencies, social media, etc. Pitch your topic with ease and precision using this Various Applicant Selection Sources Graph Ppt PowerPoint Presentation Gallery Slide Download PDF. This layout presents information on Internal Hires, Paid Job Boards, Direct Applications. It is also available for immediate download and adjustment. So, changes can be made in the color, design, graphics or any other component to create a unique layout.
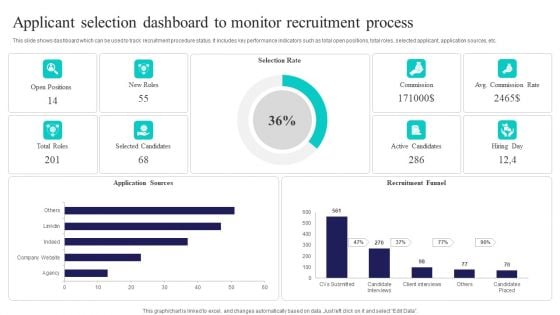
Applicant Selection Dashboard To Monitor Recruitment Process Sample PDF
This slide shows dashboard which can be used to track recruitment procedure status. It includes key performance indicators such as total open positions, total roles, selected applicant, application sources, etc. Pitch your topic with ease and precision using this Applicant Selection Dashboard To Monitor Recruitment Process Sample PDF. This layout presents information on Selection Rate, Recruitment Funnel, Application Sources. It is also available for immediate download and adjustment. So, changes can be made in the color, design, graphics or any other component to create a unique layout.
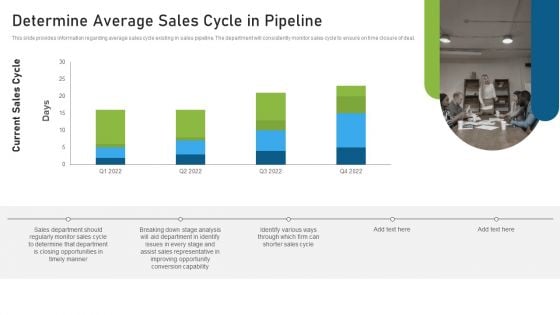
CRM Pipeline Administration Determine Average Sales Cycle In Pipeline Ppt Slides Skills PDF
This slide provides information regarding average sales cycle existing in sales pipeline. The department will consistently monitor sales cycle to ensure on time closure of deal. Present like a pro with CRM Pipeline Administration Determine Average Sales Cycle In Pipeline Ppt Slides Skills PDF Create beautiful presentations together with your team, using our easy-to-use presentation slides. Share your ideas in real-time and make changes on the fly by downloading our templates. So whether youre in the office, on the go, or in a remote location, you can stay in sync with your team and present your ideas with confidence. With Slidegeeks presentation got a whole lot easier. Grab these presentations today.
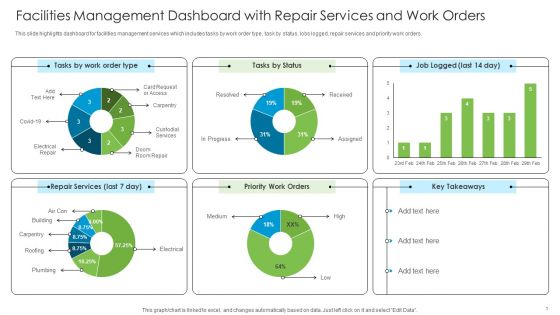
Facilities Management Dashboard With Repair Services And Work Orders Mockup PDF
This slide highlights dashboard for facilities management services which includes tasks by work order type, task by status, lobs logged, repair services and priority work orders.Present like a pro with Facilities Management Dashboard With Repair Services And Work Orders Mockup PDF Create beautiful presentations together with your team, using our easy-to-use presentation slides. Share your ideas in real-time and make changes on the fly by downloading our templates. So whether you are in the office, on the go, or in a remote location, you can stay in sync with your team and present your ideas with confidence. With Slidegeeks presentation got a whole lot easier. Grab these presentations today.
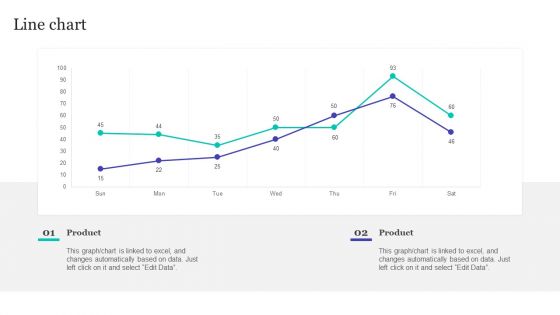
Strategic Brand Refreshing Actions Line Chart Information PDF
This Strategic Brand Refreshing Actions Line Chart Information PDF from Slidegeeks makes it easy to present information on your topic with precision. It provides customization options, so you can make changes to the colors, design, graphics, or any other component to create a unique layout. It is also available for immediate download, so you can begin using it right away. Slidegeeks has done good research to ensure that you have everything you need to make your presentation stand out. Make a name out there for a brilliant performance.
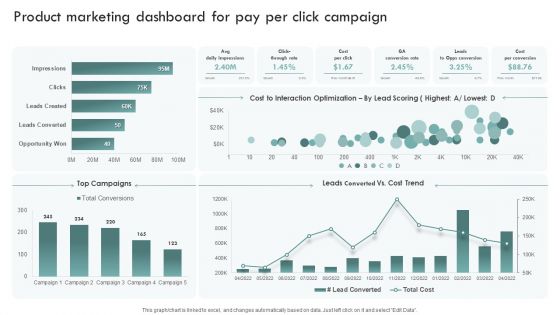
Brand Awareness Plan Product Marketing Dashboard For Pay Per Click Campaign Template PDF
This graph or chart is linked to excel, and changes automatically based on data. Just left click on it and select Edit Data. Get a simple yet stunning designed Brand Awareness Plan Product Marketing Dashboard For Pay Per Click Campaign Template PDF. It is the best one to establish the tone in your meetings. It is an excellent way to make your presentations highly effective. So, download this PPT today from Slidegeeks and see the positive impacts. Our easy-to-edit Brand Awareness Plan Product Marketing Dashboard For Pay Per Click Campaign Template PDF can be your go-to option for all upcoming conferences and meetings. So, what are you waiting for Grab this template today.
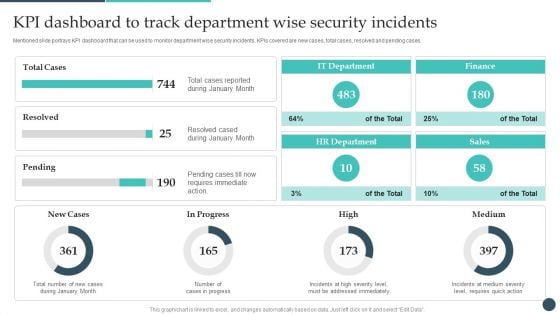
Safety Breach Response Playbook KPI Dashboard To Track Department Wise Rules PDF
Mentioned slide portrays KPI dashboard that can be used to monitor department wise security incidents. KPIs covered are new cases, total cases, resolved and pending cases. Present like a pro with Safety Breach Response Playbook KPI Dashboard To Track Department Wise Rules PDF Create beautiful presentations together with your team, using our easy-to-use presentation slides. Share your ideas in real-time and make changes on the fly by downloading our templates. So whether youre in the office, on the go, or in a remote location, you can stay in sync with your team and present your ideas with confidence. With Slidegeeks presentation got a whole lot easier. Grab these presentations today.
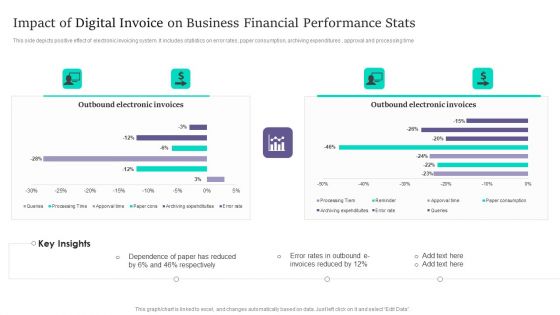
Impact Of Digital Invoice On Business Financial Performance Stats Infographics PDF
This side depicts positive effect of electronic invoicing system. It includes statistics on error rates, paper consumption, archiving expenditures , approval and processing time. Pitch your topic with ease and precision using this Impact Of Digital Invoice On Business Financial Performance Stats Infographics PDF. This layout presents information on Impact Of Digital Invoice, Business Financial Performance Stats. It is also available for immediate download and adjustment. So, changes can be made in the color, design, graphics or any other component to create a unique layout.
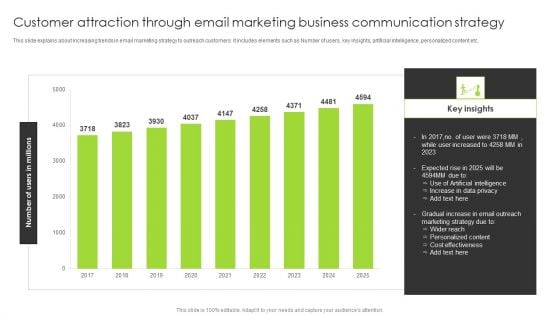
Customer Attraction Through Email Marketing Business Communication Strategy Portrait PDF
This slide explains about increasing trends in email marketing strategy to outreach customers. It includes elements such as Number of users, key insights, artificial intelligence, personalized content etc. Pitch your topic with ease and precision using this Customer Attraction Through Email Marketing Business Communication Strategy Portrait PDF. This layout presents information on Gradual Increase, Email Outreach, Marketing Strategy. It is also available for immediate download and adjustment. So, changes can be made in the color, design, graphics or any other component to create a unique layout.
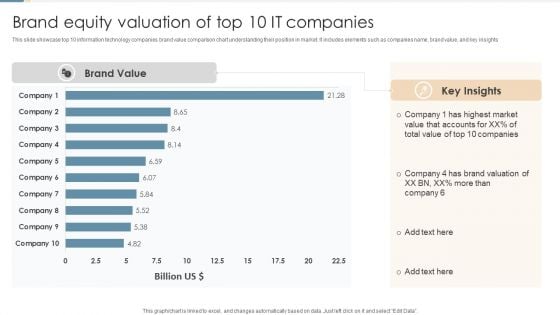
Brand Equity Valuation Of Top 10 IT Companies Ppt Portfolio Rules PDF
This slide showcase top 10 information technology companies brand value comparison chart understanding their position in market. It includes elements such as companies name, brand value, and key insights. Pitch your topic with ease and precision using this Brand Equity Valuation Of Top 10 IT Companies Ppt Portfolio Rules PDF. This layout presents information on Highest Market Value, Total Value, Brand Valuation. It is also available for immediate download and adjustment. So, changes can be made in the color, design, graphics or any other component to create a unique layout.
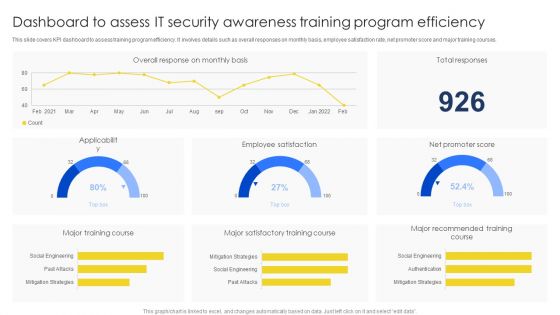
Dashboard To Assess IT Security Awareness Training Program Efficiency Brochure PDF
This slide covers KPI dashboard to assess training program efficiency. It involves details such as overall responses on monthly basis, employee satisfaction rate, net promoter score and major training courses. Pitch your topic with ease and precision using this Dashboard To Assess IT Security Awareness Training Program Efficiency Brochure PDF. This layout presents information on Major Training Course, Major Satisfactory, Training Course. It is also available for immediate download and adjustment. So, changes can be made in the color, design, graphics or any other component to create a unique layout.
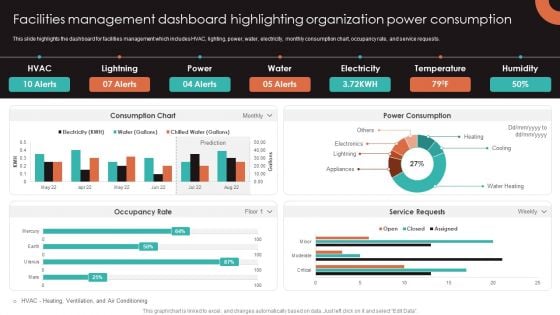
Facilities Management Dashboard Highlighting Organization Power Consumption Background PDF
This slide highlights the dashboard for facilities management which includes HVAC, lighting, power, water, electricity, monthly consumption chart, occupancy rate, and service requests. This Facilities Management Dashboard Highlighting Organization Power Consumption Background PDF from Slidegeeks makes it easy to present information on your topic with precision. It provides customization options, so you can make changes to the colors, design, graphics, or any other component to create a unique layout. It is also available for immediate download, so you can begin using it right away. Slidegeeks has done good research to ensure that you have everything you need to make your presentation stand out. Make a name out there for a brilliant performance.
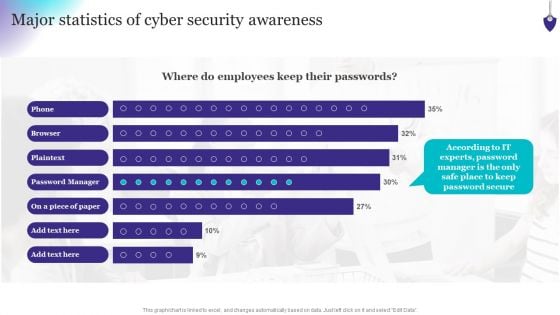
Organizing Security Awareness Major Statistics Of Cyber Security Awareness Formats PDF
This graph or chart is linked to excel, and changes automatically based on data. Just left click on it and select Edit Data. Welcome to our selection of the Organizing Security Awareness Major Statistics Of Cyber Security Awareness Formats PDF. These are designed to help you showcase your creativity and bring your sphere to life. Planning and Innovation are essential for any business that is just starting out. This collection contains the designs that you need for your everyday presentations. All of our PowerPoints are 100 percent editable, so you can customize them to suit your needs. This multi-purpose template can be used in various situations. Grab these presentation templates today.
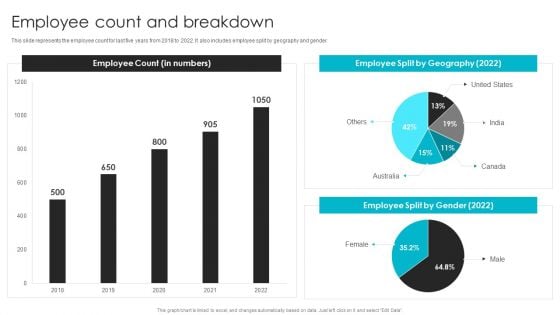
Web Design Company Overview Employee Count And Breakdown Topics PDF
This slide represents the employee count for last five years from 2018 to 2022. It also includes employee split by geography and gender. This Web Design Company Overview Employee Count And Breakdown Topics PDF from Slidegeeks makes it easy to present information on your topic with precision. It provides customization options, so you can make changes to the colors, design, graphics, or any other component to create a unique layout. It is also available for immediate download, so you can begin using it right away. Slidegeeks has done good research to ensure that you have everything you need to make your presentation stand out. Make a name out there for a brilliant performance.
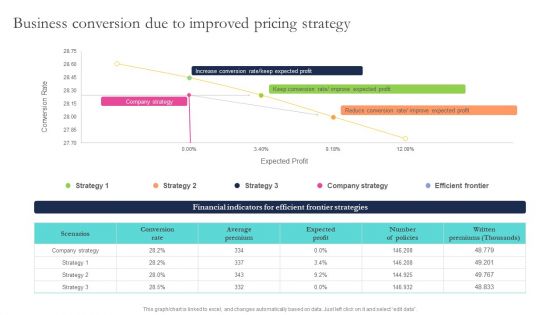
Optimizing Smart Pricing Tactics To Improve Sales Business Conversion Due To Improved Pricing Strategy Summary PDF
This Optimizing Smart Pricing Tactics To Improve Sales Business Conversion Due To Improved Pricing Strategy Summary PDF from Slidegeeks makes it easy to present information on your topic with precision. It provides customization options, so you can make changes to the colors, design, graphics, or any other component to create a unique layout. It is also available for immediate download, so you can begin using it right away. Slidegeeks has done good research to ensure that you have everything you need to make your presentation stand out. Make a name out there for a brilliant performance.
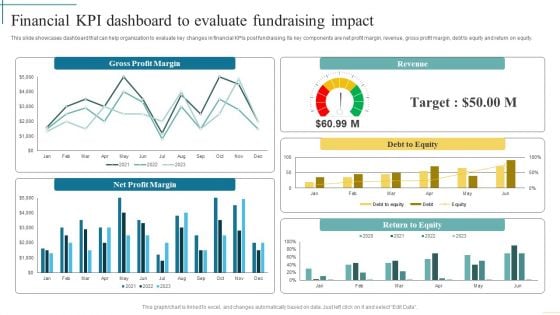
Financial Kpi Dashboard To Evaluate Fundraising Impact Developing Fundraising Techniques Diagrams PDF
This slide showcases dashboard that can help organization to evaluate key changes in financial KPIs post fundraising. Its key components are net profit margin, revenue, gross profit margin, debt to equity and return on equity. From laying roadmaps to briefing everything in detail, our templates are perfect for you. You can set the stage with your presentation slides. All you have to do is download these easy-to-edit and customizable templates. Financial Kpi Dashboard To Evaluate Fundraising Impact Developing Fundraising Techniques Diagrams PDF will help you deliver an outstanding performance that everyone would remember and praise you for. Do download this presentation today.
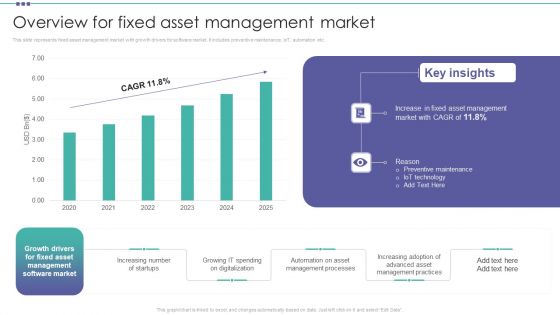
Overview For Fixed Asset Management Market Organization Physical Assets Portrait PDF
This slide represents fixed asset management market with growth drivers for software market. It includes preventive maintenance, IoT, automation etc.This Overview For Fixed Asset Management Market Organization Physical Assets Portrait PDF from Slidegeeks makes it easy to present information on your topic with precision. It provides customization options, so you can make changes to the colors, design, graphics, or any other component to create a unique layout. It is also available for immediate download, so you can begin using it right away. Slidegeeks has done good research to ensure that you have everything you need to make your presentation stand out. Make a name out there for a brilliant performance.
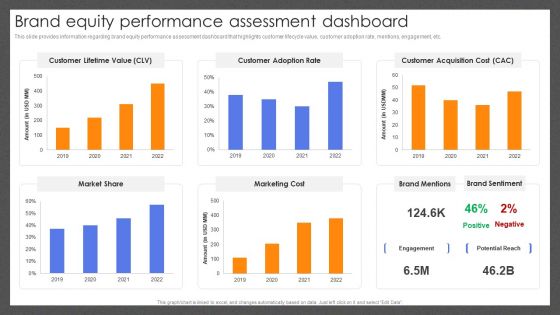
Guide For Effective Brand Brand Equity Performance Assessment Dashboard Diagrams PDF
This slide provides information regarding brand equity performance assessment dashboard that highlights customer lifecycle value, customer adoption rate, mentions, engagement, etc. Present like a pro with Guide For Effective Brand Brand Equity Performance Assessment Dashboard Diagrams PDF Create beautiful presentations together with your team, using our easy-to-use presentation slides. Share your ideas in real-time and make changes on the fly by downloading our templates. So whether youre in the office, on the go, or in a remote location, you can stay in sync with your team and present your ideas with confidence. With Slidegeeks presentation got a whole lot easier. Grab these presentations today.
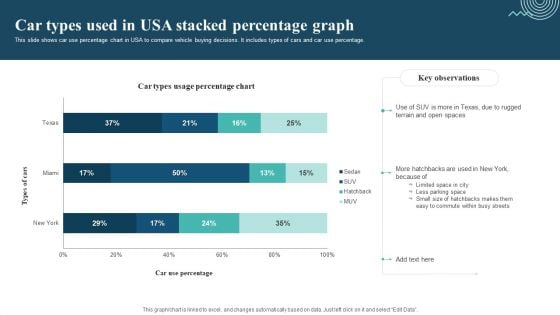
Car Types Used In Usa Stacked Percentage Graph Sample PDF
This slide shows car use percentage chart in USA to compare vehicle buying decisions. It includes types of cars and car use percentage. Pitch your topic with ease and precision using this Car Types Used In Usa Stacked Percentage Graph Sample PDF. This layout presents information on Limited Space In City, Less Parking Space, Easy To Commute. It is also available for immediate download and adjustment. So, changes can be made in the color, design, graphics or any other component to create a unique layout.
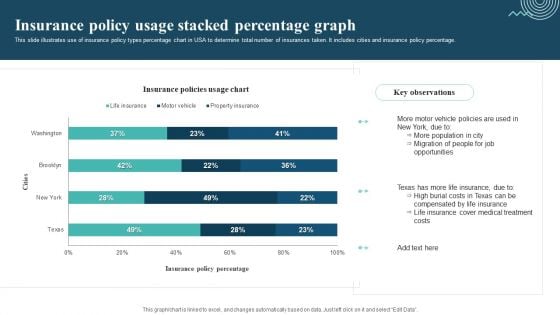
Insurance Policy Usage Stacked Percentage Graph Template PDF
This slide illustrates use of insurance policy types percentage chart in USA to determine total number of insurances taken. It includes cities and insurance policy percentage. Pitch your topic with ease and precision using this Insurance Policy Usage Stacked Percentage Graph Template PDF. This layout presents information on Motor Vehicle Policies, More Population, Migration Of People. It is also available for immediate download and adjustment. So, changes can be made in the color, design, graphics or any other component to create a unique layout.


 Continue with Email

 Home
Home


