Budget Chart
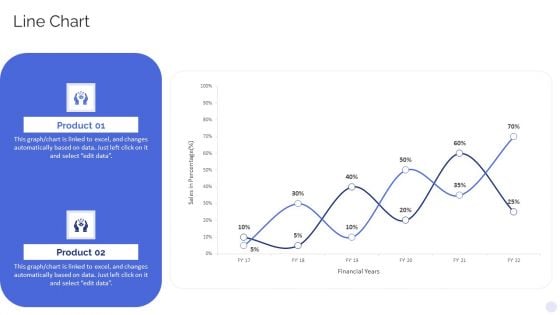
Banking Operations Model Revamp Plan Line Chart Background PDF
Deliver an awe inspiring pitch with this creative Banking Operations Model Revamp Plan Line Chart Background PDF bundle. Topics like Line Chart can be discussed with this completely editable template. It is available for immediate download depending on the needs and requirements of the user.
Combo Chart Investment Analysis Ppt PowerPoint Presentation Icon
This is a combo chart investment analysis ppt powerpoint presentation icon. The topics discussed in this diagram are finance, marketing, management, investment, analysis. This is a completely editable PowerPoint presentation, and is available for immediate download.
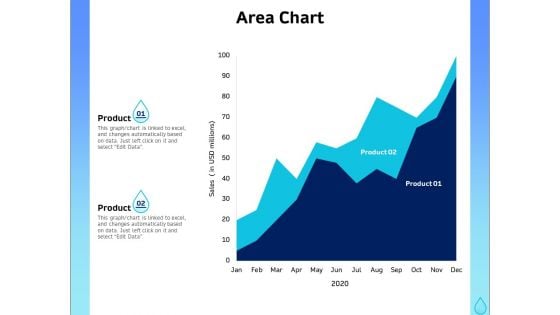
Integrated Water Resource Management Area Chart Ppt Portfolio Picture PDF
Presenting this set of slides with name integrated water resource management area chart ppt portfolio picture pdf. The topics discussed in these slide is area chart. This is a completely editable PowerPoint presentation and is available for immediate download. Download now and impress your audience.
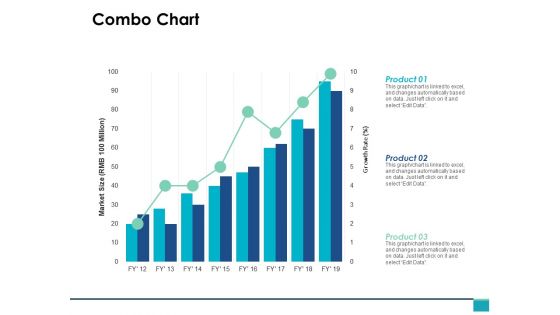
Combo Chart Management Investment Ppt PowerPoint Presentation Inspiration Maker
This is a combo chart management investment ppt powerpoint presentation inspiration maker. The topics discussed in this diagram are finance, marketing, management, investment, analysis. This is a completely editable PowerPoint presentation, and is available for immediate download.
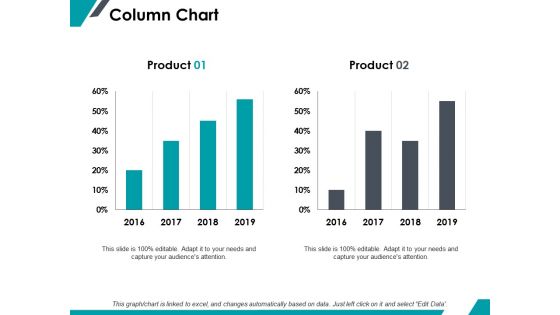
Column Chart Investment Ppt PowerPoint Presentation Pictures Inspiration
This is a column chart investment ppt powerpoint presentation pictures inspiration. The topics discussed in this diagram are finance, marketing, management, investment, analysis. This is a completely editable PowerPoint presentation, and is available for immediate download.
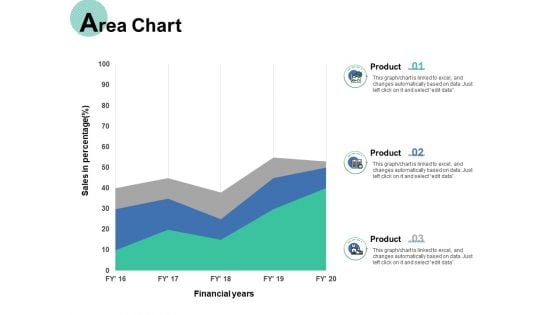
Area Chart Finance Ppt PowerPoint Presentation Show Graphics Tutorials
Presenting this set of slides with name combo chart investment ppt powerpoint presentation pictures grid. The topics discussed in these slide is combo chart. This is a completely editable PowerPoint presentation and is available for immediate download. Download now and impress your audience.

Radar Chart Template 1 Ppt PowerPoint Presentation Infographics Designs
This is a radar chart template 1 ppt powerpoint presentation infographics designs. This is a two stage process. The stages in this process are business, strategy, analysis, pretention, radar chart.
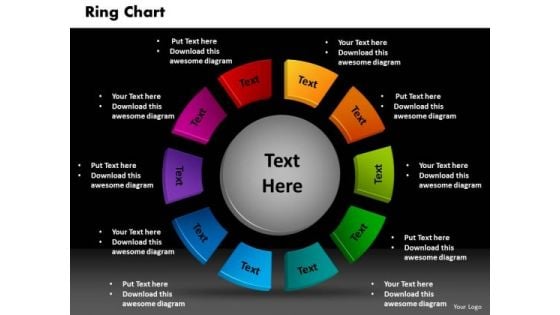
Business Cycle Process PowerPoint Templates Success Ring Chart Ppt Slides
Business Cycle Process PowerPoint Templates Success Ring Chart PPT Slides-This PowerPoint Template shows Success Ring Chart.You can easily edit the size, position, text and color.-Business Cycle Process PowerPoint Templates Success Ring Chart PPT Slides-This template can be used for presentations relating to 3d, Abstract, Advertising, Art, Branding, Business, Circles, Clipart, Company, Corporate, Design, Dimensional, Drawings, Element, Entwined, Graphics, Icon, Illustrations, Images, Internet, Marketing, Online, Pictures, Professional, Ready, Rings, Site, Team, Teamwork Advise teams with our Business Cycle Process PowerPoint Templates Success Ring Chart Ppt Slides. Download without worries with our money back guaranteee.
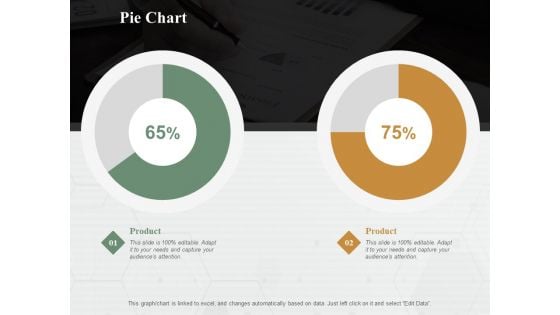
Pie Chart Finance Ppt PowerPoint Presentation Diagram Lists
This is a pie chart finance ppt powerpoint presentation diagram lists. This is a two stage process. The stages in this process are pie chart, finance, marketing, analysis, business.
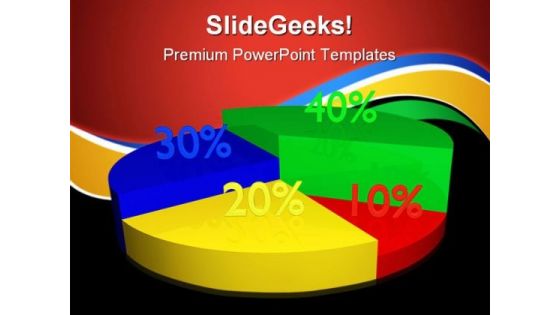
Percent Pie Chart Business PowerPoint Templates And PowerPoint Backgrounds 0711
Microsoft PowerPoint Template and Background with pie chart Economise on the time you have. Equip yourself with our Percent Pie Chart Business PowerPoint Templates And PowerPoint Backgrounds 0711.
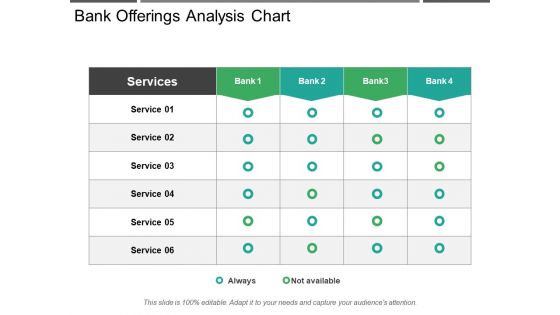
Bank Offerings Analysis Chart Ppt PowerPoint Presentation Slides Show
This is a bank offerings analysis chart ppt powerpoint presentation slides show. This is a five stage process. The stages in this process are comparison chart, comparison table, comparison matrix.
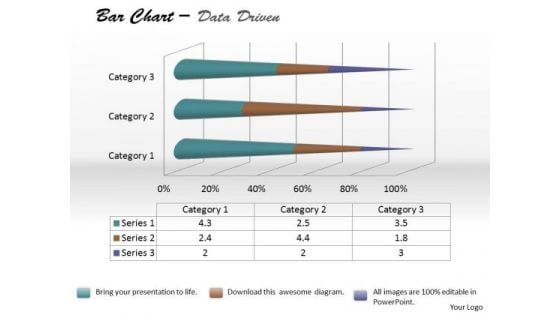
Data Analysis Bar Chart For Foreign Trade PowerPoint Templates
Be The Doer With Our data analysis bar chart for foreign trade Powerpoint Templates. Put Your Thoughts Into Practice.
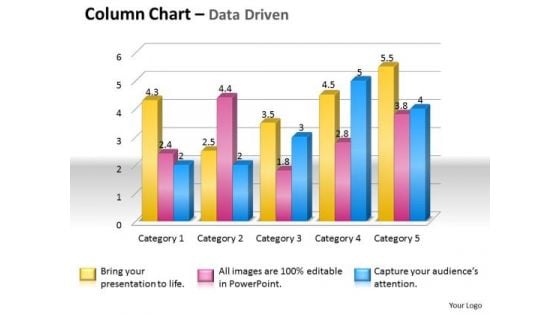
Data Analysis Techniques 3d Grouped Bar Chart PowerPoint Templates
Place The Orders With Your Thoughts. Our data analysis techniques 3d grouped bar chart Powerpoint Templates Know The Drill.
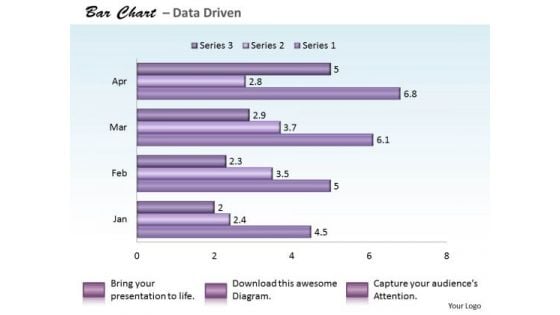
Quantitative Data Analysis Bar Chart For PowerPoint Templates
Reduce The Drag With Our quantitative data analysis bar chart for Powerpoint Templates . Give More Lift To Your Thoughts.
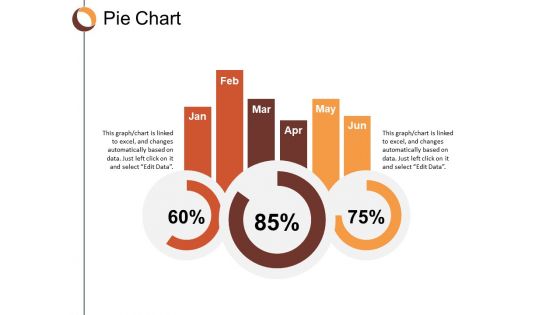
Pie Chart Finance Ppt Powerpoint Presentation Infographic Template Clipart
This is a pie chart finance ppt powerpoint presentation infographic template clipart. This is a three stage process. The stages in this process are pie chart, finance, marketing, business, analysis.
Area Chart Product Finance Ppt PowerPoint Presentation Icon Influencers
This is a area chart product finance ppt powerpoint presentation icon influencers. This is a two stage process. The stages in this process are area chart, finance, business, planning, marketing.
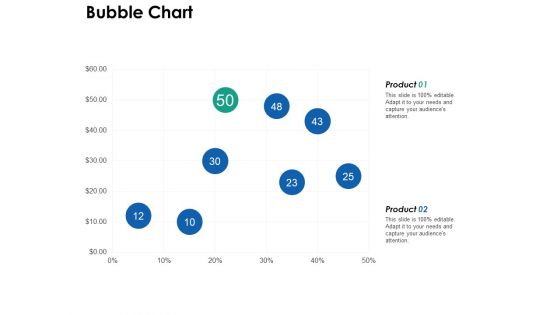
Bubble Chart Finance Ppt PowerPoint Presentation File Maker
This is a bubble chart finance ppt powerpoint presentation file maker. This is a two stage process. The stages in this process are bubble chart, finance, business, planning, marketing.
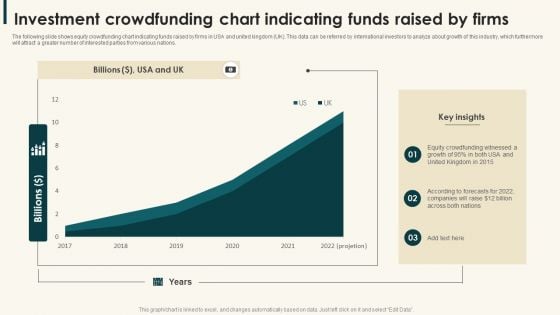
Investment Crowdfunding Chart Indicating Funds Raised By Firms Demonstration PDF
The following slide shows equity crowdfunding chart indicating funds raised by firms in USA and united kingdom UK. This data can be referred by international investors to analyze about growth of this industry, which furthermore will attract a greater number of interested parties from various nations.Showcasing this set of slides titled Investment Crowdfunding Chart Indicating Funds Raised By Firms Demonstration PDF. The topics addressed in these templates are Crowdfunding Witnessed, United Kingdom, Companies Raise. All the content presented in this PPT design is completely editable. Download it and make adjustments in color, background, font etc. as per your unique business setting.
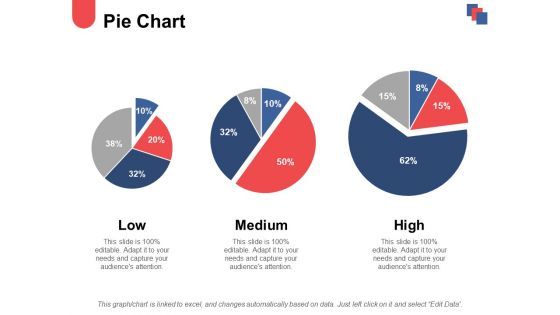
Pie Chart And Finance Ppt PowerPoint Presentation Ideas Demonstration
This is a pie chart and finance ppt powerpoint presentation ideas demonstration. This is a three stage process. The stages in this process are low, medium, high, pie chart, finance.
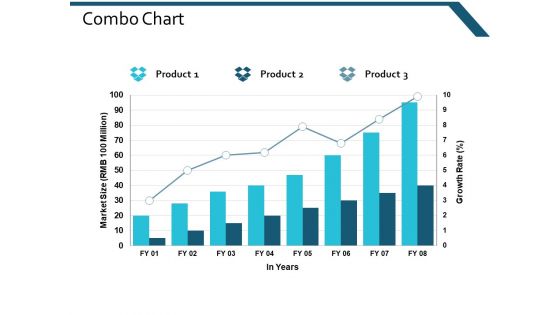
Combo Chart Finance Marketing Ppt Powerpoint Presentation Layouts Inspiration
This is a combo chart finance marketing ppt powerpoint presentation layouts inspiration. This is a three stage process. The stages in this process are combo chart, finance, marketing, management, analysis.

Area Chart Finance Ppt PowerPoint Presentation Infographics Layouts
This is a area chart finance ppt powerpoint presentation infographics layouts. This is a one stages process. The stages in this process are area chart, financial, marketing, planning, business.
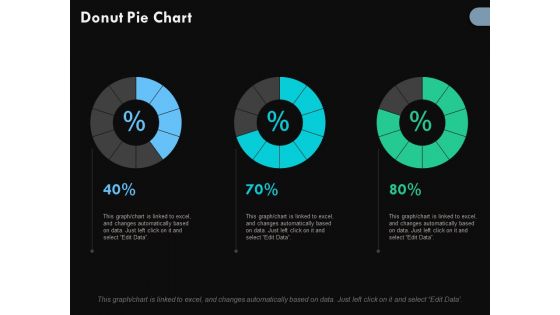
Donut Pie Chart Finance Ppt PowerPoint Presentation Outline Portrait
This is a donut pie chart finance ppt powerpoint presentation outline portrait. This is a three stage process. The stages in this process are donut pie chart, percentage, marketing, business, analysis.
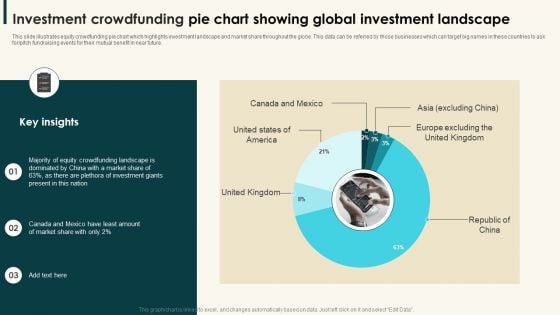
Investment Crowdfunding Pie Chart Showing Global Investment Landscape Structure PDF
This slide illustrates equity crowdfunding pie chart which highlights investment landscape and market share throughout the globe. This data can be referred by those businesses which can target big names in these countries to ask foror pitch fundraising events for their mutual benefit in near future.Showcasing this set of slides titled Investment Crowdfunding Pie Chart Showing Global Investment Landscape Structure PDF. The topics addressed in these templates are Europe Excluding, Equity Crowdfunding, Investment Giants. All the content presented in this PPT design is completely editable. Download it and make adjustments in color, background, font etc. as per your unique business setting.
Area Chart Marketing Planning Ppt PowerPoint Presentation Icon Sample
This is a area chart marketing planning ppt powerpoint presentation icon sample. This is a two stage process. The stages in this process are area chart, finance, marketing, analysis, investment.
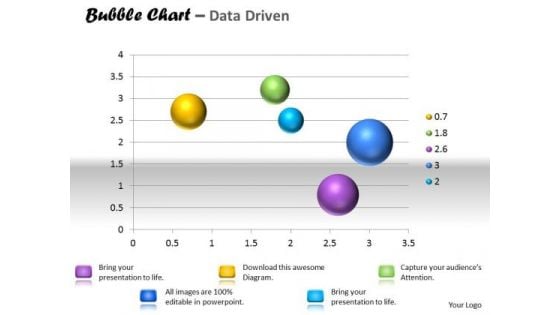
Data Analysis Template Interactive Bubble Chart PowerPoint Templates
Our data analysis template interactive bubble chart Powerpoint Templates Are A Wonder Drug. They Help Cure Almost Any Malaise.
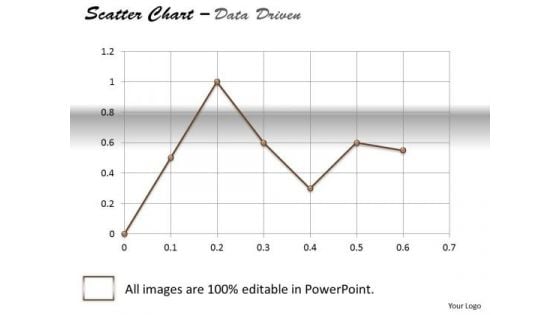
Data Analysis Excel Business Tool Scatter Chart PowerPoint Templates
Dominate Proceedings With Your Ideas. Our data analysis excel business tool scatter chart Powerpoint Templates Will Empower Your Thoughts.

Data Analysis Excel Categorical Statistics Doughnut Chart PowerPoint Templates
Establish Your Dominion With Our data analysis excel categorical statistics doughnut chart Powerpoint Templates. Rule The Stage With Your Thoughts.
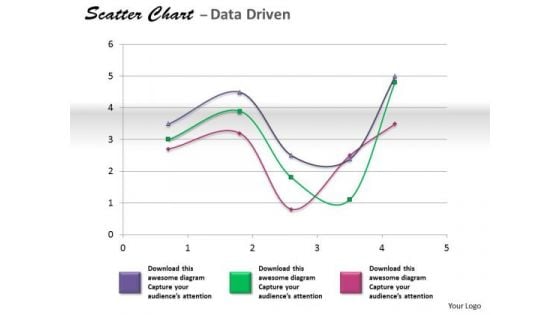
Financial Data Analysis Coordinate With Scatter Chart PowerPoint Templates
Get The Doers Into Action. Activate Them With Our financial data analysis coordinate with scatter chart Powerpoint Templates .
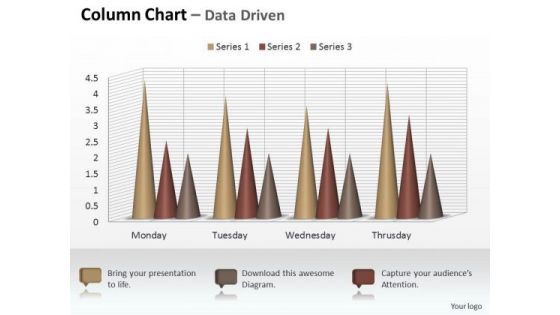
Marketing Data Analysis 3d Sets Of Column Chart PowerPoint Templates
Your Listeners Will Never Doodle. Our marketing data analysis 3d sets of column chart Powerpoint Templates Will Hold Their Concentration.
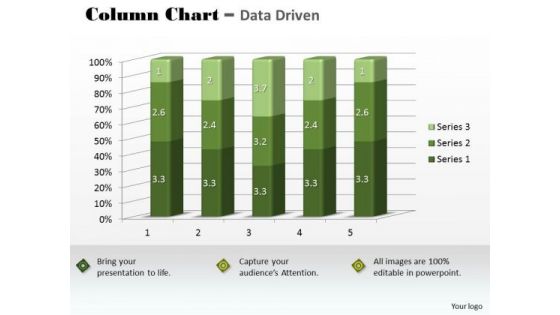
Marketing Data Analysis 3d Statistical Quality Control Chart PowerPoint Templates
Our marketing data analysis 3d statistical quality control chart Powerpoint Templates Abhor Doodling. They Never Let The Interest Flag.
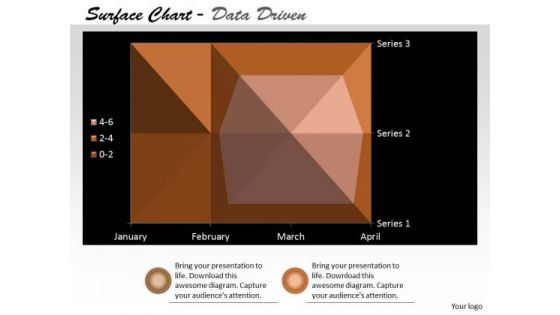
Multivariate Data Analysis Surface Chart Plots Trends PowerPoint Templates
Our multivariate data analysis surface chart plots trends Powerpoint Templates Heighten Concentration. Your Audience Will Be On The Edge.

Data Analysis Techniques 3d Effective Display Chart PowerPoint Templates
Dribble Away With Our data analysis techniques 3d effective display chart Powerpoint Templates . Score A Goal With Your Ideas.
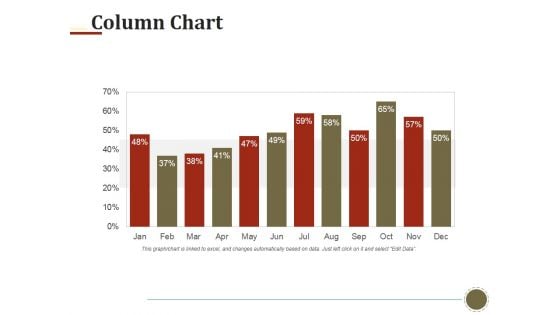
Column Chart Ppt PowerPoint Presentation Infographic Template Graphics Tutorials
This is a column chart ppt powerpoint presentation infographic template graphics tutorials. This is a twelve stage process. The stages in this process are column chart, finance, marketing, strategy, investment, business.
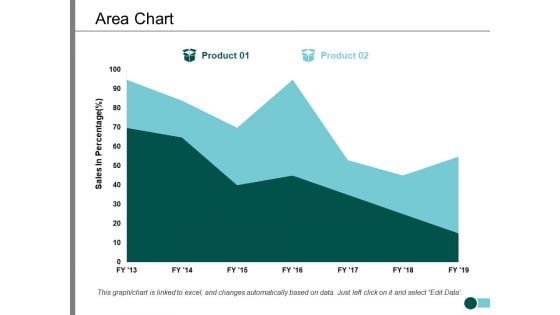
Area Chart Percentage Product Ppt PowerPoint Presentation Infographic Template Slide
This is a area chart percentage product ppt powerpoint presentation infographic template slide. This is a two stage process. The stages in this process are area chart, finance, marketing, management, investment.
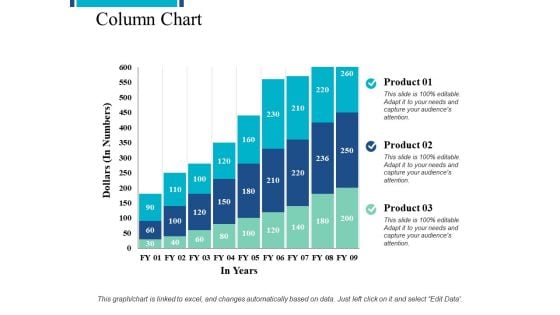
Column Chart Investment Ppt PowerPoint Presentation Show Diagrams
This is a column chart investment ppt powerpoint presentation show diagrams. This is a three stage process. The stages in this process are finance, analysis, business, investment, marketing.
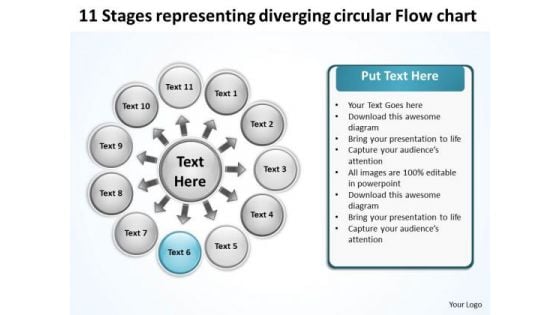
11 Stages Representing Diverging Circular Flow Chart Target PowerPoint Slides
We present our 11 stages representing diverging circular flow chart Target PowerPoint Slides.Download and present our Process and flows PowerPoint Templates because you have a handle on all the targets, a master of the game, the experienced and consummate juggler. Download and present our Flow charts PowerPoint Templates because you can outline your targets to your team. Present our Circle Charts PowerPoint Templates because you can Signpost your preferred roadmap to your eager co- travellers and demonstrate clearly how you intend to navigate them towards the desired corporate goal. Download and present our Ring Charts PowerPoint Templates because you have a good idea of the roadmap to your desired destination. Download and present our Business PowerPoint Templates because the great Bald headed Eagle embodies your personality. the eagle eye to seize upon the smallest of opportunities.Use these PowerPoint slides for presentations relating to Arrows, business, central, centralized, chart, circle, circular, circulation, concept, conceptual, converging, design, diagram, executive, icon, idea, illustration, management, mapping, model, numbers, organization, outwards, pointing, procedure, process, radial, radiating, relationship, resource, sequence, sequential, square. The prominent colors used in the PowerPoint template are Blue, White, Black. You can be sure our 11 stages representing diverging circular flow chart Target PowerPoint Slides are Playful. Presenters tell us our centralized PowerPoint templates and PPT Slides will make the presenter look like a pro even if they are not computer savvy. We assure you our 11 stages representing diverging circular flow chart Target PowerPoint Slides will generate and maintain the level of interest you desire. They will create the impression you want to imprint on your audience. Customers tell us our circulation PowerPoint templates and PPT Slides are Sparkling. Presenters tell us our 11 stages representing diverging circular flow chart Target PowerPoint Slides are Adorable. You can be sure our centralized PowerPoint templates and PPT Slides are Bright. Arouse the excitement with our 11 Stages Representing Diverging Circular Flow Chart Target PowerPoint Slides. Stir up the audience with your views.
Column Chart Analysis Ppt PowerPoint Presentation Icon Structure
This is a column chart analysis ppt powerpoint presentation icon structure. This is a three stage process. The stages in this process are column chart, finance, marketing, management, investment.
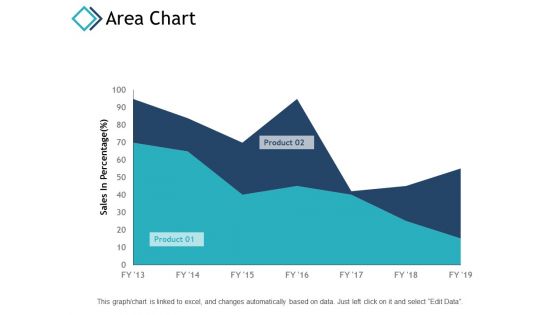
Area Chart Marketing Planning Ppt PowerPoint Presentation Ideas Maker
This is a area chart marketing planning ppt powerpoint presentation ideas maker. This is a two stage process. The stages in this process are area chart, finance, marketing, analysis, investment.
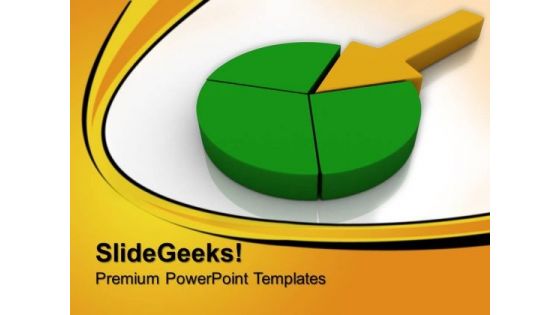
Arrow Pie Chart Marketing PowerPoint Templates And PowerPoint Themes 0712
Arrow Pie Chart Marketing PowerPoint Templates And PowerPoint Themes 0712-Microsoft Powerpoint Templates and Background with pie chart Our Arrow Pie Chart Marketing PowerPoint Templates And PowerPoint Themes 0712 get the audience to accept your credentials. They will acknowledge your professional acumen.
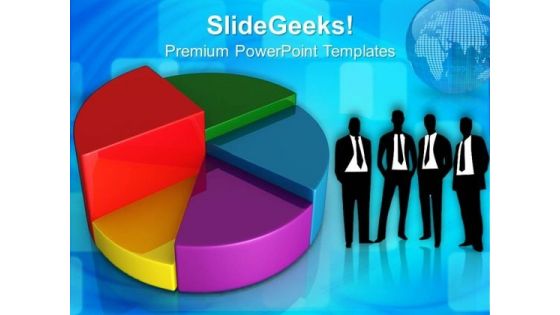
Pie Chart Marketing Business PowerPoint Templates And PowerPoint Themes 0712
Pie Chart Marketing Business PowerPoint Templates And PowerPoint Themes 0712-Microsoft Powerpoint Templates and Background with pie chart marketing Our Pie Chart Marketing Business PowerPoint Templates And PowerPoint Themes 0712 are designed by an avant-garde team. They are always abreast of the state of the art.

Area Chart Product Percentage Ppt PowerPoint Presentation Infographic Template Slide
This is a area chart product percentage ppt powerpoint presentation infographic template slide. This is a four stage process. The stages in this process are area chart, finance, marketing, management, investment.
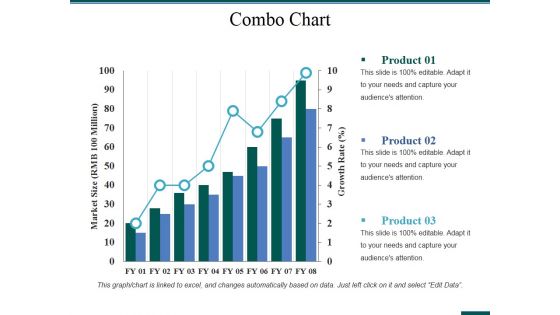
Combo Chart Ppt PowerPoint Presentation Slides Background Image
This is a combo chart ppt powerpoint presentation slides background image. This is a three stage process. The stages in this process are business, finance, planning, combo chart, investment.
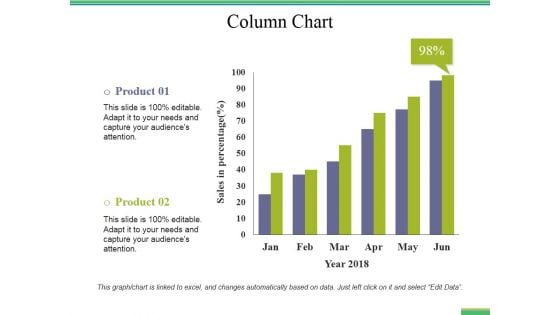
Column Chart Ppt PowerPoint Presentation Pictures Visual Aids
This is a column chart ppt powerpoint presentation pictures visual aids. This is a two stage process. The stages in this process are column chart, business, finance, marketing, analysis, investment.
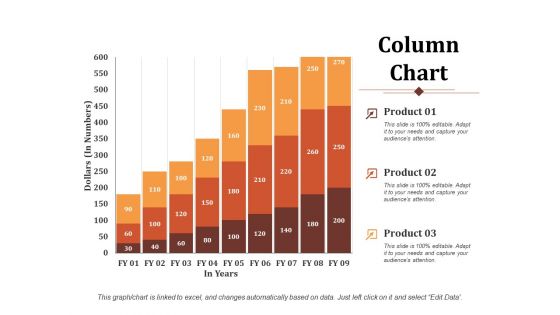
Column Chart Business Analysis Ppt PowerPoint Presentation Outline Example Introduction
This is a column chart business analysis ppt powerpoint presentation outline example introduction. This is a three stage process. The stages in this process are column chart, finance, marketing, management, investment.

Area Chart Percentage Ppt PowerPoint Presentation Portfolio Pictures
This is a area chart percentage ppt powerpoint presentation portfolio pictures. This is a three stage process. The stages in this process are area chart, finance, marketing, management, investment.
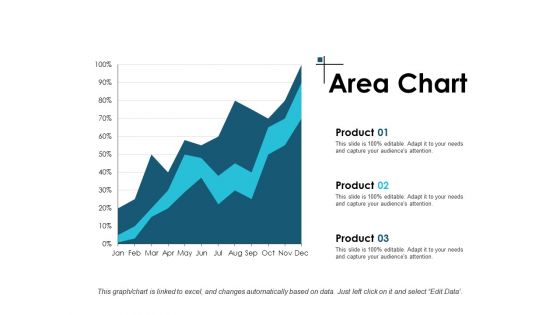
Area Chart Investment Ppt PowerPoint Presentation Infographics Summary
This is a area chart investment ppt powerpoint presentation infographics summary. This is a three stage process. The stages in this process are finance, marketing, management, investment, analysis.
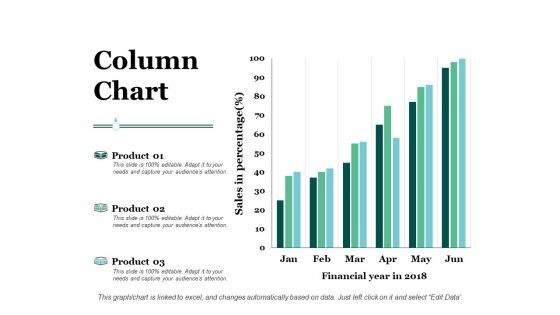
Column Chart Investment Ppt PowerPoint Presentation Professional Pictures
This is a column chart investment ppt powerpoint presentation professional pictures. This is a three stage process. The stages in this process are finance, analysis, business, investment, marketing.

Bar Chart Money PowerPoint Templates And PowerPoint Themes 0512
Microsoft Powerpoint Templates and Background with bar chart growth-These templates can be used for presentations relating to-Bar chart growth, shapes, business, finance, success, marketing-Bar Chart Money PowerPoint Templates And PowerPoint Themes 0512 Be a ninja with our Bar Chart Money PowerPoint Templates And PowerPoint Themes 0512. You will come out on top.
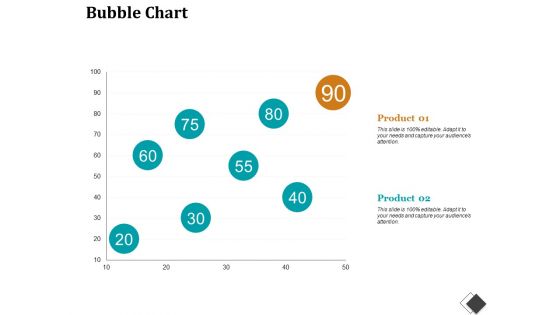
Bubble Chart Enterprise Model Canvas Ppt PowerPoint Presentation File Structure
This is a bubble chart enterprise model canvas ppt powerpoint presentation file structure. This is a two stage process. The stages in this process are bubble chart, finance, marketing, strategy, analysis, investment.
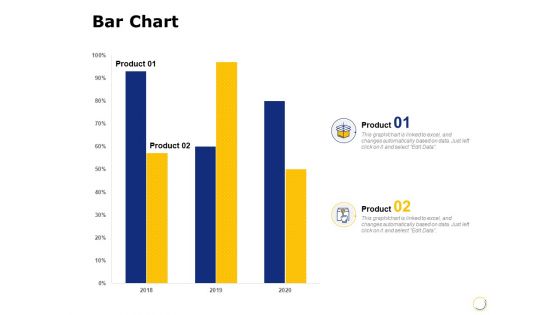
Bar Chart Finance Ppt PowerPoint Presentation Model Files
Presenting this set of slides with name bar chart finance ppt powerpoint presentation model files. The topics discussed in these slide is bar chart. This is a completely editable PowerPoint presentation and is available for immediate download. Download now and impress your audience.
Scrum Kpis With Sprint Burndown Chart Ppt Icon Elements PDF
This slide illustrates scrum key performance indicators for individual sprints. It includes tasks, story points, bugs, burndown charts, statistics etc. Pitch your topic with ease and precision using this Scrum Kpis With Sprint Burndown Chart Ppt Icon Elements PDF. This layout presents information on Burndown Chart, Story Points, Cost, Bugs. It is also available for immediate download and adjustment. So, changes can be made in the color, design, graphics or any other component to create a unique layout.
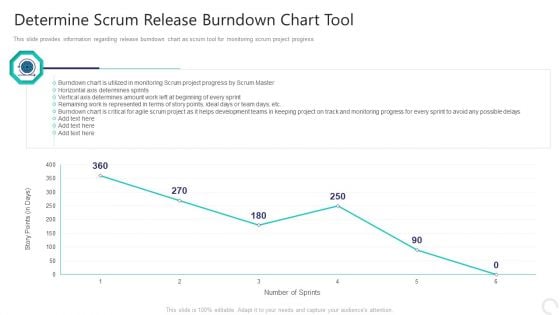
Determine Scrum Release Burndown Chart Tool Diagrams PDF
This slide provides information regarding release burndown chart as scrum tool for monitoring scrum project progress. Deliver and pitch your topic in the best possible manner with this determine scrum release burndown chart tool diagrams pdf. Use them to share invaluable insights on determine scrum release burndown chart tool and impress your audience. This template can be altered and modified as per your expectations. So, grab it now.
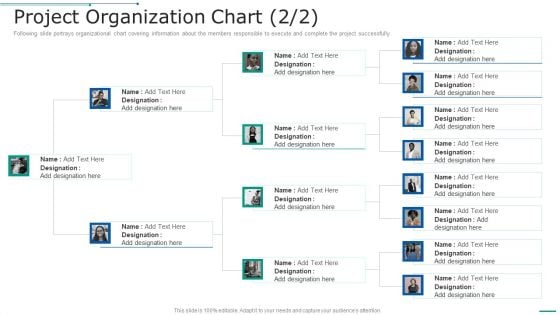
PMP Toolkit Project Organization Chart Project Ppt Pictures Tips PDF
This slide illustrates organizational chart covering information about the members responsible to execute and complete the project successfully. Presenting pmp toolkit project organization chart project ppt pictures tips pdf to provide visual cues and insights. Share and navigate important information on two stages that need your due attention. This template can be used to pitch topics like project organization chart. In addtion, this PPT design contains high resolution images, graphics, etc, that are easily editable and available for immediate download.
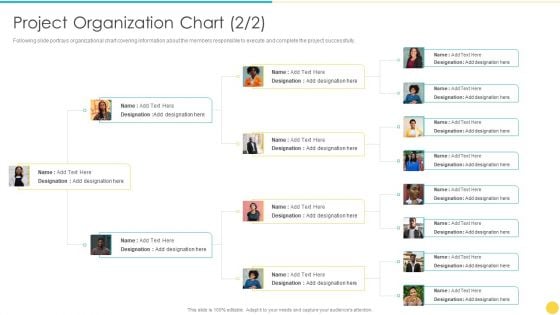
Project Management Professional Toolset IT Project Organization Chart Clipart PDF
This slide illustrates organizational chart covering information about the members responsible to execute and complete the project successfully. This is a project management professional toolset it project organization chart clipart pdf template with various stages. Focus and dispense information on two stages using this creative set, that comes with editable features. It contains large content boxes to add your information on topics like project organization chart. You can also showcase facts, figures, and other relevant content using this PPT layout. Grab it now.
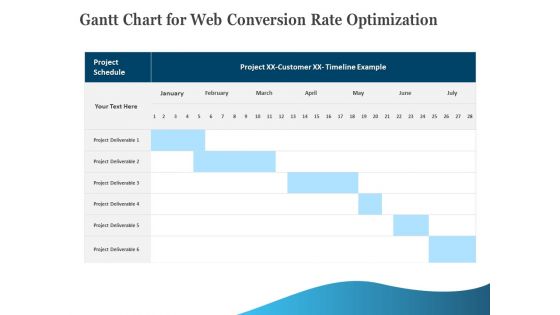
Gantt Chart For Web Conversion Rate Optimization Download PDF
Your complex projects can be managed and organized simultaneously using this detailed gantt chart for web conversion rate optimization download pdf template. Track the milestones, tasks, phases, activities, and subtasks to get an updated visual of your project. Share your planning horizon and release plan with this well-crafted presentation template. This exemplary template can be used to plot various dependencies to distinguish the tasks in the pipeline and their impact on the schedules and deadlines of the project. Apart from this, you can also share this visual presentation with your team members and stakeholders. It a resourceful tool that can be incorporated into your business structure. Therefore, download and edit it conveniently to add the data and statistics as per your requirement.
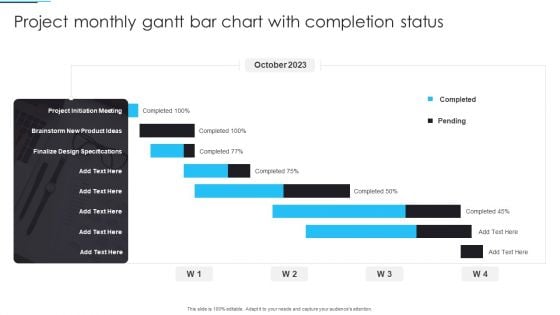
Project Monthly Gantt Bar Chart With Completion Status Infographics PDF
Pitch your topic with ease and precision using this Project Monthly Gantt Bar Chart With Completion Status Infographics PDF. This layout presents information on Project, Monthly Gantt Bar Chart. It is also available for immediate download and adjustment. So, changes can be made in the color, design, graphics or any other component to create a unique layout.
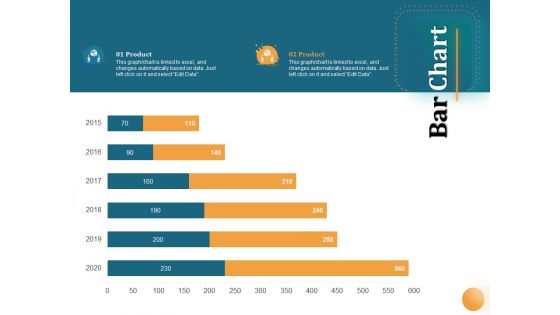
Project Portfolio Management PPM Bar Chart Ppt Gallery Sample PDF
Presenting this set of slides with name project portfolio management ppm bar chart ppt gallery sample pdf. The topics discussed in these slide is bar chart. This is a completely editable PowerPoint presentation and is available for immediate download. Download now and impress your audience.
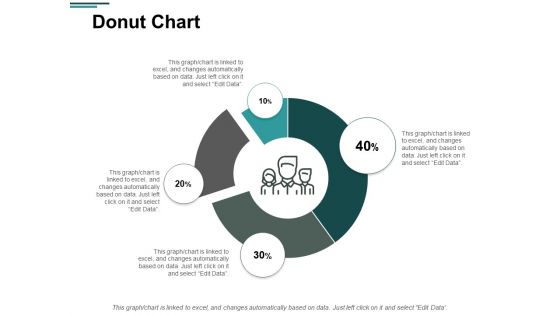
Donut Chart Finance Management Ppt PowerPoint Presentation Layouts Design Templates
Presenting this set of slides with name donut chart finance management ppt powerpoint presentation layouts design templates. The topics discussed in these slides are donut chart, finance, marketing, management, analysis. This is a completely editable PowerPoint presentation and is available for immediate download. Download now and impress your audience.
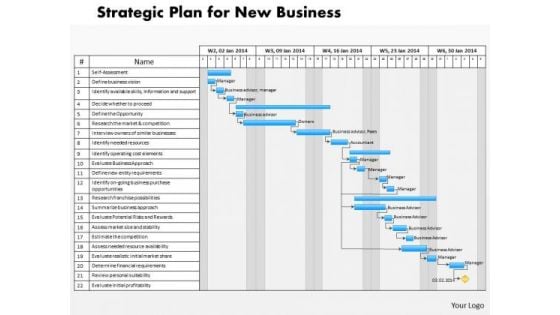
Business Diagram Project Management Chart PowerPoint Ppt Presentation
Deliver The Right Dose With Our Business Diagram project management chart PowerPoint PPT Presentation Powerpoint Templates. Your Ideas Will Get The Correct Illumination.

Business Diagram Project Management Flow Chart PowerPoint Ppt Presentation
Knock On The Door To Success With Our Business Diagram project management flow chart PowerPoint PPT Presentation Powerpoint Templates. Be Assured Of Gaining Entry.


 Continue with Email

 Home
Home


