Budget Chart
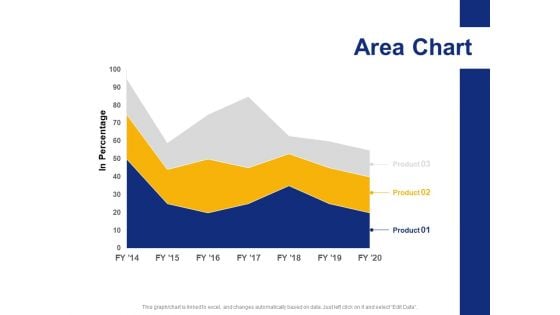
Area Chart Finance Ppt PowerPoint Presentation Infographic Template Graphics Download
Presenting this set of slides with name area chart finance ppt powerpoint presentation infographic template graphics download. The topics discussed in these slide is area chart. This is a completely editable PowerPoint presentation and is available for immediate download. Download now and impress your audience.
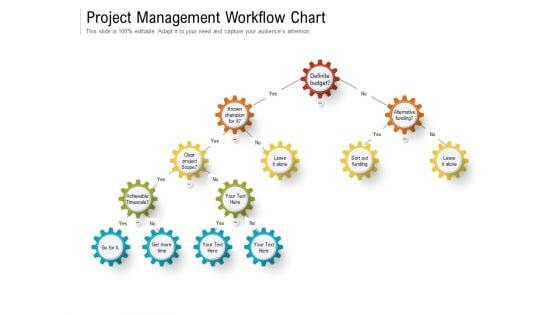
Project Management Workflow Chart Ppt PowerPoint Presentation File Influencers PDF
Persuade your audience using this project management workflow chart ppt powerpoint presentation file influencers pdf. This PPT design covers four stages, thus making it a great tool to use. It also caters to a variety of topics including budget, alternative, champion. Download this PPT design now to present a convincing pitch that not only emphasizes the topic but also showcases your presentation skills.
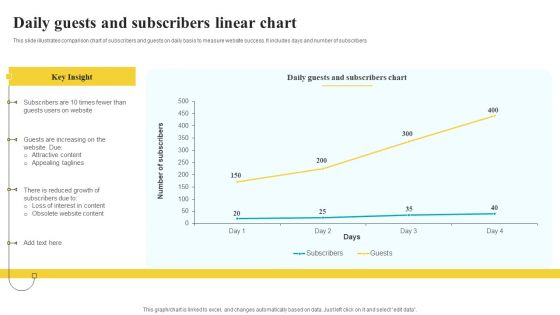
Daily Guests And Subscribers Linear Chart Clipart PDF
This slide illustrates comparison chart of subscribers and guests on daily basis to measure website success. It includes days and number of subscribers Pitch your topic with ease and precision using this Daily Guests And Subscribers Linear Chart Clipart PDF. This layout presents information on Key Insight, Website, Subscribers Chart. It is also available for immediate download and adjustment. So, changes can be made in the color, design, graphics or any other component to create a unique layout.
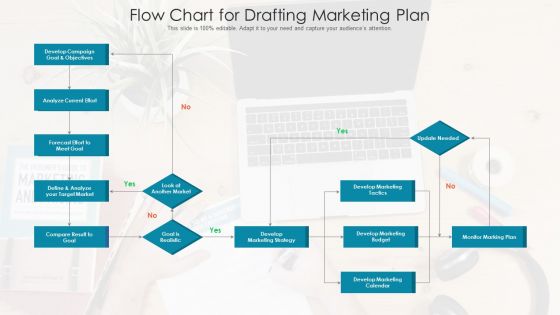
Marketing Planning Process Flow Chart Ppt Model Templates PDF
Presenting marketing planning process flow chart ppt model templates pdf to dispense important information. This template comprises one stage. It also presents valuable insights into the topics including develop marketing tactics, monitor marking plan, develop marketing budget, develop marketing strategy. This is a completely customizable PowerPoint theme that can be put to use immediately. So, download it and address the topic impactfully.
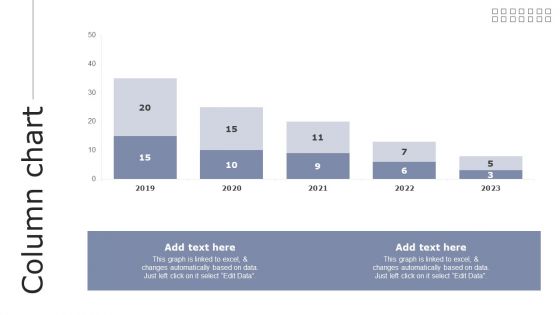
Column Chart Guide To Asset Cost Estimation Inspiration PDF
Do you have to make sure that everyone on your team knows about any specific topic I yes, then you should give Column Chart Guide To Asset Cost Estimation Inspiration PDF a try. Our experts have put a lot of knowledge and effort into creating this impeccable Column Chart Guide To Asset Cost Estimation Inspiration PDF. You can use this template for your upcoming presentations, as the slides are perfect to represent even the tiniest detail. You can download these templates from the Slidegeeks website and these are easy to edit. So grab these today.
EVM Project Management Chart Vector Icon Introduction PDF
Showcasing this set of slides titled evm project management chart vector icon introduction pdf. The topics addressed in these templates are evm project management chart vector icon. All the content presented in this PPT design is completely editable. Download it and make adjustments in color, background, font etc. as per your unique business setting.
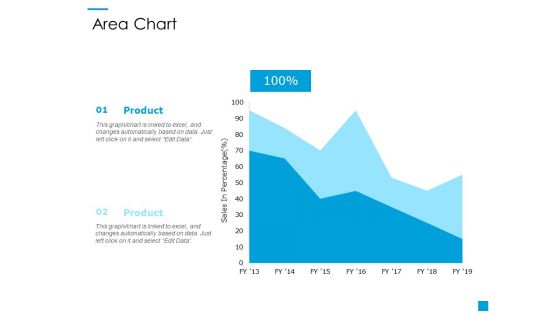
Area Chart Finance Ppt PowerPoint Presentation Model Shapes
Presenting this set of slides with name area chart finance ppt powerpoint presentation model shapes. The topics discussed in these slide is area chart. This is a completely editable PowerPoint presentation and is available for immediate download. Download now and impress your audience.
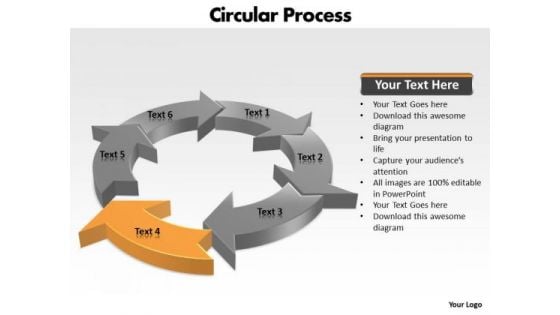
Ppt Components Of Circular PowerPoint Menu Template Process Chart Templates
PPT components of circular powerpoint menu template process chart Templates-This circular flow diagram can helps to illustrate the economic exchange that takes place in the building of wealth. Clarity of thought has been the key to your growth. Use our template to illustrate your ability.-PPT components of circular powerpoint menu template process chart Templates-Arrow, Chart, Circular, Color, Colorful, Connect, Connection, Design, Diagram, Finance, Graphic, Group, Growth, Icon, Illustration, Marketing, Pieces, Process, Recycle, Recycling, Round, Set, Strategy, Symbol, Wheel Consult experts with our Ppt Components Of Circular PowerPoint Menu Template Process Chart Templates. Download without worries with our money back guaranteee.
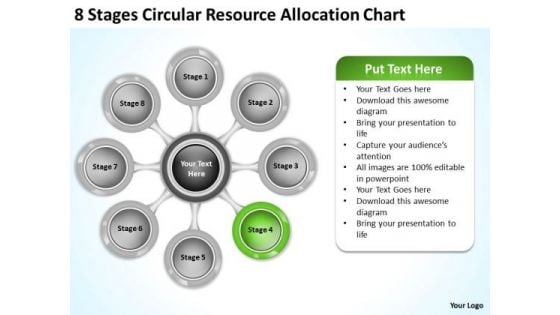
Business Planning Strategy Resource Allocation Chart Level Definition
We present our business planning strategy resource allocation chart level definition.Download and present our Process and Flows PowerPoint Templates because Our PowerPoint Templates and Slides will let you Leave a lasting impression to your audiences. They possess an inherent longstanding recall factor. Use our Circle Charts PowerPoint Templates because Our PowerPoint Templates and Slides are endowed to endure. Ideas conveyed through them will pass the test of time. Download our Ring Charts PowerPoint Templates because Our PowerPoint Templates and Slides has conjured up a web of all you need with the help of our great team. Use them to string together your glistening ideas. Download our Flow Charts PowerPoint Templates because Our PowerPoint Templates and Slides will let your words and thoughts hit bullseye everytime. Use our Marketing PowerPoint Templates because Our PowerPoint Templates and Slides are aesthetically designed to attract attention. We gaurantee that they will grab all the eyeballs you need.Use these PowerPoint slides for presentations relating to Abstract, arrows, business, central, centralized, chart, circle, circular,circulation, concept, conceptual, converging, design, diagram, eight, executive,icon, idea, illustration, management, map, mapping, mba, model, numbers,organization, outwards, pointing, procedure, process, radial, radiating,relationship, resource, sequence, sequential, square, strategy. The prominent colors used in the PowerPoint template are Green lime, Gray, White. Stop your audience's blank gaze. Get them interestedwith our Business Planning Strategy Resource Allocation Chart Level Definition. You'll deliver your best presentation yet.
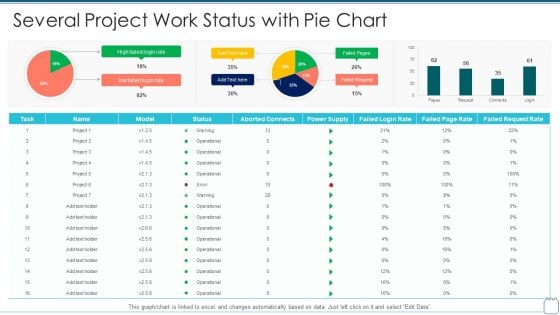
Several Project Work Status With Pie Chart Microsoft PDF
Pitch your topic with ease and precision using this several project work status with pie chart microsoft pdf . This layout presents information on several project work status with pie chart . It is also available for immediate download and adjustment. So, changes can be made in the color, design, graphics or any other component to create a unique layout.
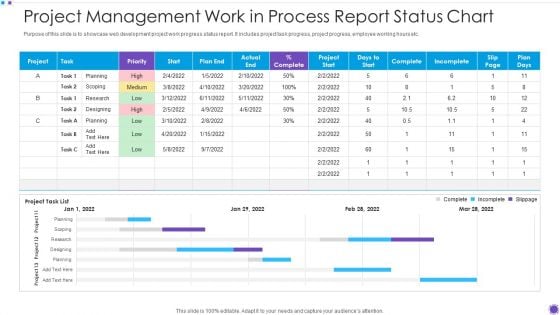
Project Management Work In Process Report Status Chart Microsoft PDF
Pitch your topic with ease and precision using this project management work in process report status chart microsoft pdf. This layout presents information on project management work in process report status chart. It is also available for immediate download and adjustment. So, changes can be made in the color, design, graphics or any other component to create a unique layout.
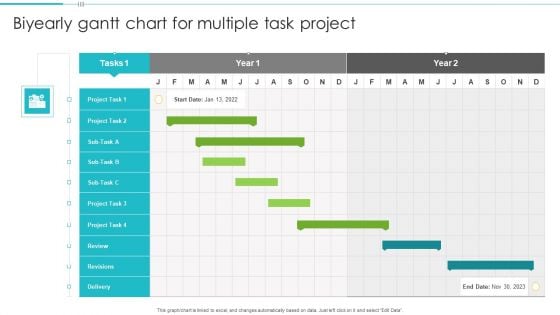
Biyearly Gantt Chart For Multiple Task Project Structure PDF
Pitch your topic with ease and precision using this Biyearly Gantt Chart For Multiple Task Project Structure PDF. This layout presents information on Biyearly Gantt Chart, Multiple Task Project. It is also available for immediate download and adjustment. So, changes can be made in the color, design, graphics or any other component to create a unique layout.
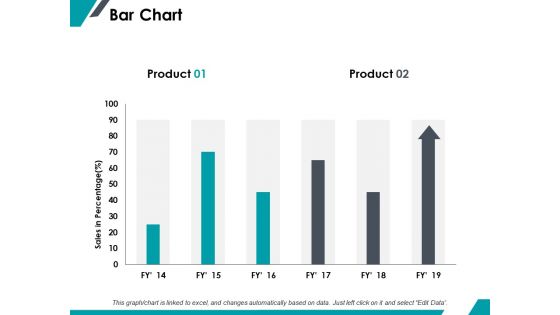
Bar Chart Finance Marketing Ppt PowerPoint Presentation Diagram Images
This is a bar chart finance marketing ppt powerpoint presentation diagram images. The topics discussed in this diagram are finance, marketing, management, investment, analysis. This is a completely editable PowerPoint presentation, and is available for immediate download.
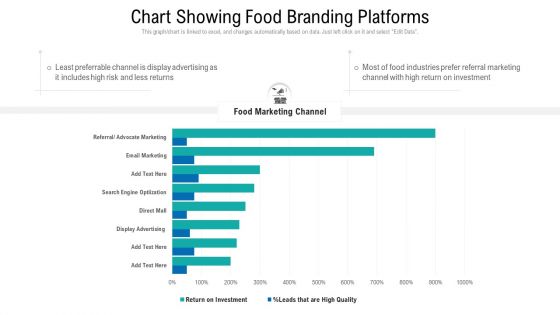
Chart Showing Food Branding Platforms Ppt Summary Gridlines PDF
This graph or chart is linked to excel, and changes automatically based on data. Just left click on it and select Edit Data. Showcasing this set of slides titled chart showing food branding platforms ppt summary gridlines pdf. The topics addressed in these templates are chart showing food branding platforms. All the content presented in this PPT design is completely editable. Download it and make adjustments in color, background, font etc. as per your unique business setting.
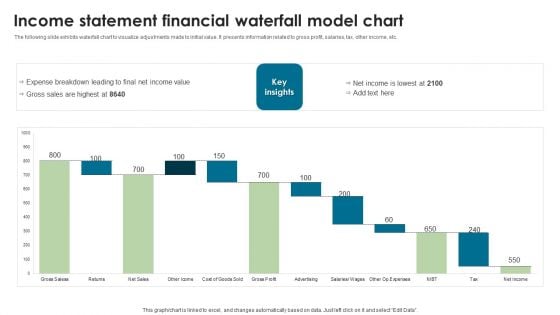
Income Statement Financial Waterfall Model Chart Elements PDF
The following slide exhibits waterfall chart to visualize adjustments made to initial value. It presents information related to gross profit, salaries, tax, other income, etc. Showcasing this set of slides titled Income Statement Financial Waterfall Model Chart Elements PDF. The topics addressed in these templates are Income, Statement Financial, Model Chart. All the content presented in this PPT design is completely editable. Download it and make adjustments in color, background, font etc. as per your unique business setting.
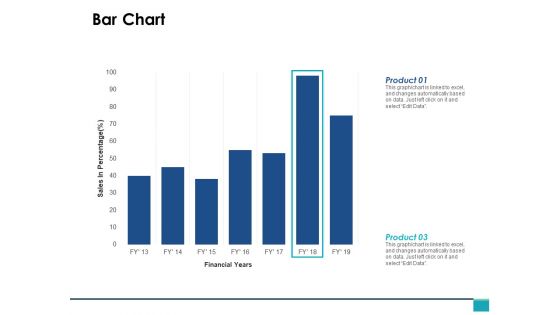
Bar Chart Finance Marketing Ppt PowerPoint Presentation Portfolio Pictures
This is a bar chart finance marketing ppt powerpoint presentation portfolio pictures. The topics discussed in this diagram are finance, marketing, management, investment, analysis. This is a completely editable PowerPoint presentation, and is available for immediate download.
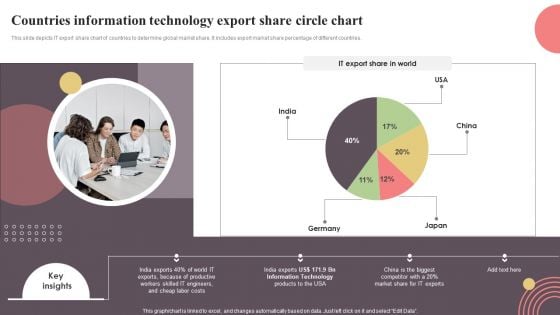
Countries Information Technology Export Share Circle Chart Inspiration PDF
This slide depicts IT export share chart of countries to determine global market share. It includes export market share percentage of different countries. Pitch your topic with ease and precision using this Countries Information Technology Export Share Circle Chart Inspiration PDF. This layout presents information on Countries Information Technology, Export Share Circle Chart. It is also available for immediate download and adjustment. So, changes can be made in the color, design, graphics or any other component to create a unique layout.
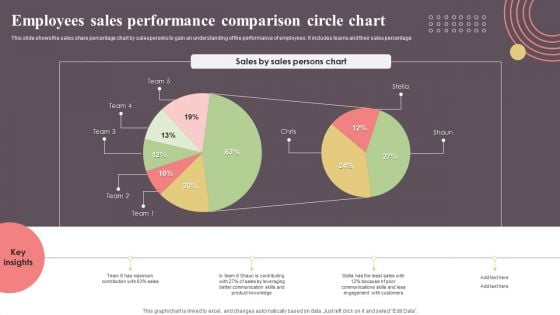
Employees Sales Performance Comparison Circle Chart Topics PDF
This slide shows the sales share percentage chart by salespersons to gain an understanding of the performance of employees. It includes teams and their sales percentage. Pitch your topic with ease and precision using this Employees Sales Performance Comparison Circle Chart Topics PDF. This layout presents information on Employees Sales Performance, Comparison Circle Chart. It is also available for immediate download and adjustment. So, changes can be made in the color, design, graphics or any other component to create a unique layout.
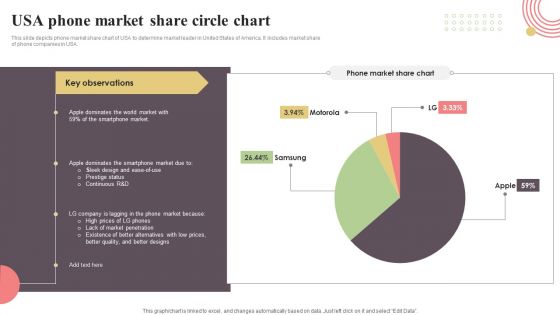
USA Phone Market Share Circle Chart Sample PDF
This slide depicts phone market share chart of USA to determine market leader in United States of America. It includes market share of phone companies in USA. Pitch your topic with ease and precision using this USA Phone Market Share Circle Chart Sample PDF. This layout presents information on USA Phone Market, Share Circle Chart. It is also available for immediate download and adjustment. So, changes can be made in the color, design, graphics or any other component to create a unique layout.

Business Chart Finance PowerPoint Themes And PowerPoint Slides 0211
Microsoft PowerPoint Theme and Slides with business chart shows financial success at the stock market Our Business Chart Finance PowerPoint Themes And PowerPoint Slides 0211 come at a comfortable cost. They are definitely an economical choice.
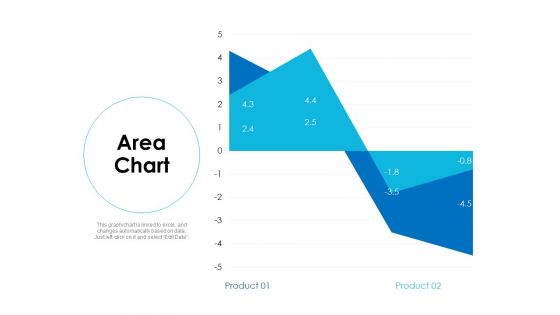
Area Chart Analysis Ppt Powerpoint Presentation Infographics Aids
Presenting this set of slides with name area chart analysis ppt powerpoint presentation infographics aids. The topics discussed in these slides are area chart, finance, marketing, investment, analysis. This is a completely editable PowerPoint presentation and is available for immediate download. Download now and impress your audience.
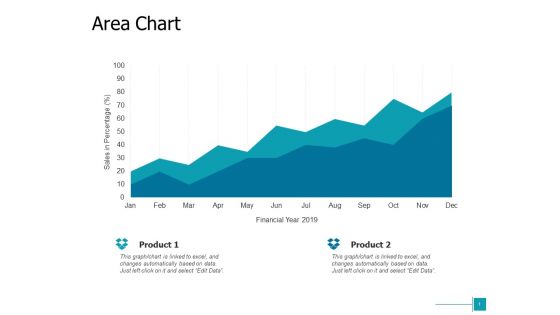
Area Chart Analysis Ppt Powerpoint Presentation Model Layout Ideas
Presenting this set of slides with name area chart analysis ppt powerpoint presentation model layout ideas. The topics discussed in these slides are area chart, finance, marketing, investment, analysis. This is a completely editable PowerPoint presentation and is available for immediate download. Download now and impress your audience.
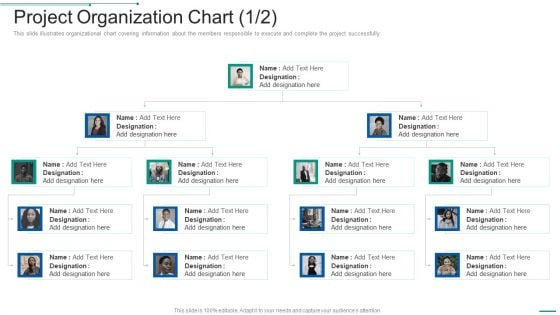
PMP Toolkit Project Organization Chart Ppt Portfolio Layout Ideas PDF
Following slide portrays organizational chart covering information about the members responsible to execute and complete the project successfully. This is a pmp toolkit project organization chart ppt portfolio layout ideas pdf template with various stages. Focus and dispense information on two stages using this creative set, that comes with editable features. It contains large content boxes to add your information on topics like project organization chart. You can also showcase facts, figures, and other relevant content using this PPT layout. Grab it now.
Pie Chart Money Business PowerPoint Templates And PowerPoint Themes 0612
Pie Chart Money Business PowerPoint Templates And PowerPoint Themes PPT Slides-Microsoft Powerpoint Templates and Background with pie chart graph Our Pie Chart Money Business PowerPoint Templates And PowerPoint Themes 0612 are clinically correct. Every detail has been closely examined.
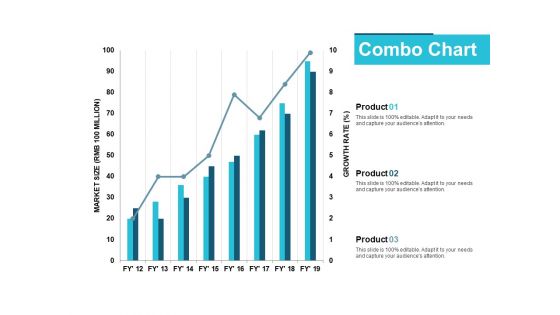
Combo Chart Finance Ppt PowerPoint Presentation Infographic Template Model
This is a combo chart finance ppt powerpoint presentation infographic template model. The topics discussed in this diagram are finance, marketing, management, investment, analysis. This is a completely editable PowerPoint presentation, and is available for immediate download.
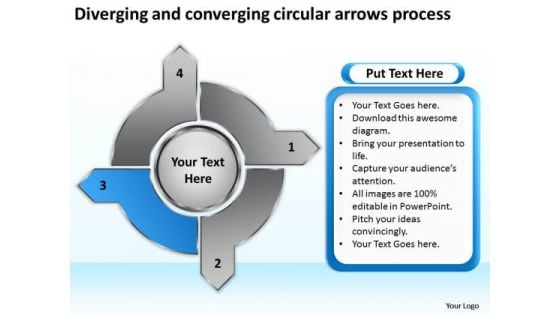
Diverging And Converging Circular Arrows Process Radial Chart PowerPoint Slides
We present our diverging and converging circular arrows process Radial Chart PowerPoint Slides.Use our Circle charts PowerPoint Templates because the atmosphere in the worplace is electric. Download our Arrows PowerPoint Templates because clear thnking is your strength, transmit your thoughts to your eager team. Download and present our Flow charts PowerPoint Templates because you know your business and have a vision for it. Present our Business PowerPoint Templates because the majestic tiger lord of all it surveys.It exudes power even when it is in repose. Use our Shapes PowerPoint Templates because this slide illuminates the spiritual brilliance of Jesus and showers the love for mankind he showed even while being crucified.Use these PowerPoint slides for presentations relating to aim, arrow, background, business, career, chart, circle, color, concept creative, curve, design, development, direction, financial, flowing, gain, graph, group, growth, higher, illustration, increase, isolated, motion, moving, moving up, path prediction, progress, red, series, shape, sign, success, symbol, target, turn, twisted, up upload, upward, way. The prominent colors used in the PowerPoint template are Blue light, Gray, White. You can be sure our diverging and converging circular arrows process Radial Chart PowerPoint Slides are Dynamic. You can be sure our career PowerPoint templates and PPT Slides are Pleasant. People tell us our diverging and converging circular arrows process Radial Chart PowerPoint Slides are Wistful. We assure you our chart PowerPoint templates and PPT Slides are Fantastic. The feedback we get is that our diverging and converging circular arrows process Radial Chart PowerPoint Slides are Colorful. We assure you our chart PowerPoint templates and PPT Slides will make the presenter look like a pro even if they are not computer savvy. Our Diverging And Converging Circular Arrows Process Radial Chart PowerPoint Slides cover a broad ambit. They help you articulate on an array of aspects.
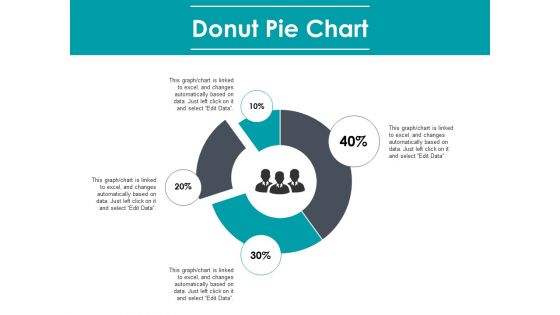
Donut Pie Chart Finance Marketing Ppt PowerPoint Presentation Layouts Ideas
This is a donut pie chart finance marketing ppt powerpoint presentation layouts ideas. The topics discussed in this diagram are finance, marketing, management, investment, analysis. This is a completely editable PowerPoint presentation, and is available for immediate download.
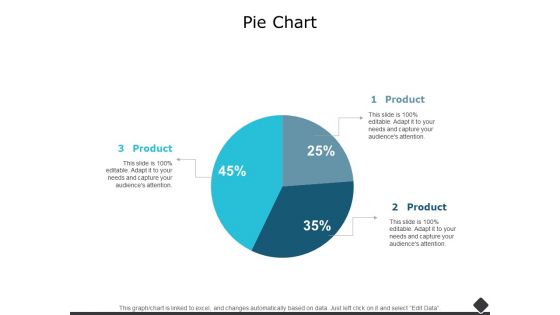
Pie Chart Finance Marketing Ppt PowerPoint Presentation Professional Design Ideas
This is a pie chart finance marketing ppt powerpoint presentation professional design ideas. The topics discussed in this diagram are finance, marketing, management, investment, analysis. This is a completely editable PowerPoint presentation, and is available for immediate download.
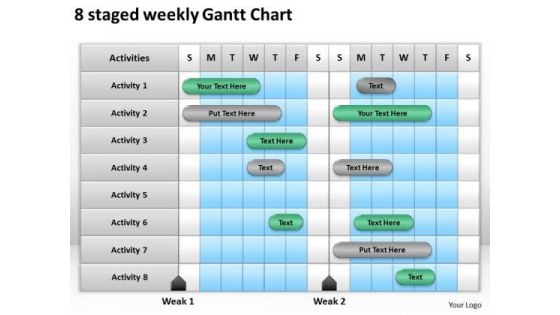
Strategy PowerPoint Template 8 Staged Weekly Gantt Chart Ppt Slides
Dreams generate thoughts, thoughts generate ideas. Give them life with our strategy powerpoint template 8 staged weekly gantt chart ppt Slides. Dreams are the start of many a journey. Pave the way with our Org Charts PowerPoint Templates PowerPoint Templates. Your thoughts will be the main course. Provide the dressing with our Business PowerPoint Templates. Implement plans with our Strategy PowerPoint Template 8 Staged Weekly Gantt Chart Ppt Slides. Download without worries with our money back guaranteee.
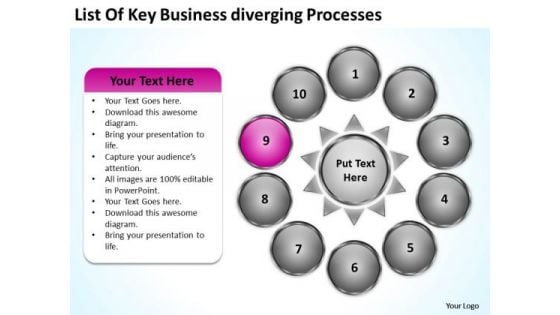
Nine Stages Diverging Factors Flow Chart Circular Diagram PowerPoint Templates
We present our nine stages diverging factors flow chart Circular Diagram PowerPoint templates.Download our Ring Charts PowerPoint Templates because the basic stages are in place, you need to build upon them with our PowerPoint templates. Download and present our Process and Flows PowerPoint Templates because brilliant ideas are your forte. Download and present our Circle charts PowerPoint Templates because you can Refine them all as you take them through the numerous filtering stages of the funnel of your quality control process. Download our Arrows PowerPoint Templates because this template contains the material to highlight the key issues of your presentation. Download our Success PowerPoint Templates because you have come up with a brilliant breakthrough idea. you can also visualise the interest it will generate.Use these PowerPoint slides for presentations relating to Arrow, blue, business, chart, check,circle, concept, control, creative, cycle,design, development, diagram, do,engineering, evaluate, flow, glossy,graphic, green, idea, infographic, life,lifecycle, management, marketing,method, model, pdca, plan, plan,docheckact, process, quality, red,research, software, spiral, step, strategy,success, system. The prominent colors used in the PowerPoint template are Pink, White, Gray. People tell us our nine stages diverging factors flow chart Circular Diagram PowerPoint templates look good visually. Customers tell us our chart PowerPoint templates and PPT Slides are Precious. Professionals tell us our nine stages diverging factors flow chart Circular Diagram PowerPoint templates are Beautiful. Presenters tell us our chart PowerPoint templates and PPT Slides will help you be quick off the draw. Just enter your specific text and see your points hit home. Use our nine stages diverging factors flow chart Circular Diagram PowerPoint templates are Spectacular. Presenters tell us our concept PowerPoint templates and PPT Slides are Second to none. Form plans with our Nine Stages Diverging Factors Flow Chart Circular Diagram PowerPoint Templates. Download without worries with our money back guaranteee.
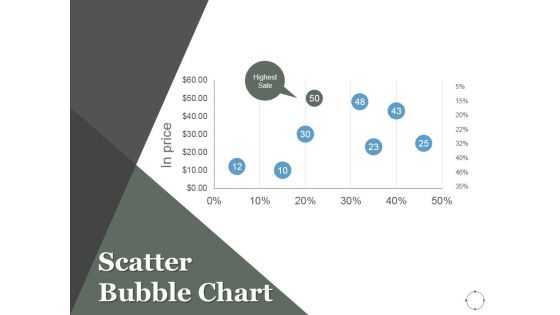
Scatter Bubble Chart Ppt PowerPoint Presentation Background Designs
This is a scatter bubble chart ppt powerpoint presentation background designs. This is a eight stage process. The stages in this process are projects, marketing, scatter chart, finance, management.

Donut Pie Chart Ppt PowerPoint Presentation Professional Files
This is a donut pie chart ppt powerpoint presentation professional files. This is a five stage process. The stages in this process are donut pie chart, finance, marketing, investment, analysis, business.
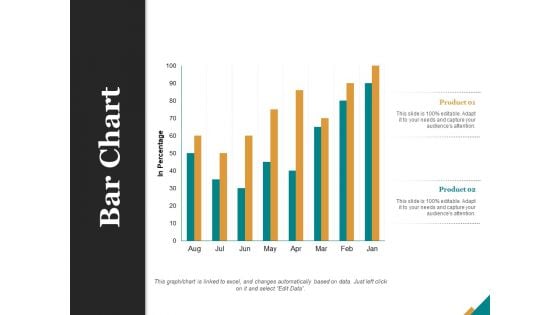
Bar Chart Finance Ppt PowerPoint Presentation Portfolio Model
This is a bar chart finance ppt powerpoint presentation portfolio model. This is a two stage process. The stages in this process are finance, marketing, management, investment, analysis.
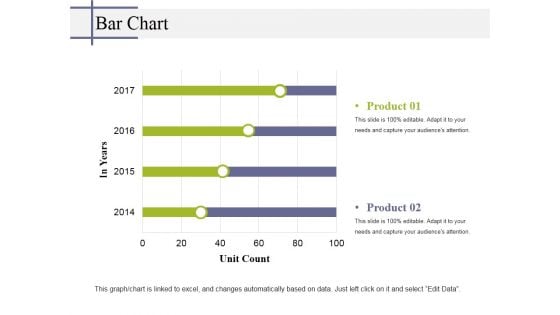
Bar Chart Ppt PowerPoint Presentation Infographic Template Tips
This is a bar chart ppt powerpoint presentation infographic template tips. This is a two stage process. The stages in this process are bar chart, finance, marketing, strategy, business.
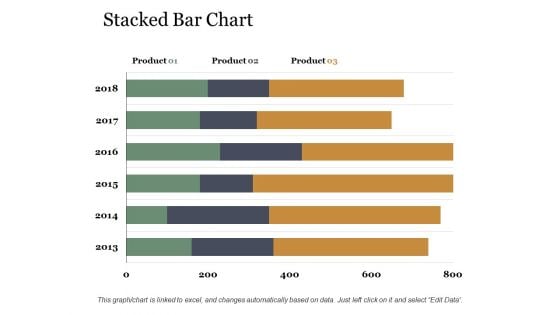
Stacked Bar Chart Ppt PowerPoint Presentation Portfolio Templates
This is a stacked bar chart ppt powerpoint presentation portfolio templates. This is a three stage process. The stages in this process are stacked bar chart, product, year, business, finance.
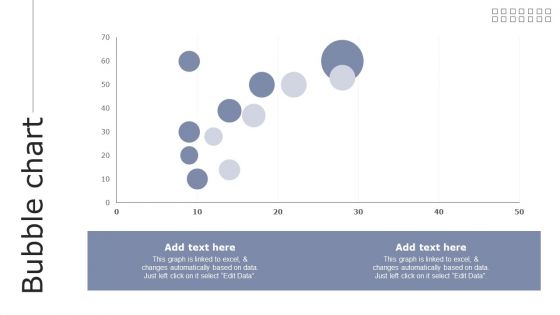
Bubble Chart Guide To Asset Cost Estimation Structure PDF
There are so many reasons you need a Bubble Chart Guide To Asset Cost Estimation Structure PDF. The first reason is you can not spend time making everything from scratch, Thus, Slidegeeks has made presentation templates for you too. You can easily download these templates from our website easily.
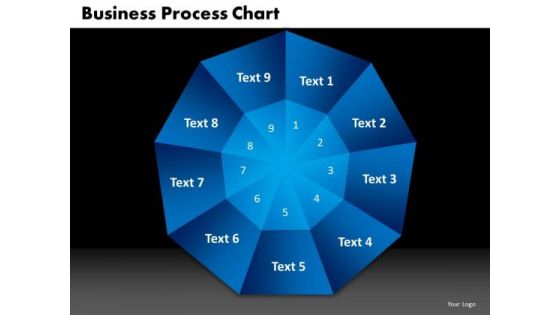
PowerPoint Slide Designs Process Chart Business Ppt Designs
PowerPoint Slide Designs Process Chart Business PPT Designs-The Circle of Life - a concept emmbedded in our minds and hence easy to comprehend. Life and Business is made up of processes comprising stages that flow from one to another. An excellent graphic to attract the attention of and understanding by your audience to improve earnings-PowerPoint Slide Designs Process Chart Business PPT Designs-This ppt can be used for presentations relating to-Arrow, Bond, Business, Button, Buying, Career, Change, Chart, Children, Circle, College, Death, Diagram, Education, Financial, Future, Graphic, House, Illustration, Investing, Investment, Marriage, Menu, Personal, Plan, Process Put your thoughts on the anvil. Fashion them with our PowerPoint Slide Designs Process Chart Business Ppt Designs.
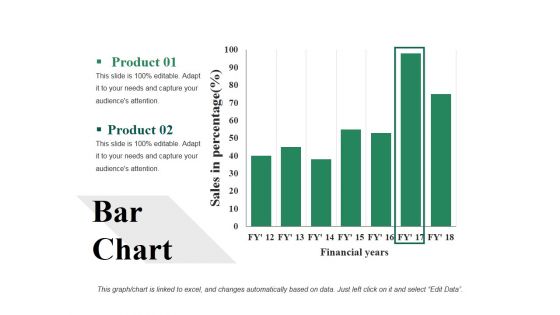
Bar Chart Ppt PowerPoint Presentation Visual Aids Backgrounds
This is a bar chart ppt powerpoint presentation visual aids backgrounds. This is a two stage process. The stages in this process are bar chart, analysis, strategy, finance, business.
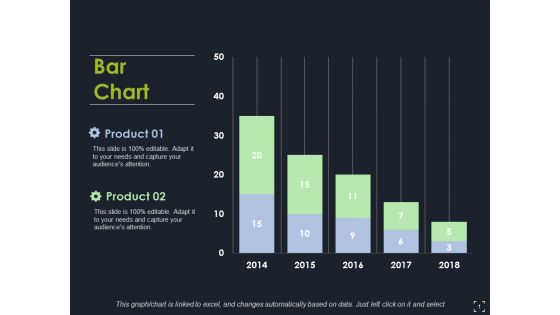
Bar Chart Ppt PowerPoint Presentation Model Clipart Images
This is a bar chart ppt powerpoint presentation model clipart images. This is a two stage process. The stages in this process are bar chart, finance, marketing, strategy, analysis.
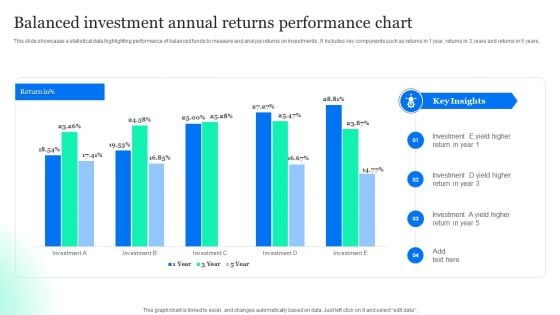
Balanced Investment Annual Returns Performance Chart Designs PDF
This slide showcases a statistical data highlighting performance of balanced funds to measure and analyze returns on investments . It includes key components such as returns in 1 year, returns in 3 years and returns in 5 years. Pitch your topic with ease and precision using this Balanced Investment Annual Returns Performance Chart Designs PDF. This layout presents information on Balanced Investment, Annual Returns, Performance Chart. It is also available for immediate download and adjustment. So, changes can be made in the color, design, graphics or any other component to create a unique layout.
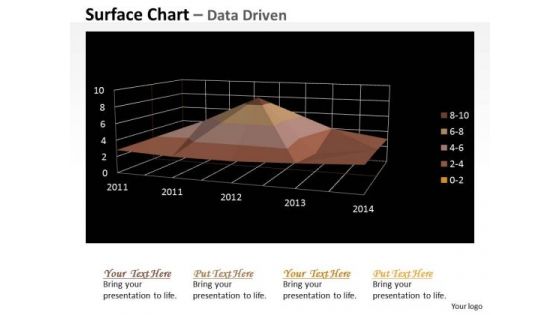
Multivariate Data Analysis Numeric Values Surface Chart PowerPoint Templates
Your Grasp Of Economics Is Well Known. Help Your Audience Comprehend Issues With Our multivariate data analysis numeric values surface chart Powerpoint Templates .
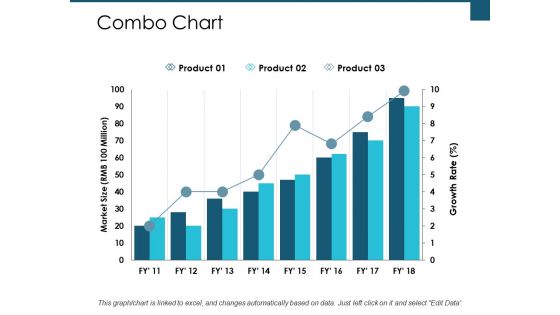
Combo Chart Finance Ppt PowerPoint Presentation Portfolio Templates
This is a combo chart finance ppt powerpoint presentation portfolio templates. This is a three stage process. The stages in this process are finance, analysis, business, investment, marketing.

Combo Chart Ppt PowerPoint Presentation Infographic Template Themes
This is a combo chart ppt powerpoint presentation infographic template themes. This is a eight stage process. The stages in this process are combo chart, finance, marketing, strategy, analysis, business.
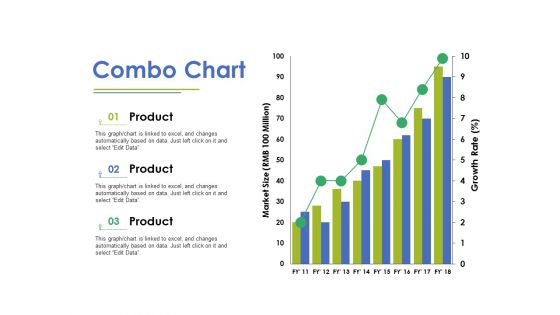
Combo Chart Ppt PowerPoint Presentation Layouts Background Image
This is a combo chart ppt powerpoint presentation layouts background image. This is a three stage process. The stages in this process are bar chart, marketing, strategy, finance, planning.
Scatter Bubble Chart Ppt PowerPoint Presentation Icon Templates
This is a scatter bubble chart ppt powerpoint presentation icon templates. This is a eight stage process. The stages in this process are business, finance, management, scatter chart, marketing.
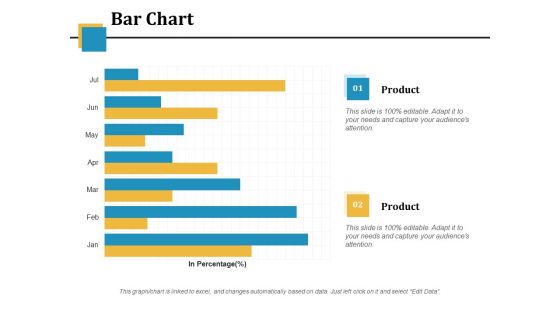
Bar Chart Ppt PowerPoint Presentation Infographic Template Picture
This is a bar chart ppt powerpoint presentation infographic template picture. This is a two stage process. The stages in this process are financial, in percentage, business, marketing, bar chart.

Consumer Service Process Flow Chart For Banking Industry Themes PDF
Persuade your audience using this Consumer Service Process Flow Chart For Banking Industry Themes PDF. This PPT design covers Four stages, thus making it a great tool to use. It also caters to a variety of topics including Consumer Service, Banking Industry. Download this PPT design now to present a convincing pitch that not only emphasizes the topic but also showcases your presentation skills.
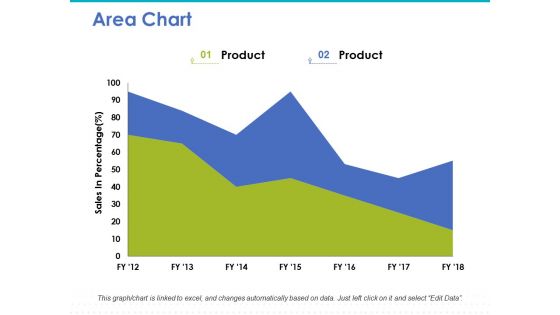
Area Chart Ppt PowerPoint Presentation Infographic Template Inspiration
This is a area chart ppt powerpoint presentation infographic template inspiration. This is a two stage process. The stages in this process are area chart, marketing, strategy, finance, planning.
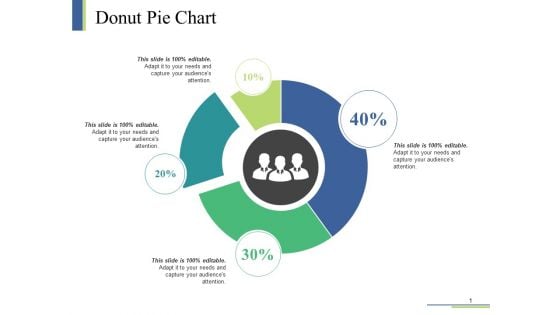
Donut Pie Chart Ppt PowerPoint Presentation Visual Aids Infographic Template
This is a donut pie chart ppt powerpoint presentation visual aids infographic template. This is a four stage process. The stages in this process are donut pie chart, finance, planning, management, marketing.
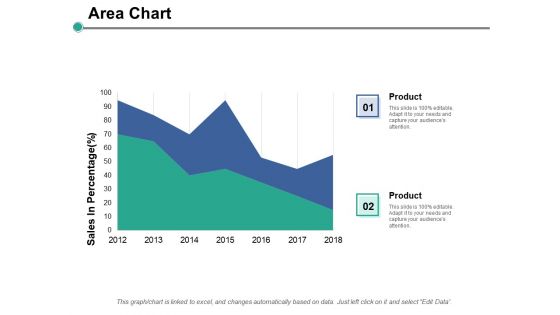
Area Chart Finance Ppt PowerPoint Presentation Gallery Elements
This is a area chart finance ppt powerpoint presentation gallery elements. This is a two stage process. The stages in this process are finance, marketing, management, investment, analysis.
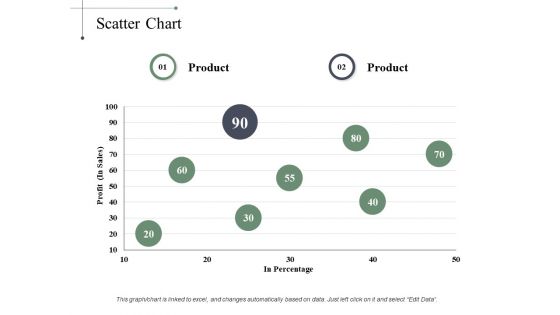
Scatter Chart Finance Ppt PowerPoint Presentation Ideas Show
This is a scatter chart finance ppt powerpoint presentation ideas show. This is a two stage process. The stages in this process are finance, marketing, analysis, business, investment.
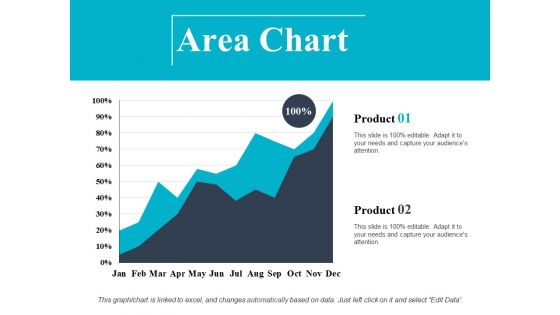
Area Chart Finance Ppt PowerPoint Presentation Slides Layout
This is a area chart finance ppt powerpoint presentation slides layout. This is a two stage process. The stages in this process are finance, marketing, management, investment, analysis.
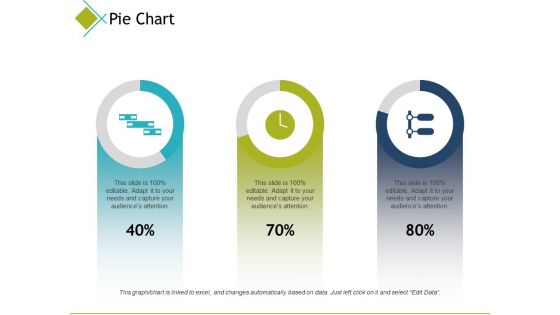
Pie Chart Finance Ppt PowerPoint Presentation Inspiration Introduction
This is a pie chart finance ppt powerpoint presentation inspiration introduction. This is a three stage process. The stages in this process are finance, marketing, analysis, business, investment.
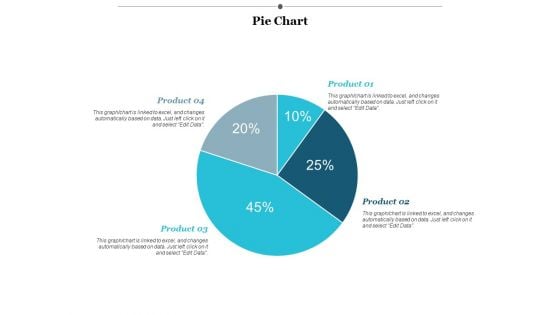
Pie Chart Finance Ppt PowerPoint Presentation Layouts Designs
This is a Pie Chart Finance Ppt PowerPoint Presentation Layouts Designs. This is a four stage process. The stages in this process are finance, marketing, management, investment, analysis.
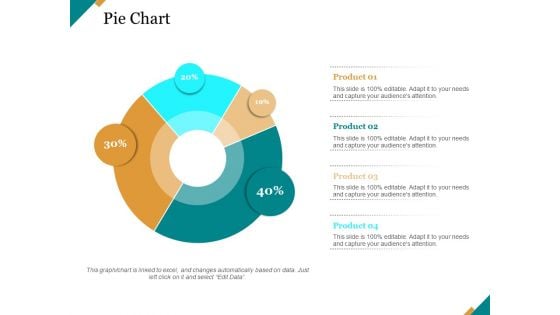
Pie Chart Finance Ppt PowerPoint Presentation Model Ideas
This is a pie chart finance ppt powerpoint presentation model ideas. This is a four stage process. The stages in this process are finance, marketing, management, investment, analysis.

Column Chart Finance Ppt PowerPoint Presentation Styles Backgrounds
This is a column chart finance ppt powerpoint presentation styles backgrounds. This is a three stage process. The stages in this process are finance, marketing, management, investment, analysis.
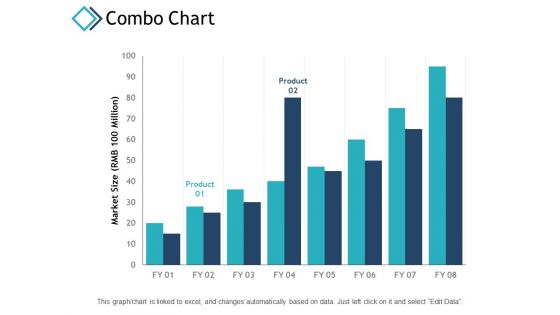
Combo Chart Finance Ppt PowerPoint Presentation Portfolio Gridlines
This is a combo chart finance ppt powerpoint presentation portfolio gridlines. This is a two stage process. The stages in this process are finance, analysis, business, investment, marketing.
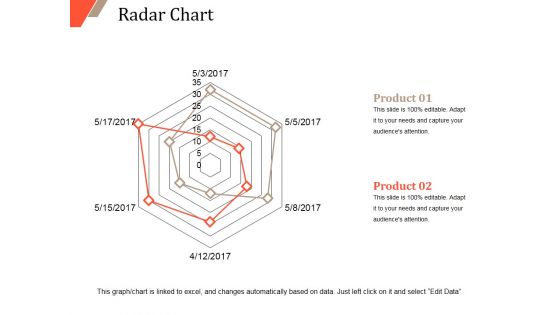
Radar Chart Ppt PowerPoint Presentation Portfolio Design Templates
This is a radar chart ppt powerpoint presentation portfolio design templates. This is a two stage process. The stages in this process are radar chart, product, finance, marketing, strategy, business.
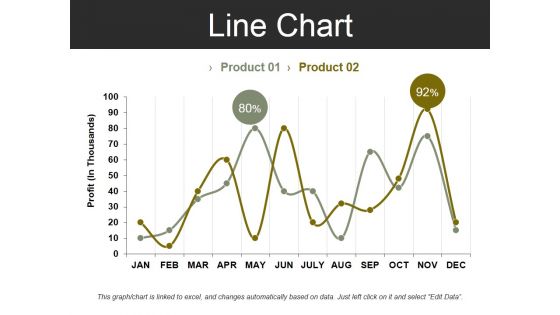
Line Chart Template 2 Ppt PowerPoint Presentation Summary Design Inspiration
This is a line chart template 2 ppt powerpoint presentation summary design inspiration. This is a two stage process. The stages in this process are profit, business, marketing, finance, chart.

Column Chart Ppt PowerPoint Presentation Infographic Template Slides
This is a column chart ppt powerpoint presentation infographic template slides. This is a two stage process. The stages in this process are column chart, finance, marketing, strategy, business.


 Continue with Email

 Home
Home


