Budget Graph
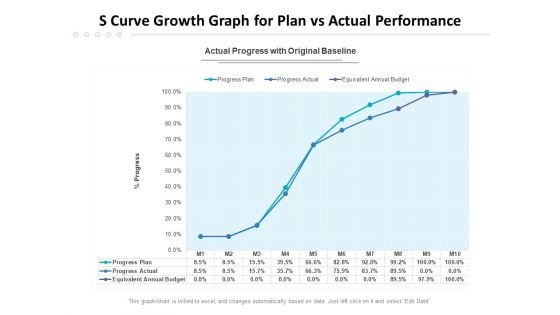
S Curve Growth Graph For Plan Vs Actual Performance Ppt PowerPoint Presentation Show Layouts PDF
Presenting this set of slides with name s curve growth graph for plan vs actual performance ppt powerpoint presentation show layouts pdf. The topics discussed in these slides are progress plan, progress actual, equivalent annual budget. This is a completely editable PowerPoint presentation and is available for immediate download. Download now and impress your audience.
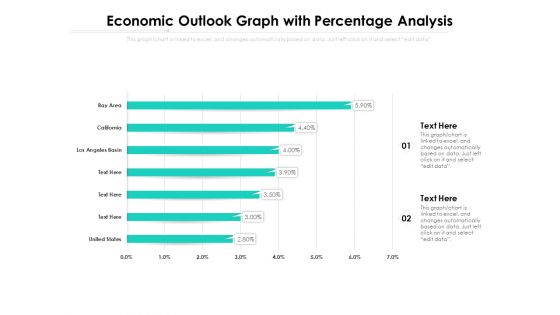
Economic Outlook Graph With Percentage Analysis Ppt PowerPoint Presentation Show Demonstration PDF
Presenting this set of slides with name economic outlook graph with percentage analysis ppt powerpoint presentation show demonstration pdf. The topics discussed in these slide is economic outlook graph with percentage analysis. This is a completely editable PowerPoint presentation and is available for immediate download. Download now and impress your audience.
Financial Graph Economic Growth Vector Icon Ppt PowerPoint Presentation Infographics Graphic Images Cpb
This is a financial graph economic growth vector icon ppt powerpoint presentation infographics graphic images cpb. This is a three stage process. The stages in this process are bar chart icon, bar graph icon, data chart icon.
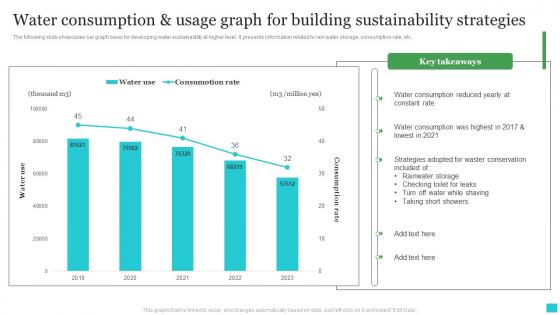
Water Consumption And Usage Graph For Building Sustainability Strategies Ideas Pdf
The following slide showcases bar graph basis for developing water sustainability at higher level. It presents information related to rain water storage, consumption rate, etc. Pitch your topic with ease and precision using this Water Consumption And Usage Graph For Building Sustainability Strategies Ideas Pdf. This layout presents information on Water Consumption, Constant Rate, Rainwater Storage. It is also available for immediate download and adjustment. So, changes can be made in the color, design, graphics or any other component to create a unique layout. The following slide showcases bar graph basis for developing water sustainability at higher level. It presents information related to rain water storage, consumption rate, etc.
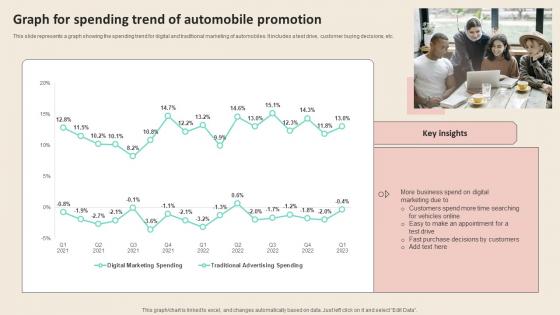
Graph For Spending Trend Of Automobile Promotional Strategies To Increase Download PDF
This slide represents a graph showing the spending trend for digital and traditional marketing of automobiles. It includes a test drive, customer buying decisions, etc. Whether you have daily or monthly meetings, a brilliant presentation is necessary. Graph For Spending Trend Of Automobile Promotional Strategies To Increase Download PDF can be your best option for delivering a presentation. Represent everything in detail using Graph For Spending Trend Of Automobile Promotional Strategies To Increase Download PDF and make yourself stand out in meetings. The template is versatile and follows a structure that will cater to your requirements. All the templates prepared by Slidegeeks are easy to download and edit. Our research experts have taken care of the corporate themes as well. So, give it a try and see the results. This slide represents a graph showing the spending trend for digital and traditional marketing of automobiles. It includes a test drive, customer buying decisions, etc.
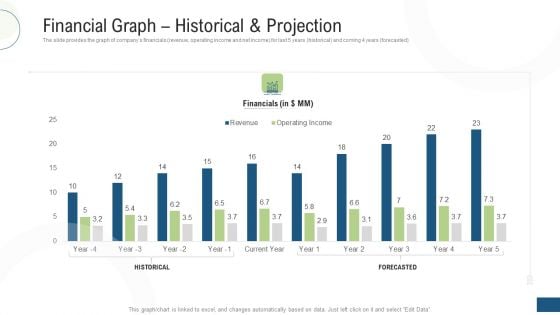
Investor Pitch Deck Fundraising Via Mezzanine Equity Instrument Financial Graph Historical And Projection Formats PDF
The slide provides the graph of companys financials revenue, operating income and net income for last 5 years historical and coming 4 years forecasted. Deliver and pitch your topic in the best possible manner with this investor pitch deck fundraising via mezzanine equity instrument financial graph historical and projection formats pdf. Use them to share invaluable insights on financial graph historical and projection and impress your audience. This template can be altered and modified as per your expectations. So, grab it now.
Loss In Money Graph Finance PowerPoint Templates And PowerPoint Themes 0812
Loss In Money Graph Finance PowerPoint Templates And PowerPoint Themes 0812-Microsoft Powerpoint Templates and Background with graph moving down and showing money loss Load up with our Loss In Money Graph Finance PowerPoint Templates And PowerPoint Themes 0812 with our Loss In Money Graph Finance PowerPoint Templates And PowerPoint Themes 0812. You will be at the top of your game.
Profit And Loss Graph Concept Finance PowerPoint Templates And PowerPoint Themes 0912
Profit And Loss Graph Concept Finance PowerPoint Templates And PowerPoint Themes 0912-Microsoft Powerpoint Templates and Background with profit and loss graph-Profit and loss graph, business, finance, money, sales, marketing Father them through testing times. Bear the burden with our Profit And Loss Graph Concept Finance PowerPoint Templates And PowerPoint Themes 0912.

Microsoft Corporations Revenue Growth Graph Microsoft Long Term Business Professional PDF
This slide represents graph which ca be used to calculate the revenue growth of Microsoft in last twenty years. Microsofts revenue has been growing continuously over the past 5 years since. Presenting this PowerPoint presentation, titled Microsoft Corporations Revenue Growth Graph Microsoft Long Term Business Professional PDF, with topics curated by our researchers after extensive research. This editable presentation is available for immediate download and provides attractive features when used. Download now and captivate your audience. Presenting this Microsoft Corporations Revenue Growth Graph Microsoft Long Term Business Professional PDF. Our researchers have carefully researched and created these slides with all aspects taken into consideration. This is a completely customizable Microsoft Corporations Revenue Growth Graph Microsoft Long Term Business Professional PDF that is available for immediate downloading. Download now and make an impact on your audience. Highlight the attractive features available with our PPTs. This slide represents graph which ca be used to calculate the revenue growth of Microsoft in last twenty years. Microsofts revenue has been growing continuously over the past 5 years since.

Microsoft Corporations Revenue Growth Graph Strategic Advancements By Microsofts Diagrams Pdf
This slide represents graph which ca be used to calculate the revenue growth of Microsoft in last twenty years. Microsofts revenue has been growing continuously over the past 5 years since. Presenting this PowerPoint presentation, titled Microsoft Corporations Revenue Growth Graph Strategic Advancements By Microsofts Diagrams Pdf, with topics curated by our researchers after extensive research. This editable presentation is available for immediate download and provides attractive features when used. Download now and captivate your audience. Presenting this Microsoft Corporations Revenue Growth Graph Strategic Advancements By Microsofts Diagrams Pdf. Our researchers have carefully researched and created these slides with all aspects taken into consideration. This is a completely customizable Microsoft Corporations Revenue Growth Graph Strategic Advancements By Microsofts Diagrams Pdf that is available for immediate downloading. Download now and make an impact on your audience. Highlight the attractive features available with our PPTs. This slide represents graph which ca be used to calculate the revenue growth of Microsoft in last twenty years. Microsofts revenue has been growing continuously over the past 5 years since.
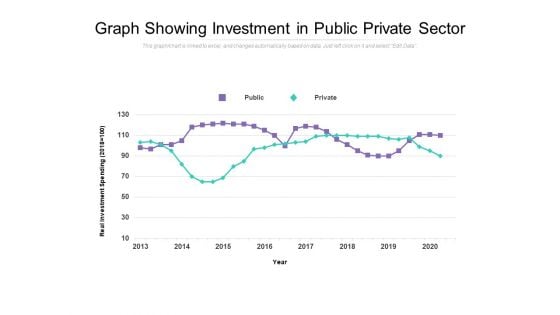
Graph Showing Investment In Public Private Sector Ppt PowerPoint Presentation Slides Structure
Presenting this set of slides with name graph showing investment in public private sector ppt powerpoint presentation slides structure. The topics discussed in these slide is graph showing investment in public private sector. This is a completely editable PowerPoint presentation and is available for immediate download. Download now and impress your audience.
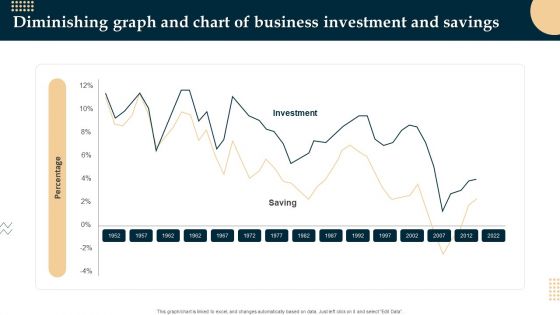
Diminishing Graph And Chart Of Business Investment And Savings Demonstration PDF
Showcasing this set of slides titled Diminishing Graph And Chart Of Business Investment And Savings Demonstration PDF. The topics addressed in these templates are Diminishing Graph, Chart Of Business Investment. All the content presented in this PPT design is completely editable. Download it and make adjustments in color, background, font etc. as per your unique business setting.
Investing In Start Ups Column Graph Ppt Icon Design Inspiration PDF
Presenting this set of slides with name investing in start ups column graph ppt icon design inspiration pdf. The topics discussed in these slides are column graph. This is a completely editable PowerPoint presentation and is available for immediate download. Download now and impress your audience.
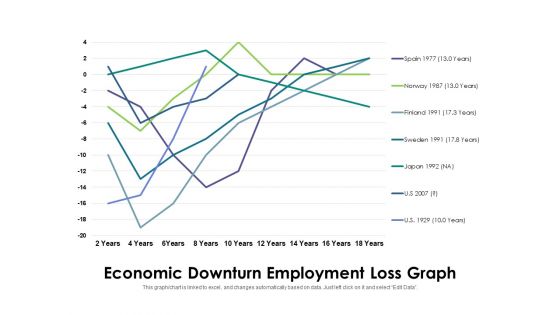
Economic Downturn Employment Loss Graph Ppt PowerPoint Presentation Outline Example File PDF
Pitch your topic with ease and precision using this economic downturn employment loss graph ppt powerpoint presentation outline example file pdf. This layout presents information on economic downturn employment loss graph. It is also available for immediate download and adjustment. So, changes can be made in the color, design, graphics or any other component to create a unique layout.
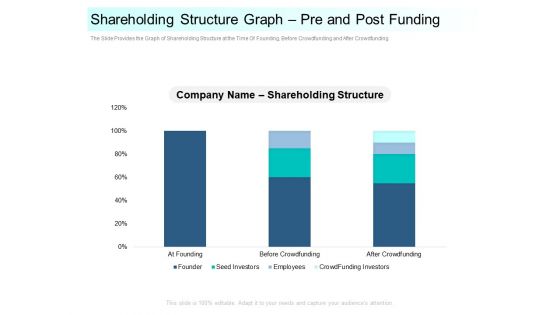
Community Capitalization Pitch Deck Shareholding Structure Graph Pre And Post Funding Template Pdf
The Slide Provides the Graph of Shareholding Structure at the Time Of Founding, Before Crowdfunding and After Crowdfunding. Deliver an awe inspiring pitch with this creative community capitalization pitch deck shareholding structure graph pre and post funding template pdf bundle. Topics like shareholding structure graph pre and post funding can be discussed with this completely editable template. It is available for immediate download depending on the needs and requirements of the user.
Financial Graph For Urban Population Growth With Prediction Figures Icons PDF
Showcasing this set of slides titled financial graph for urban population growth with prediction figures icons pdf. The topics addressed in these templates are financial graph for urban population growth with prediction figures. All the content presented in this PPT design is completely editable. Download it and make adjustments in color, background, font etc. as per your unique business setting.
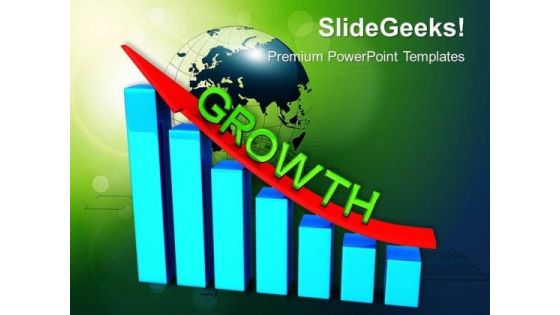
Business Bar Graph Upward Arrow Success PowerPoint Templates And PowerPoint Themes 0912
Business Bar Graph Upward Arrow Success PowerPoint Templates And PowerPoint Themes 0912-Microsoft Powerpoint Templates and Background with bar graph with upwards arrows-Bar graph with upwards arrows, success, money, arrows, finance, business Question doubts with our Business Bar Graph Upward Arrow Success PowerPoint Templates And PowerPoint Themes 0912. Download without worries with our money back guaranteee.
3d Pie Chart Graph And Dollar PowerPoint Templates And PowerPoint Themes 0912
3d Pie Chart Graph And Dollar PowerPoint Templates And PowerPoint Themes 0912-Microsoft Powerpoint Templates and Background with pie chart graph and dollar-Pie chart graph and dollar, business, signs, marketing, money, finance Connect the dots differently. Be daring with our 3d Pie Chart Graph And Dollar PowerPoint Templates And PowerPoint Themes 0912.

Pie Chart Graph Dollar Business PowerPoint Templates And PowerPoint Themes 0912
Pie Chart Graph Dollar Business PowerPoint Templates And PowerPoint Themes 0912-Microsoft Powerpoint Templates and Background with pie chart graph and dollar-Pie chart graph and dollar, business, signs, marketing, money, finance Fashion your plans on our Pie Chart Graph Dollar Business PowerPoint Templates And PowerPoint Themes 0912. They will always keep you in contention.
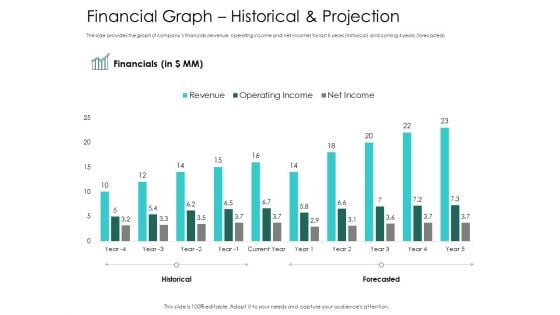
Hybrid Investment Pitch Deck Financial Graph Historical And Projection Ppt Portfolio Design Inspiration PDF
The slide provides the graph of companys financials revenue, operating income and net income for last 5 years historical and coming 4 years forecasted. Deliver an awe inspiring pitch with this creative hybrid investment pitch deck financial graph historical and projection ppt portfolio design inspiration pdf bundle. Topics like financial, revenue, operating income, net income can be discussed with this completely editable template. It is available for immediate download depending on the needs and requirements of the user.
Bar Graph And Pie Chart Finance PowerPoint Templates And PowerPoint Themes 0612
Bar Graph And Pie Chart Finance PowerPoint Templates And PowerPoint Themes Business-Microsoft Powerpoint Templates and Background with bar and pie graph Arouse a committee with our Bar Graph And Pie Chart Finance PowerPoint Templates And PowerPoint Themes 0612. Just download, type and present.

Dollar And Bar Graph Metaphor PowerPoint Templates And PowerPoint Themes 1012
Dollar And Bar Graph Metaphor PowerPoint Templates And PowerPoint Themes 1012-Microsoft Powerpoint Templates and Background with dollar and bar graph-Dollar And Bar Graph Metaphor PowerPoint Templates And PowerPoint Themes 1012-This PowerPoint template can be used for presentations relating to-Dollar and bar graph, money, signs, finance, business, success Drum up a fervour with our Dollar And Bar Graph Metaphor PowerPoint Templates And PowerPoint Themes 1012. You will come out on top.

Business Graph With Dollar Sign Marketing PowerPoint Templates And PowerPoint Themes 1012
Business Graph With Dollar Sign Marketing PowerPoint Templates And PowerPoint Themes 1012-Microsoft Powerpoint Templates and Background with bussiness graph with dollar sign-Business Graph With Dollar Sign Marketing PowerPoint Templates And PowerPoint Themes 1012-This PowerPoint template can be used for presentations relating to-Business graph with dollar sign, finance, business, success, signs, money Even out things with our Business Graph With Dollar Sign Marketing PowerPoint Templates And PowerPoint Themes 1012. Get your team on the same level.
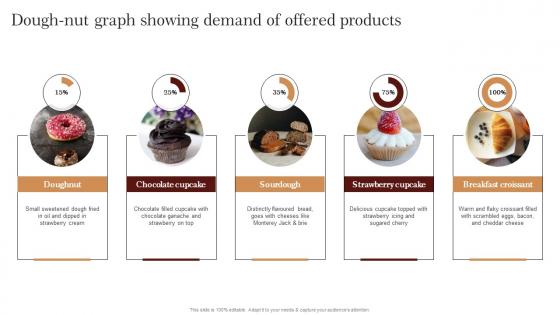
Dough Nut Graph Showing Demand Of Strategic Advertising Plan For Bakehouse Structure Pdf
Get a simple yet stunning designed Dough Nut Graph Showing Demand Of Strategic Advertising Plan For Bakehouse Structure Pdf. It is the best one to establish the tone in your meetings. It is an excellent way to make your presentations highly effective. So, download this PPT today from Slidegeeks and see the positive impacts. Our easy to edit Dough Nut Graph Showing Demand Of Strategic Advertising Plan For Bakehouse Structure Pdf can be your go to option for all upcoming conferences and meetings. So, what are you waiting for Grab this template today. Our Dough Nut Graph Showing Demand Of Strategic Advertising Plan For Bakehouse Structure Pdf are topically designed to provide an attractive backdrop to any subject. Use them to look like a presentation pro.
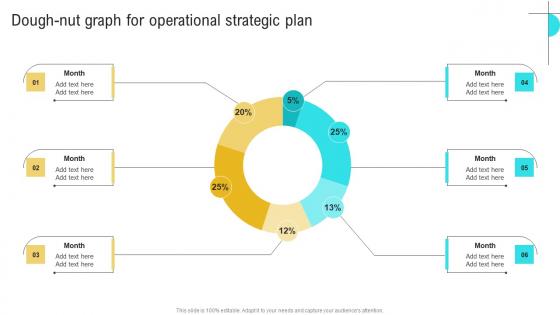
Dough Nut Graph For Operational Business Performance Optimization New Operations Strategy Brochure Pdf
If you are looking for a format to display your unique thoughts, then the professionally designed Dough Nut Graph For Operational Business Performance Optimization New Operations Strategy Brochure Pdf is the one for you. You can use it as a Google Slides template or a PowerPoint template. Incorporate impressive visuals, symbols, images, and other charts. Modify or reorganize the text boxes as you desire. Experiment with shade schemes and font pairings. Alter, share or cooperate with other people on your work. Download Dough Nut Graph For Operational Business Performance Optimization New Operations Strategy Brochure Pdf and find out how to give a successful presentation. Present a perfect display to your team and make your presentation unforgettable. Our Dough Nut Graph For Operational Business Performance Optimization New Operations Strategy Brochure Pdf are topically designed to provide an attractive backdrop to any subject. Use them to look like a presentation pro.
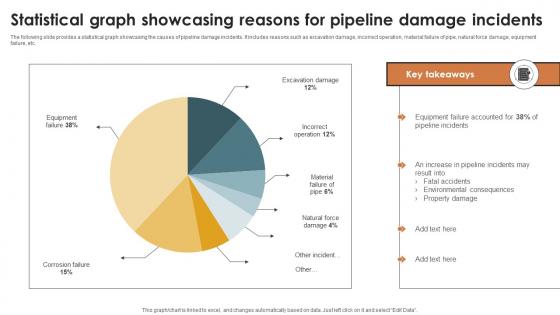
IoT Solutions For Oil Statistical Graph Showcasing Reasons For Pipeline IoT SS V
The following slide provides a statistical graph showcasing the causes of pipeline damage incidents. It includes reasons such as excavation damage, incorrect operation, material failure of pipe, natural force damage, equipment failure, etc. Want to ace your presentation in front of a live audience Our IoT Solutions For Oil Statistical Graph Showcasing Reasons For Pipeline IoT SS V can help you do that by engaging all the users towards you. Slidegeeks experts have put their efforts and expertise into creating these impeccable powerpoint presentations so that you can communicate your ideas clearly. Moreover, all the templates are customizable, and easy-to-edit and downloadable. Use these for both personal and commercial use. The following slide provides a statistical graph showcasing the causes of pipeline damage incidents. It includes reasons such as excavation damage, incorrect operation, material failure of pipe, natural force damage, equipment failure, etc.
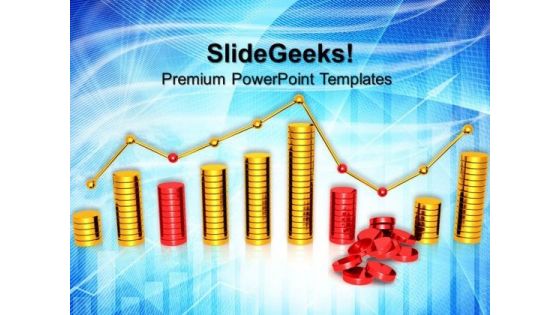
Business Graph With Failure Finance PowerPoint Templates And PowerPoint Themes 0812
Business Graph With Failure Finance PowerPoint Templates And PowerPoint Themes 0812-Microsoft Powerpoint Templates and Background with failure graph Our Business Graph With Failure Finance PowerPoint Templates And PowerPoint Themes 0812 are fertile ground. They encourage your thoughts to grow.

Increase Graph And Dollar Finance PowerPoint Templates And PowerPoint Themes 0612
Increase Graph And Dollar Finance PowerPoint Templates And PowerPoint Themes Business-Microsoft Powerpoint Templates and Background with graph dollar Evaluate performance with our Increase Graph And Dollar Finance PowerPoint Templates And PowerPoint Themes 0612. They help you deliver with accuracy.
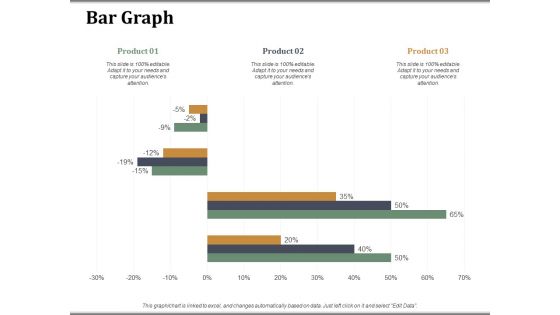
Bar Graph Companys Business Model Canvas Ppt PowerPoint Presentation Visual Aids Model
This is a bar graph companys business model canvas ppt powerpoint presentation visual aids model. This is a three stage process. The stages in this process are bar graph, finance, marketing, strategy, analysis, business.
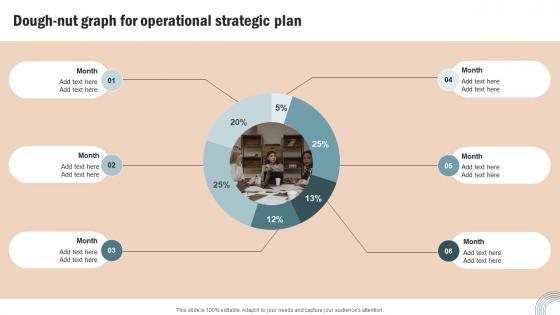
Dough Nut Graph Operational Operations Strategy Improve Business Productivity Structure Pdf
If your project calls for a presentation, then Slidegeeks is your go to partner because we have professionally designed, easy to edit templates that are perfect for any presentation. After downloading, you can easily edit Dough Nut Graph Operational Operations Strategy Improve Business Productivity Structure Pdf and make the changes accordingly. You can rearrange slides or fill them with different images. Check out all the handy templates Our Dough Nut Graph Operational Operations Strategy Improve Business Productivity Structure Pdf are topically designed to provide an attractive backdrop to any subject. Use them to look like a presentation pro.
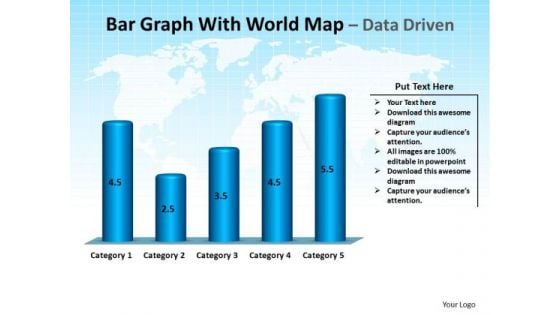
Business Success PowerPoint Templates Business Bar Graph With World Map Ppt Slides
Business Success PowerPoint Templates Business bar graph with world map PPT Slides-This PowerPoint Template is a illustration of bar garph with world map on blue background -Business Success PowerPoint Templates Business bar graph with world map PPT Slides-This ppt can be used for concepts relating to-animated, business, finance, sales, marketing, accounting, future, education, america, Antarctica, arrow, Asia, charts, statistics, budget, investment, abstract, australia, background, bar, blue, calculation, company and continents. Load up with our Business Success PowerPoint Templates Business Bar Graph With World Map Ppt Slides with our Business Success PowerPoint Templates Business Bar Graph With World Map Ppt Slides. You will be at the top of your game.
Pie Graph Icon Circle Charts PowerPoint Templates And PowerPoint Themes 0612
Pie Graph Icon Circle Charts PowerPoint Templates And PowerPoint Themes Business-Microsoft Powerpoint Templates and Background with pie chart icon Enhance feasibility with our Pie Graph Icon Circle Charts PowerPoint Templates And PowerPoint Themes 0612. Exhort your team to eventual success.
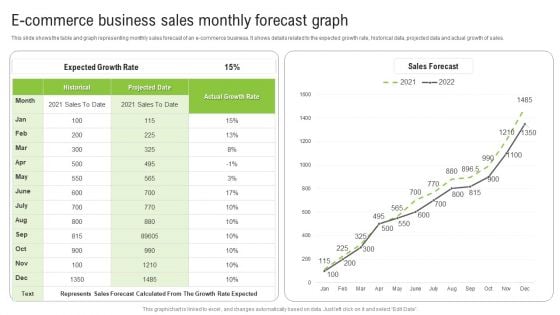
E Commerce Business Sales Monthly Forecast Graph Ppt Infographics Show PDF
This slide shows the table and graph representing monthly sales forecast of an e-commerce business. It shows details related to the expected growth rate, historical data, projected data and actual growth of sales. Pitch your topic with ease and precision using this E Commerce Business Sales Monthly Forecast Graph Ppt Infographics Show PDF. This layout presents information on Expected Growth Rate, Historical, Actual Growth Rate. It is also available for immediate download and adjustment. So, changes can be made in the color, design, graphics or any other component to create a unique layout.
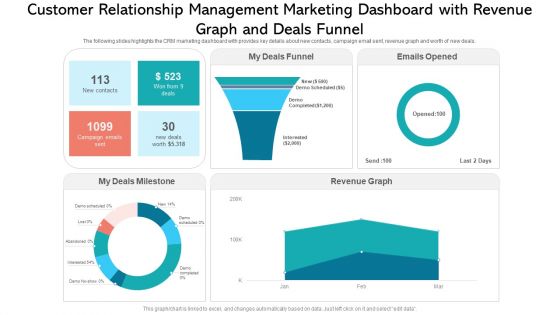
Customer Relationship Management Marketing Dashboard With Revenue Graph And Deals Funnel Ideas PDF
The following slides highlights the CRM marketing dashboard with provides key details about new contacts, campaign email sent, revenue graph and worth of new deals. Showcasing this set of slides titled customer relationship management marketing dashboard with revenue graph and deals funnel ideas pdf. The topics addressed in these templates are funnel, revenue graph, campaign. All the content presented in this PPT design is completely editable. Download it and make adjustments in color, background, font etc. as per your unique business setting.
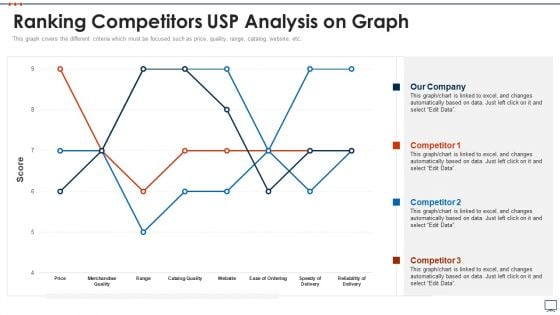
Business Plan Methods Tools And Templates Set 2 Ranking Competitors USP Analysis On Graph Elements PDF
This graph covers the different criteria which must be focused such as price, quality, range, catalog, website, etc. Deliver and pitch your topic in the best possible manner with this business plan methods tools and templates set 2 ranking competitors usp analysis on graph elements pdf. Use them to share invaluable insights on ranking competitors usp analysis on graph and impress your audience. This template can be altered and modified as per your expectations. So, grab it now.
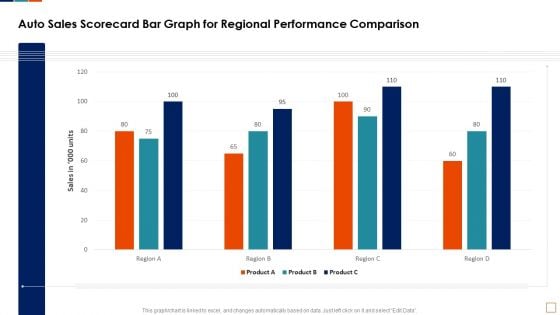
Auto Sales Scorecard Bar Graph For Regional Performance Comparison Infographics PDF
This graph or chart is linked to excel, and changes automatically based on data. Just left click on it and select Edit Data. Deliver an awe inspiring pitch with this creative Auto Sales Scorecard Bar Graph For Regional Performance Comparison Infographics PDF bundle. Topics like Auto Sales Scorecard, Bar Graph Regional, Performance Comparison Product can be discussed with this completely editable template. It is available for immediate download depending on the needs and requirements of the user.
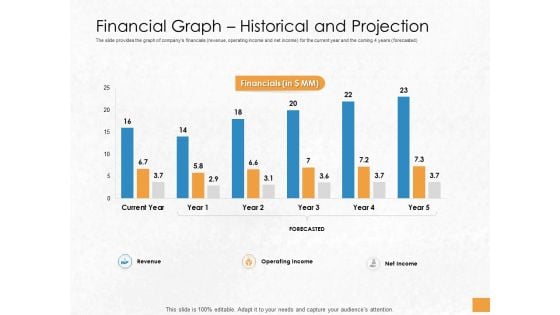
Convertible Debenture Funding Financial Graph Historical And Projection Ppt Professional Themes PDF
The slide provides the graph of companys financials revenue, operating income and net income for the current year and the coming 4 years forecasted. Deliver an awe-inspiring pitch with this creative convertible debenture funding financial graph historical and projection ppt professional themes pdf bundle. Topics like revenue, operating income, net income, forecasted, financials, current year can be discussed with this completely editable template. It is available for immediate download depending on the needs and requirements of the user.
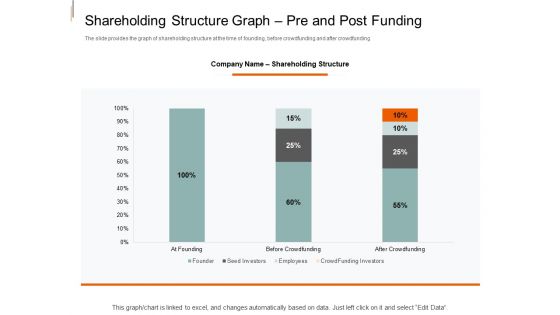
Equity Crowd Investing Shareholding Structure Graph Pre And Post Funding Background PDF
The slide provides the graph of shareholding structure at the time of founding, before crowdfunding and after crowdfunding. Deliver an awe inspiring pitch with this creative equity crowd investing shareholding structure graph pre and post funding background pdf bundle. Topics like founder, seed investors, employees, crowdfunding investors, before crowdfunding, after crowdfunding can be discussed with this completely editable template. It is available for immediate download depending on the needs and requirements of the user.
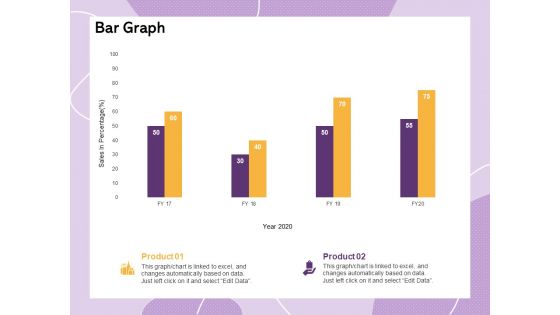
Investor Presentation For Society Funding Bar Graph Ppt PowerPoint Presentation Portfolio Show PDF
Presenting this set of slides with name investor presentation for society funding bar graph ppt powerpoint presentation portfolio show pdf. The topics discussed in these slide is bar graph. This is a completely editable PowerPoint presentation and is available for immediate download. Download now and impress your audience.

Group Of Pencils Graph Business PowerPoint Templates And PowerPoint Themes 0612
Group Of Pencils Graph Business PowerPoint Templates And PowerPoint Themes PPT Slides-Microsoft Powerpoint Templates and Background with pencil graph Get comfy with our Group Of Pencils Graph Business PowerPoint Templates And PowerPoint Themes 0612. Make your audience feel at ease.
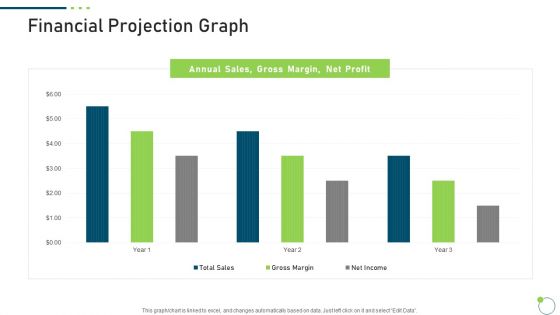
Investor Pitch Deck New Venture Capital Raising Financial Projection Graph Demonstration PDF
Deliver an awe inspiring pitch with this creative investor pitch deck new venture capital raising financial projection graph demonstration pdf bundle. Topics like financial projection graph can be discussed with this completely editable template. It is available for immediate download depending on the needs and requirements of the user.
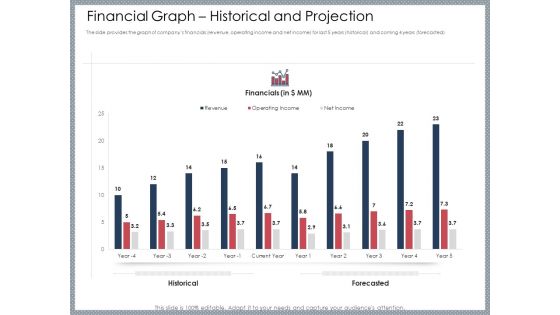
Mezzanine Venture Capital Funding Pitch Deck Financial Graph Historical And Projection Pictures PDF
The slide provides the graph of companys financials revenue operating income and net income for last five years historical and coming four years forecasted. Deliver and pitch your topic in the best possible manner with this mezzanine venture capital funding pitch deck financial graph historical and projection pictures pdf. Use them to share invaluable insights on financial, historical, projection, year, revenue and impress your audience. This template can be altered and modified as per your expectations. So, grab it now.
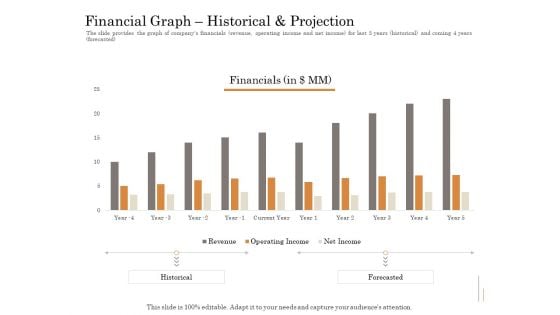
Subordinated Loan Funding Financial Graph Historical And Projection Ppt Model File Formats PDF
The slide provides the graph of companys financials revenue, operating income and net income for last 5 years historical and coming 4 years forecasted. Deliver and pitch your topic in the best possible manner with this subordinated loan funding financial graph historical and projection ppt model file formats pdf. Use them to share invaluable insights on revenue, operating income, net income, current year. and impress your audience. This template can be altered and modified as per your expectations. So, grab it now.
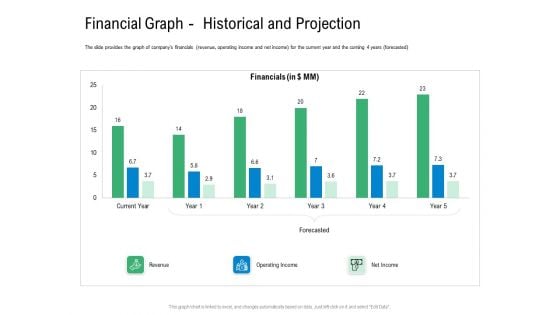
Convertible Preferred Stock Funding Pitch Deck Financial Graph Historical And Projection Themes PDF
The slide provides the graph of companys financials revenue, operating income and net income for the current year and the coming 4 years forecasted. Deliver an awe inspiring pitch with this creative convertible preferred stock funding pitch deck financial graph historical and projection themes pdf bundle. Topics like revenue, operating income, net income can be discussed with this completely editable template. It is available for immediate download depending on the needs and requirements of the user.

Bar Graph Business Growth Success PowerPoint Templates And PowerPoint Themes 0912
Bar Graph Business Growth Success PowerPoint Templates And PowerPoint Themes 0912-Microsoft Powerpoint Templates and Background with bar graph Our Bar Graph Business Growth Success PowerPoint Templates And PowerPoint Themes 0912 are exceptionally customer-centric. They put clients before everything else.
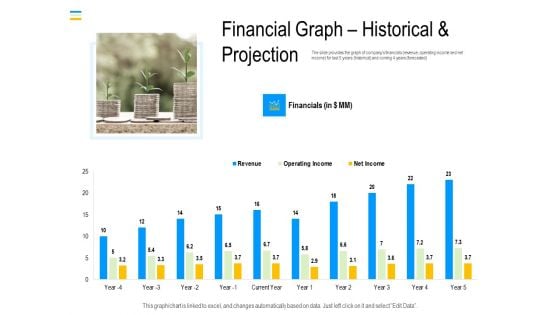
Mezzanine Debt Financing Pitch Deck Financial Graph Historical And Projection Demonstration PDF
The slide provides the graph of companys financials revenue, operating income and net income for last five years historical and coming four years forecasted. Deliver and pitch your topic in the best possible manner with this mezzanine debt financing pitch deck financial graph historical and projection demonstration pdf. Use them to share invaluable insights on financials, revenue, operating income and impress your audience. This template can be altered and modified as per your expectations. So, grab it now.
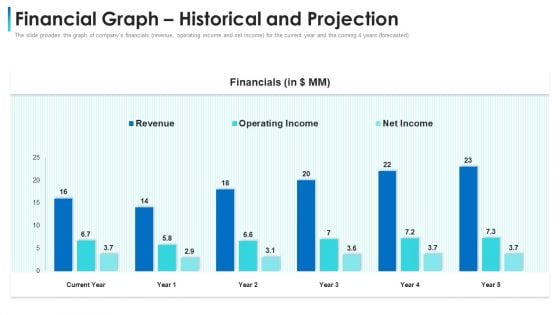
Convertible Bond Financing Pitch Deck Financial Graph Historical And Projection Slides PDF
The slide provides the graph of companys financials revenue, operating income and net income for the current year and the coming 4 years forecasted. Deliver an awe-inspiring pitch with this creative convertible bond financing pitch deck financial graph historical and projection slides pdf bundle. Topics like revenue, operating income, net income, financial can be discussed with this completely editable template. It is available for immediate download depending on the needs and requirements of the user.
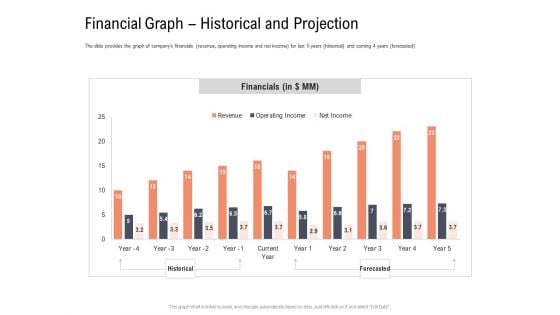
Investor Pitch Deck To Collect Capital From Subordinated Loan Financial Graph Historical And Projection Introduction PDF
The slide provides the graph of companys financials revenue, operating income and net income for last 5 years historical and coming 4 years forecasted. Deliver an awe-inspiring pitch with this creative investor pitch deck to collect capital from subordinated loan financial graph historical and projection introduction pdf bundle. Topics like financials, net income, operating income, revenue, historical, forecasted can be discussed with this completely editable template. It is available for immediate download depending on the needs and requirements of the user.
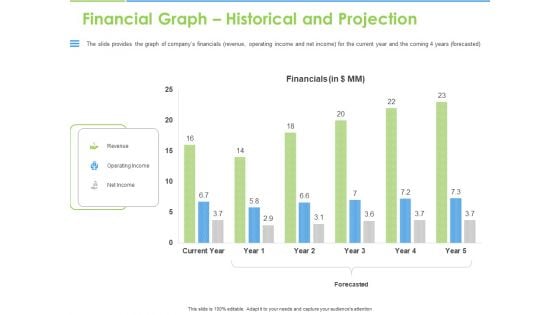
Convertible Bonds Pitch Deck For Increasing Capitals Financial Graph Historical And Projection Elements PDF
The slide provides the graph of companys financials revenue, operating income and net income for the current year and the coming 4 years forecasted. Deliver an awe-inspiring pitch with this creative convertible bonds pitch deck for increasing capitals financial graph historical and projection elements pdf bundle. Topics like revenue, operating income, net income, forecasted, financials, current year can be discussed with this completely editable template. It is available for immediate download depending on the needs and requirements of the user.
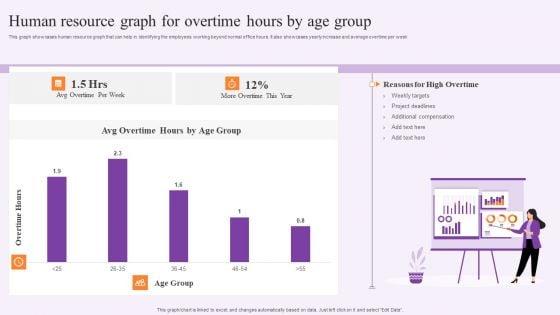
Human Resource Graph For Overtime Hours By Age Group Rules PDF
This graph showcases human resource graph that can help in identifying the employees working beyond normal office hours. It also showcases yearly increase and average overtime per week. Pitch your topic with ease and precision using this Human Resource Graph For Overtime Hours By Age Group Rules PDF. This layout presents information on Weekly Targets, Project Deadlines. It is also available for immediate download and adjustment. So, changes can be made in the color, design, graphics or any other component to create a unique layout.
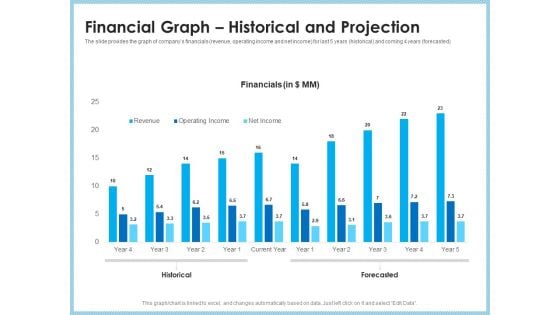
Investment Pitch To Generating Capital From Mezzanine Credit Financial Graph Historical And Projection Microsoft PDF
The slide provides the graph of companys financials revenue, operating income and net income for last 5 years historical and coming 4 years forecasted. Deliver and pitch your topic in the best possible manner with this investment pitch to generating capital from mezzanine credit financial graph historical and projection microsoft pdf. Use them to share invaluable insights on revenue, operating income, net income, current year, historical, forecasted and impress your audience. This template can be altered and modified as per your expectations. So, grab it now.
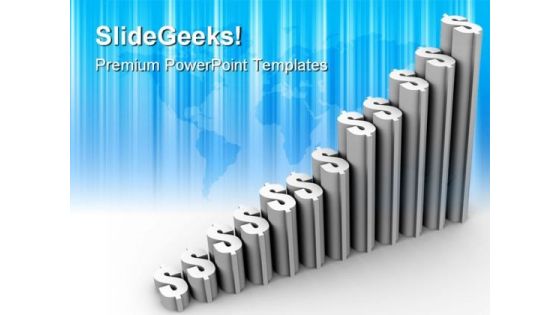
Graph Growth Of Dollars Finance PowerPoint Templates And PowerPoint Backgrounds 0711
Microsoft PowerPoint Template and Background with graph representing growth sign of money Have nothing to fear with our Graph Growth Of Dollars Finance PowerPoint Templates And PowerPoint Backgrounds 0711. Just download, type and present.
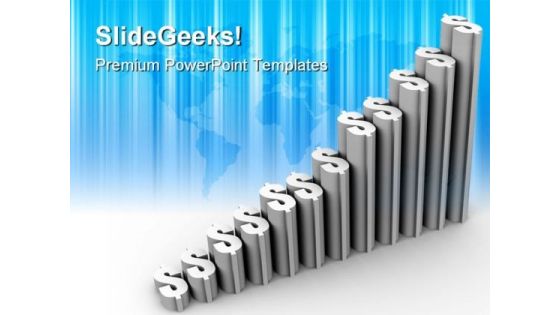
Graph Growth Of Dollars Finance PowerPoint Themes And PowerPoint Slides 0711
Microsoft PowerPoint Theme and Slide with graph representing growth sign of money Invite praises with our Graph Growth Of Dollars Finance PowerPoint Themes And PowerPoint Slides 0711. Make sure your presentation gets the attention it deserves.
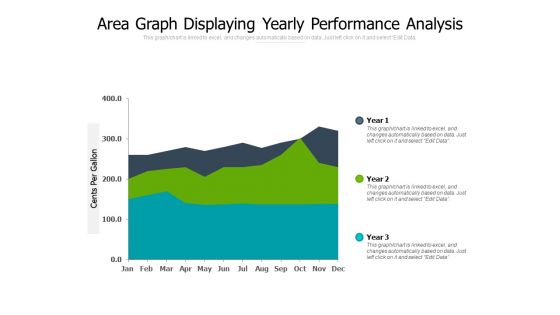
Area Graph Displaying Yearly Performance Analysis Ppt PowerPoint Presentation Slides Diagrams
Presenting this set of slides with name area graph displaying yearly performance analysis ppt powerpoint presentation slides diagrams. The topics discussed in these slide is area graph displaying yearly performance analysis. This is a completely editable PowerPoint presentation and is available for immediate download. Download now and impress your audience.
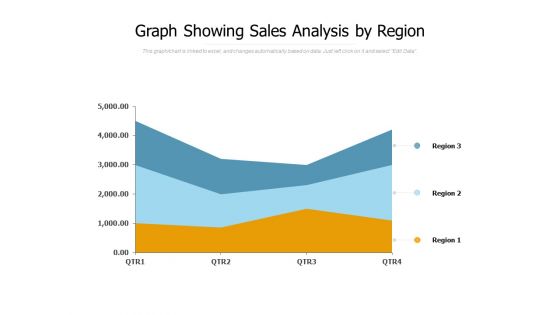
Graph Showing Sales Analysis By Region Ppt PowerPoint Presentation Inspiration Images
Presenting this set of slides with name graph showing sales analysis by region ppt powerpoint presentation inspiration images. The topics discussed in these slide is graph showing sales analysis by region. This is a completely editable PowerPoint presentation and is available for immediate download. Download now and impress your audience.
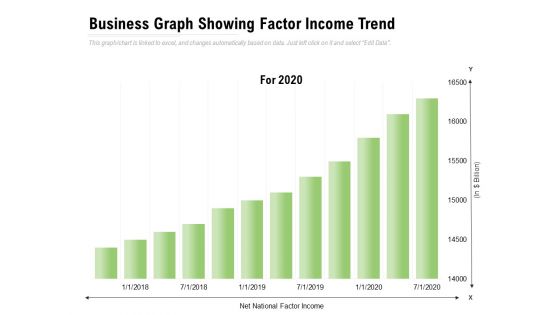
Business Graph Showing Factor Income Trend Ppt PowerPoint Presentation Slides Mockup
Presenting this set of slides with name business graph showing factor income trend ppt powerpoint presentation slides mockup. The topics discussed in these slide is business graph showing factor income trend. This is a completely editable PowerPoint presentation and is available for immediate download. Download now and impress your audience.
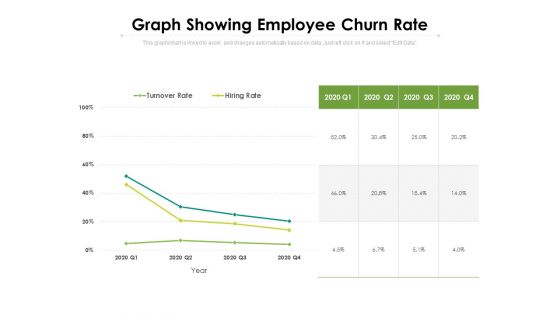
Graph Showing Employee Churn Rate Ppt PowerPoint Presentation Inspiration Portfolio PDF
Presenting this set of slides with name graph showing employee churn rate ppt powerpoint presentation inspiration portfolio pdf. The topics discussed in these slide is graph showing employee churn rate. This is a completely editable PowerPoint presentation and is available for immediate download. Download now and impress your audience.
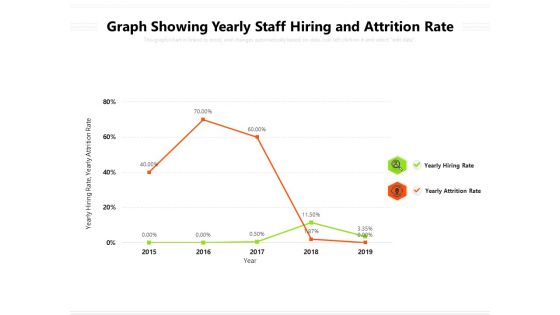
Graph Showing Yearly Staff Hiring And Attrition Rate Ppt PowerPoint Presentation Infographic Template Format Ideas PDF
Presenting this set of slides with name graph showing yearly staff hiring and attrition rate ppt powerpoint presentation infographic template format ideas pdf. The topics discussed in these slide is graph showing yearly staff hiring and attrition rate. This is a completely editable PowerPoint presentation and is available for immediate download. Download now and impress your audience.
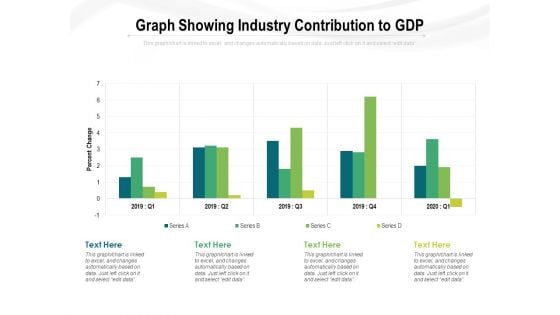
Graph Showing Industry Contribution To GDP Ppt PowerPoint Presentation Show Design Templates PDF
Presenting this set of slides with name graph showing industry contribution to gdp ppt powerpoint presentation show design templates pdf. The topics discussed in these slide is graph showing industry contribution to gdp. This is a completely editable PowerPoint presentation and is available for immediate download. Download now and impress your audience.
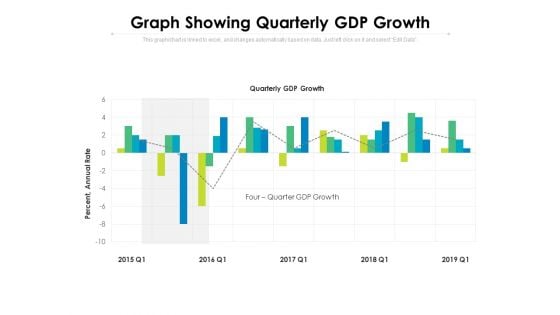
Graph Showing Quarterly GDP Growth Ppt PowerPoint Presentation File Mockup PDF
Presenting this set of slides with name graph showing quarterly gdp growth ppt powerpoint presentation file mockup pdf. The topics discussed in these slides are graph showing quarterly gdp growth, 2015 to 2020. This is a completely editable PowerPoint presentation and is available for immediate download. Download now and impress your audience.


 Continue with Email

 Home
Home


