Business Analysis Icon

Managing Customer Experience CRM Data Analysis Sales Pictures PDF
This graph or chart is linked to excel, and changes automatically based on data. Just left click on it and select Edit Data.Deliver and pitch your topic in the best possible manner with this managing customer experience crm data analysis sales pictures pdf. Use them to share invaluable insights on entities by rep, completed activities l, biz notes this month, phone calls last 3 months, activity last 3 months and impress your audience. This template can be altered and modified as per your expectations. So, grab it now.
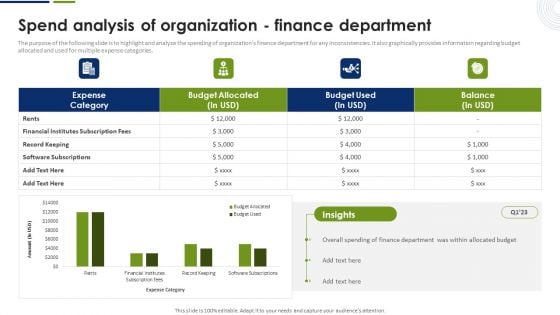
Spend Analysis Of Organization Finance Department Pictures PDF
The purpose of the following slide is to highlight and analyze the spending of organizations finance department for any inconsistencies. It also graphically provides information regarding budget allocated and used for multiple expense categories. The best PPT templates are a great way to save time, energy, and resources. Slidegeeks have 100 percent editable powerpoint slides making them incredibly versatile. With these quality presentation templates, you can create a captivating and memorable presentation by combining visually appealing slides and effectively communicating your message. Download Spend Analysis Of Organization Finance Department Pictures PDF from Slidegeeks and deliver a wonderful presentation.
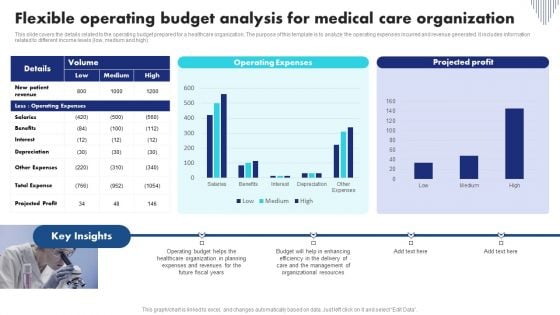
Flexible Operating Budget Analysis For Medical Care Organization Background PDF
This slide covers the details related to the operating budget prepared for a healthcare organization. The purpose of this template is to analyze the operating expenses incurred and revenue generated. It includes information related to different income levels low, medium and high. Pitch your topic with ease and precision using this Flexible Operating Budget Analysis For Medical Care Organization Background PDF. This layout presents information on Organizational Resources, Management, Budget. It is also available for immediate download and adjustment. So, changes can be made in the color, design, graphics or any other component to create a unique layout.
3d Two Stages Of Process Analysis Flow Charting PowerPoint Slides
We present our 3d two stages of process analysis flow charting PowerPoint Slides.Download our Business PowerPoint Templates because like the famed William Tell, they put aside all emotions and concentrate on the target. Use our Competition PowerPoint Templates because it has inspired a whole new world of medical endeavour. Present our Marketing PowerPoint Templates because networking is an imperative in todays world. You need to access the views of others. Similarly you need to give access to them of your abilities. Present our Design PowerPoint Templates because Our Template designs are State of the Art. Download our Metaphor PowerPoint Templates because you can asked to strive to give true form to your great dream.Use these PowerPoint slides for presentations relating to analysis, analyze, background, business, chart, competition, conceptual, corporation, create, data, decision, design, direction, economic, enterprise, future, graph, idea, illustration, information, innovate, layout, management, marketing, paper, plan, process, product, project, science, social, . The prominent colors used in the PowerPoint template are Blue, Gray, Black. Professionals tell us our 3d two stages of process analysis flow charting PowerPoint Slides are designed by professionals The feedback we get is that our create PowerPoint templates and PPT Slides are Elegant. We assure you our 3d two stages of process analysis flow charting PowerPoint Slides are Dazzling. Customers tell us our corporation PowerPoint templates and PPT Slides provide you with a vast range of viable options. Select the appropriate ones and just fill in your text. Presenters tell us our 3d two stages of process analysis flow charting PowerPoint Slides will impress their bosses and teams. People tell us our corporation PowerPoint templates and PPT Slides are Attractive. Examine data with our 3d Two Stages Of Process Analysis Flow Charting PowerPoint Slides. You will come out on top.
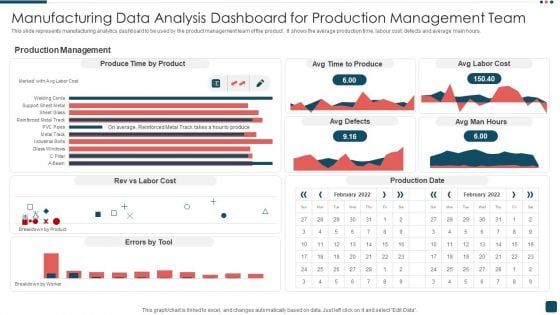
Manufacturing Data Analysis Dashboard For Production Management Team Summary PDF
This slide represents manufacturing analytics dashboard to be used by the product management team of the product . It shows the average production time, labour cost, defects and average main hours. Pitch your topic with ease and precision using this Manufacturing Data Analysis Dashboard For Production Management Team Summary PDF. This layout presents information on Production Management, Product, Cost. It is also available for immediate download and adjustment. So, changes can be made in the color, design, graphics or any other component to create a unique layout.
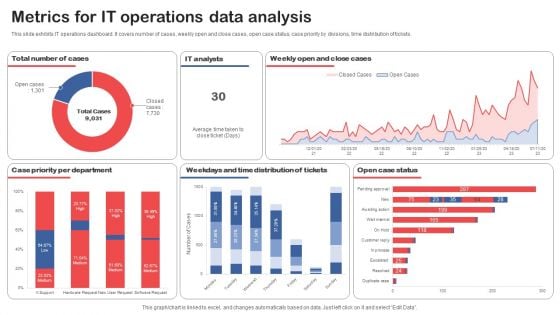
Metrics For IT Operations Data Analysis Topics PDF
This slide exhibits IT operations dashboard. It covers number of cases, weekly open and close cases, open case status, case priority by divisions, time distribution of tickets. Pitch your topic with ease and precision using this Metrics For IT Operations Data Analysis Topics PDF. This layout presents information on Case Priority Per Department, Distribution Of Tickets, Open Case Status. It is also available for immediate download and adjustment. So, changes can be made in the color, design, graphics or any other component to create a unique layout.
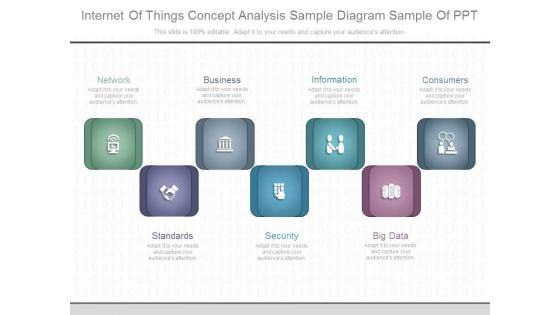
Internet Of Things Concept Analysis Sample Diagram Sample Of Ppt
This is a internet of things concept analysis sample diagram sample of ppt. This is a seven stage process. The stages in this process are network, business, information, consumers, standards, security, big data.
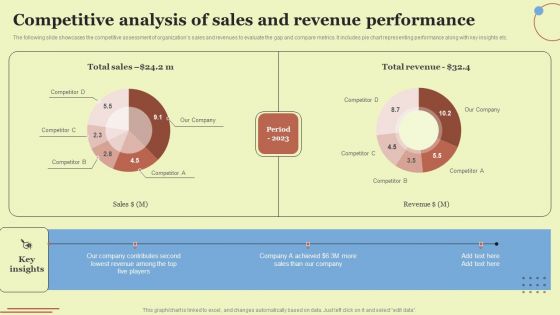
Competitive Analysis Of Sales And Revenue Performance Elements PDF
The following slide showcases the competitive assessment of organizations sales and revenues to evaluate the gap and compare metrics. It includes pie chart representing performance along with key insights etc. Take your projects to the next level with our ultimate collection of Competitive Analysis Of Sales And Revenue Performance Elements PDF. Slidegeeks has designed a range of layouts that are perfect for representing task or activity duration, keeping track of all your deadlines at a glance. Tailor these designs to your exact needs and give them a truly corporate look with your own brand colors they will make your projects stand out from the rest.
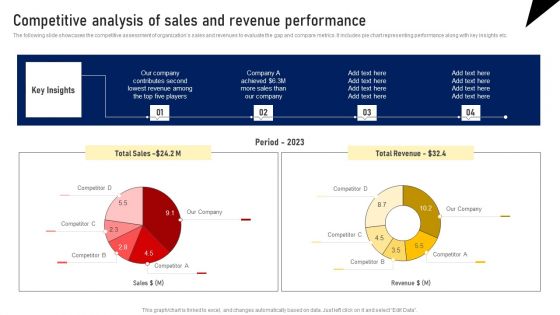
Competitive Analysis Of Sales And Revenue Performance Designs PDF
The following slide showcases the competitive assessment of organizations sales and revenues to evaluate the gap and compare metrics. It includes pie chart representing performance along with key insights etc. Take your projects to the next level with our ultimate collection of Competitive Analysis Of Sales And Revenue Performance Designs PDF. Slidegeeks has designed a range of layouts that are perfect for representing task or activity duration, keeping track of all your deadlines at a glance. Tailor these designs to your exact needs and give them a truly corporate look with your own brand colors they will make your projects stand out from the rest.
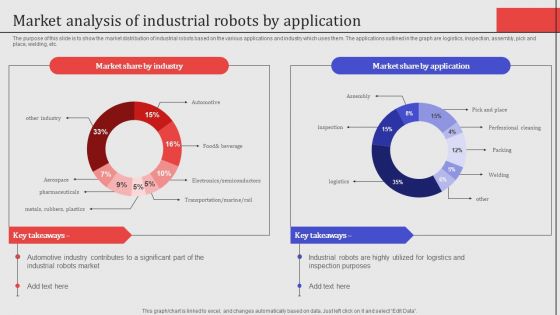
Market Analysis Of Industrial Robots By Application Professional PDF
The purpose of this slide is to show the market distribution of industrial robots based on the various applications and industry which uses them. The applications outlined in the graph are logistics, inspection, assembly, pick and place, welding, etc. Want to ace your presentation in front of a live audience Our Market Analysis Of Industrial Robots By Application Professional PDF can help you do that by engaging all the users towards you.. Slidegeeks experts have put their efforts and expertise into creating these impeccable powerpoint presentations so that you can communicate your ideas clearly. Moreover, all the templates are customizable, and easy-to-edit and downloadable. Use these for both personal and commercial use.
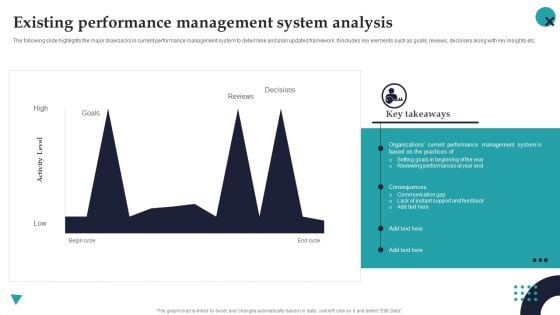
Existing Performance Management System Analysis Employee Performance Management Introduction PDF
The following slide highlights the major drawbacks in current performance management system to determine and plan updated framework. It includes key elements such as goals, reviews, decisions along with key insights etc.If your project calls for a presentation, then Slidegeeks is your go-to partner because we have professionally designed, easy-to-edit templates that are perfect for any presentation. After downloading, you can easily edit Existing Performance Management System Analysis Employee Performance Management Introduction PDF and make the changes accordingly. You can rearrange slides or fill them with different images. Check out all the handy templates
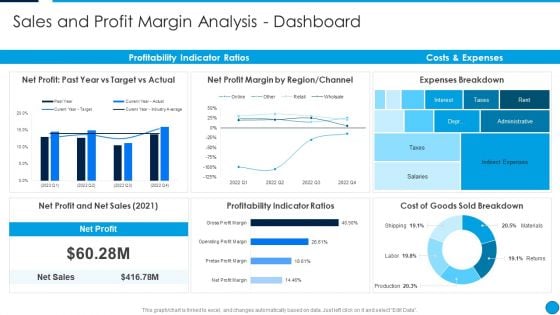
Summary Financial Sales And Profit Margin Analysis Dashboard Pictures PDF
This graph or chart is linked to excel, and changes automatically based on data. Just left click on it and select Edit Data. Deliver an awe inspiring pitch with this creative Summary Financial Sales And Profit Margin Analysis Dashboard Pictures PDF bundle. Topics like Net Profit, Past Year Vs Target Vs Actual, Net Profit Margin By Region, Channel, Expenses Breakdown, Costs And Expenses, Profitability Indicator Ratios can be discussed with this completely editable template. It is available for immediate download depending on the needs and requirements of the user.
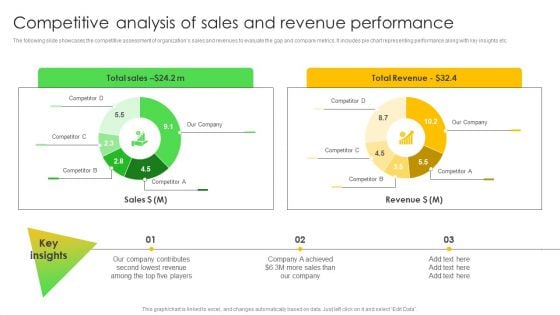
Competitive Analysis Of Sales And Revenue Performance Information PDF
The following slide showcases the competitive assessment of organizations sales and revenues to evaluate the gap and compare metrics. It includes pie chart representing performance along with key insights etc. Slidegeeks is one of the best resources for PowerPoint templates. You can download easily and regulate Competitive Analysis Of Sales And Revenue Performance Information PDF for your personal presentations from our wonderful collection. A few clicks is all it takes to discover and get the most relevant and appropriate templates. Use our Templates to add a unique zing and appeal to your presentation and meetings. All the slides are easy to edit and you can use them even for advertisement purposes.

Our Mission Process Analysis Ppt PowerPoint Presentation Infographics Diagrams
This is a our mission process analysis ppt powerpoint presentation infographics diagrams. This is a one stage process. The stages in this process are our mission, vision, icons, strategy, business.
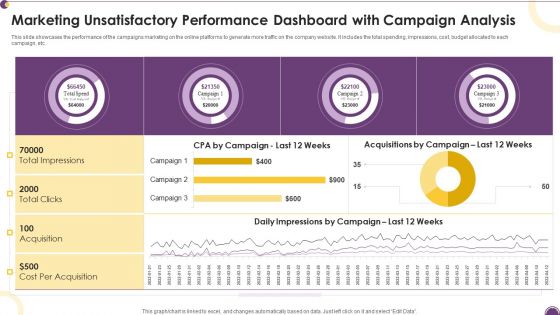
Marketing Unsatisfactory Performance Dashboard With Campaign Analysis Information PDF
This slide showcases the performance of the campaigns marketing on the online platforms to generate more traffic on the company website. It includes the total spending, impressions, cost, budget allocated to each campaign, etc.Pitch your topic with ease and precision using this Marketing Unsatisfactory Performance Dashboard With Campaign Analysis Information PDF. This layout presents information on Cost Acquisition, Total Clicks, Total Impressions. It is also available for immediate download and adjustment. So, changes can be made in the color, design, graphics or any other component to create a unique layout.
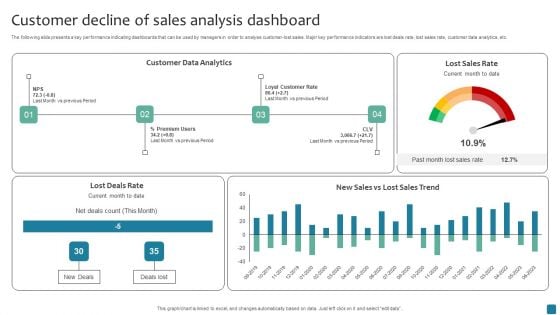
Customer Decline Of Sales Analysis Dashboard Rules PDF
The following slide presents a key performance indicating dashboards that can be used by managers in order to analyse customer-lost sales. Major key performance indicators are lost deals rate, lost sales rate, customer data analytics, etc. Pitch your topic with ease and precision using this Customer Decline Of Sales Analysis Dashboard Rules PDF. This layout presents information on Customer Data Analytics. It is also available for immediate download and adjustment. So, changes can be made in the color, design, graphics or any other component to create a unique layout.
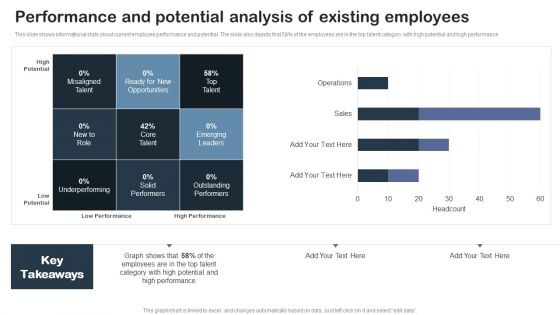
Performance And Potential Analysis Of Existing Employees Designs PDF
This slide shows informational stats about current employee performance and potential. The slide also depicts that 58pecent of the employees are in the top talent category with high potential and high performance .Take your projects to the next level with our ultimate collection of Performance And Potential Analysis Of Existing Employees Designs PDF. Slidegeeks has designed a range of layouts that are perfect for representing task or activity duration, keeping track of all your deadlines at a glance. Tailor these designs to your exact needs and give them a truly corporate look with your own brand colors they all make your projects stand out from the rest.
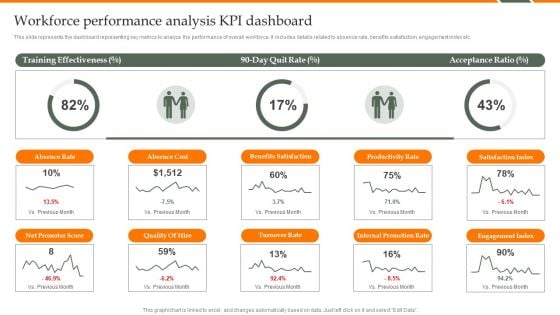
Human Resource Analytics Workforce Performance Analysis KPI Dashboard Structure PDF
This slide represents the dashboard representing key metrics to analyze the performance of overall workforce. It includes details related to absence rate, benefits satisfaction, engagement index etc. Find a pre-designed and impeccable Human Resource Analytics Workforce Performance Analysis KPI Dashboard Structure PDF. The templates can ace your presentation without additional effort. You can download these easy-to-edit presentation templates to make your presentation stand out from others. So, what are you waiting for Download the template from Slidegeeks today and give a unique touch to your presentation.
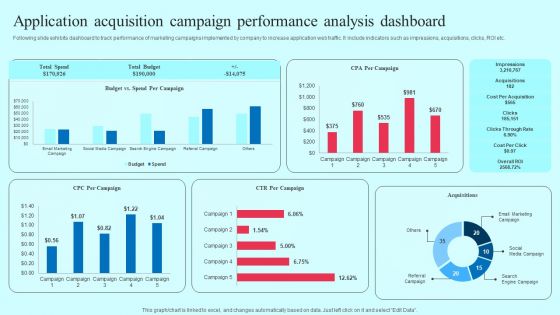
Application Acquisition Campaign Performance Analysis Dashboard Information PDF
Following slide exhibits dashboard to track performance of marketing campaigns implemented by company to increase application web traffic. It include indicators such as impressions, acquisitions, clicks, ROI etc. Find a pre designed and impeccable Application Acquisition Campaign Performance Analysis Dashboard Information PDF. The templates can ace your presentation without additional effort. You can download these easy to edit presentation templates to make your presentation stand out from others. So, what are you waiting for Download the template from Slidegeeks today and give a unique touch to your presentation.
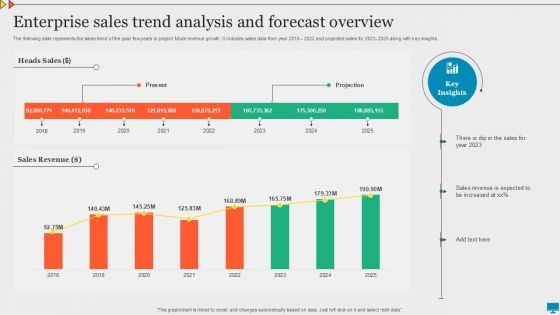
Enterprise Sales Trend Analysis And Forecast Overview Summary PDF
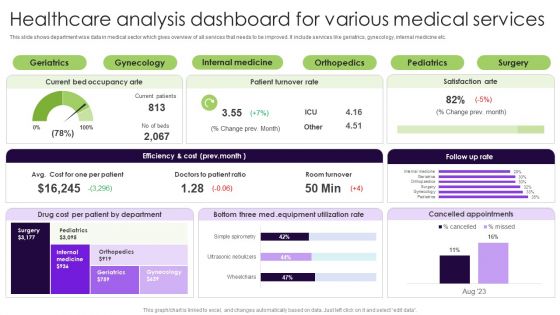
Healthcare Analysis Dashboard For Various Medical Services Ideas PDF
This slide shows department wise data in medical sector which gives overview of all services that needs to be improved. It include services like geriatrics, gynecology, internal medicine etc. Pitch your topic with ease and precision using this Healthcare Analysis Dashboard For Various Medical Services Ideas PDF. This layout presents information on Equipment Utilization Rate, Drug Cost Per Patient, Internal Medicine. It is also available for immediate download and adjustment. So, changes can be made in the color, design, graphics or any other component to create a unique layout.
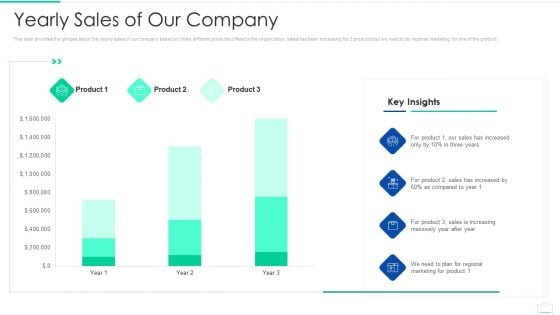
Market Area Analysis Yearly Sales Of Our Company Structure PDF
This slide provides the glimpse about the yearly sales of our company based on three different products offered in the organization, sales has been increasing for 2 products but we need to do regional marketing for one of the product.Deliver and pitch your topic in the best possible manner with this market area analysis yearly sales of our company structure pdf Use them to share invaluable insights on yearly sales of our company and impress your audience. This template can be altered and modified as per your expectations. So, grab it now.

Market Attractiveness Analysis For Merger And Acquisition Designs PDF
Purpose of the following slide is to show the feasibility of cryptocurrency market. It helps the organization in understanding the market attractiveness of market and if the company should proceed with the Merger and acquisition process. It highlights essential parameters such as CAGR, market size etc. Deliver an awe inspiring pitch with this creative Market Attractiveness Analysis For Merger And Acquisition Designs PDF bundle. Topics like Cryptocurrency Market, Cryptocurrency Investments, Opportunity can be discussed with this completely editable template. It is available for immediate download depending on the needs and requirements of the user.
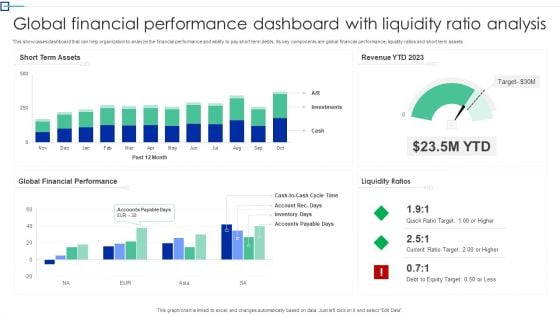
Global Financial Performance Dashboard With Liquidity Ratio Analysis Information PDF
This showcases dashboard that can help organization to analyze the financial performance and ability to pay short term debts. Its key components are global financial performance, liquidity ratios and short term assets. Pitch your topic with ease and precision using this Global Financial Performance Dashboard With Liquidity Ratio Analysis Information PDF. This layout presents information on Short Term Assets, Global Financial Performance, Liquidity Ratios. It is also available for immediate download and adjustment. So, changes can be made in the color, design, graphics or any other component to create a unique layout.
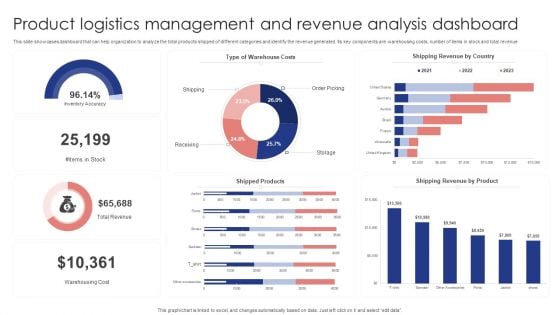
Product Logistics Management And Revenue Analysis Dashboard Demonstration PDF
This slide showcases dashboard that can help organization to analyze the total products shipped of different categories and identify the revenue generated. Its key components are warehousing costs, number of items in stock and total revenue. Pitch your topic with ease and precision using this Product Logistics Management And Revenue Analysis Dashboard Demonstration PDF. This layout presents information on Warehouse Costs, Shipping Revenue Country, Shipped Products . It is also available for immediate download and adjustment. So, changes can be made in the color, design, graphics or any other component to create a unique layout.
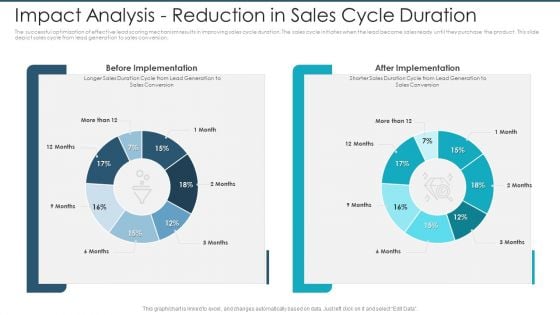
Impact Analysis Reduction In Sales Cycle Duration Infographics PDF
The successful optimization of effective lead scoring mechanism results in improving sales cycle duration. The sales cycle initiates when the lead become sales ready until they purchase the product. This slide depict sales cycle from lead generation to sales conversion.Deliver an awe-inspiring pitch with this creative impact analysis reduction in sales cycle duration infographics pdf. bundle. Topics like before implementation, after implementation can be discussed with this completely editable template. It is available for immediate download depending on the needs and requirements of the user.
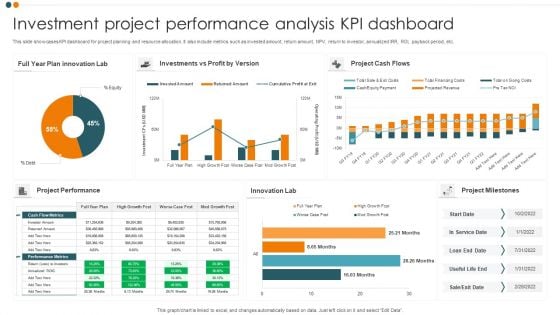
Investment Project Performance Analysis KPI Dashboard Professional PDF
This slide showcases KPI dashboard for project planning and resource allocation. It also include metrics such as invested amount, return amount, NPV, return to investor, annualized IRR, ROI, payback period, etc. Pitch your topic with ease and precision using this Investment Project Performance Analysis KPI Dashboard Professional PDF. This layout presents information on Project Cash Flows, Project Performance, Innovation Lab. It is also available for immediate download and adjustment. So, changes can be made in the color, design, graphics or any other component to create a unique layout.
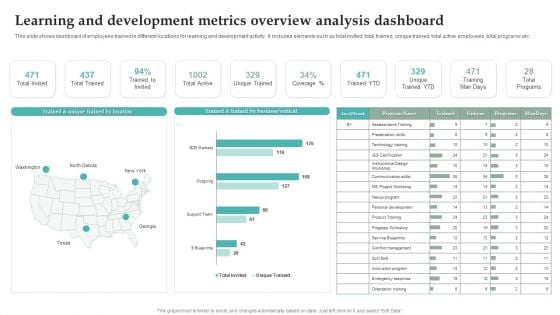
Learning And Development Metrics Overview Analysis Dashboard Graphics PDF
This slide shows dashboard of employees trained in different locations for learning and development activity. It includes elements such as total invited, total trained, unique trained, total active employees, total programs etc. Pitch your topic with ease and precision using this Learning And Development Metrics Overview Analysis Dashboard Graphics PDF. This layout presents information on Unique Trained YTD, Training Man Days, Total Programs. It is also available for immediate download and adjustment. So, changes can be made in the color, design, graphics or any other component to create a unique layout.
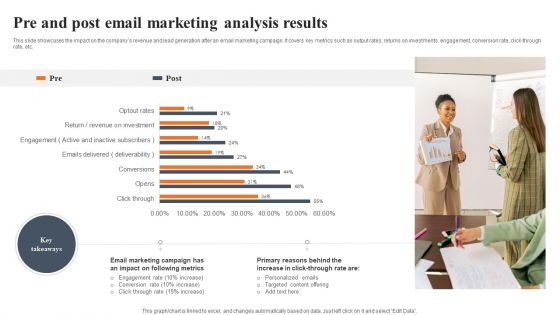
Pre And Post Email Marketing Analysis Results Slides PDF
This slide showcases the impact on the companys revenue and lead generation after an email marketing campaign. It covers key metrics such as output rates, returns on investments, engagement, conversion rate, click through rate, etc. Pitch your topic with ease and precision using this Pre And Post Email Marketing Analysis Results Slides PDF. This layout presents information on Email Marketing Campaign, Following Metrics, Targeted Content Offering. It is also available for immediate download and adjustment. So, changes can be made in the color, design, graphics or any other component to create a unique layout.

Internal Audit Metrics Analysis Dashboard Ppt Ideas Clipart Images PDF
This slide depicts the key performance indicator dashboard and status for internal audit. It includes information related to the audit observations and plan status. Pitch your topic with ease and precision using this Internal Audit Metrics Analysis Dashboard Ppt Ideas Clipart Images PDF. This layout presents information on Quarterly Audit Observations, Financial Year Internal, Audit Plan Status. It is also available for immediate download and adjustment. So, changes can be made in the color, design, graphics or any other component to create a unique layout.
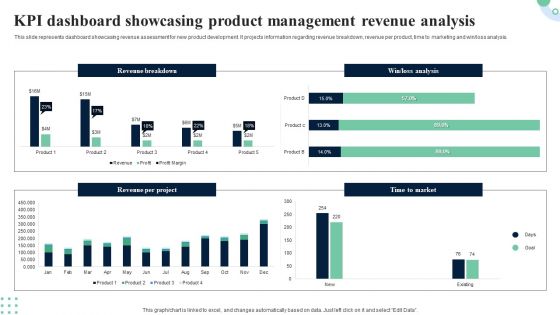
KPI Dashboard Showcasing Product Management Revenue Analysis Portrait PDF
This slide provides dashboard showcasing product development project overview with completion status. It provides information regarding cash flow statements, completion progress, project overview and product approval status. Pitch your topic with ease and precision using this KPI Dashboard Showcasing Product Management Revenue Analysis Portrait PDF. This layout presents information on Completion Progress, Product Approval Status, Cash Flow Statements. It is also available for immediate download and adjustment. So, changes can be made in the color, design, graphics or any other component to create a unique layout.
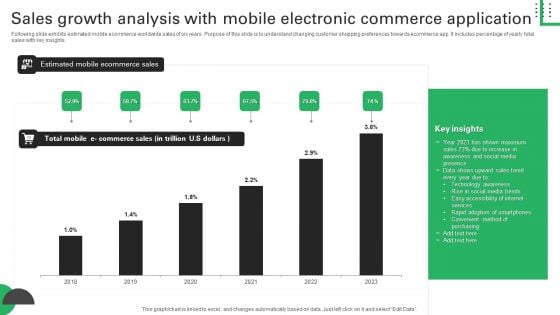
Sales Growth Analysis With Mobile Electronic Commerce Application Structure PDF
Following slide exhibits estimated mobile ecommerce worldwide sales of six years. Purpose of this slide is to understand changing customer shopping preferences towards ecommerce app. It includes percentage of yearly total sales with key insights. Pitch your topic with ease and precision using this Sales Growth Analysis With Mobile Electronic Commerce Application Structure PDF. This layout presents information on Shown Maximum, Awareness Social Media, Accessibility Internet. It is also available for immediate download and adjustment. So, changes can be made in the color, design, graphics or any other component to create a unique layout.
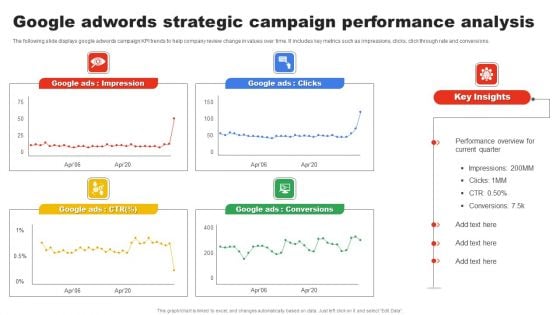
Google Adwords Strategic Campaign Performance Analysis Download PDF
The following slide displays google adwords campaign KPI trends to help company review change in values over time. It includes key metrics such as impressions, clicks, click through rate and conversions. Pitch your topic with ease and precision using this Google Adwords Strategic Campaign Performance Analysis Download PDF. This layout presents information on Google Ads Impression, Google Ads Clicks, Google Ads Conversions. It is also available for immediate download and adjustment. So, changes can be made in the color, design, graphics or any other component to create a unique layout.
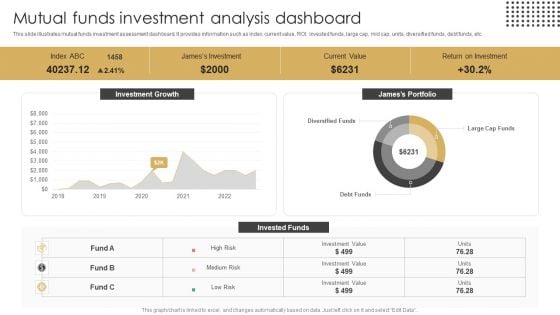
Mutual Funds Investment Analysis Dashboard Ppt Outline Background Images PDF
This slide illustrates mutual funds investment assessment dashboard. It provides information such as index, current value, ROI, invested funds, large cap, mid cap, units, diversified funds, debt funds, etc. Pitch your topic with ease and precision using this Mutual Funds Investment Analysis Dashboard Ppt Outline Background Images PDF. This layout presents information on Current Value, Return On Investment, Jamess Portfolio. It is also available for immediate download and adjustment. So, changes can be made in the color, design, graphics or any other component to create a unique layout.

Monthly Analysis For Actual And Budget Financials Metrics Professional PDF
The following slide shows review report to compare difference in actually spend and planned budget for cost planning in future. It further includes details about maintenance and repairs, supplies, rent, mortgage, etc. Pitch your topic with ease and precision using this Monthly Analysis For Actual And Budget Financials Metrics Professional PDF. This layout presents information on Budget Totals, Expenses, Budget Overview. It is also available for immediate download and adjustment. So, changes can be made in the color, design, graphics or any other component to create a unique layout.
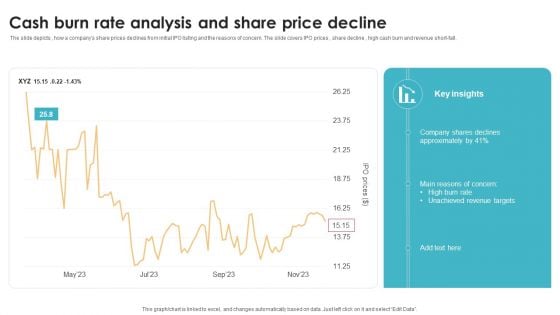
Cash Burn Rate Analysis And Share Price Decline Formats PDF
The slide depicts , how a companys share prices declines from initial IPO listing and the reasons of concern. The slide covers IPO prices , share decline , high cash burn and revenue short-fall. Pitch your topic with ease and precision using this Cash Burn Rate Analysis And Share Price Decline Formats PDF. This layout presents information on Key Insights, Decline, Targets. It is also available for immediate download and adjustment. So, changes can be made in the color, design, graphics or any other component to create a unique layout.
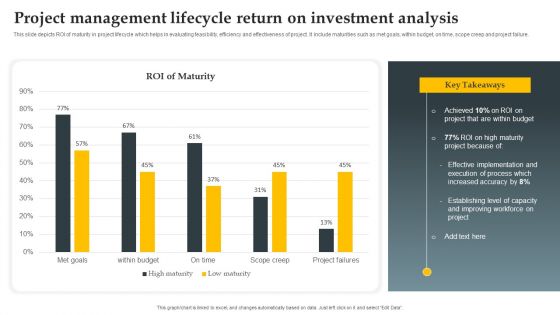
Project Management Lifecycle Return On Investment Analysis Demonstration PDF
This slide depicts ROI of maturity in project lifecycle which helps in evaluating feasibility, efficiency and effectiveness of project. It include maturities such as met goals, within budget, on time, scope creep and project failure. Pitch your topic with ease and precision using this Project Management Lifecycle Return On Investment Analysis Demonstration PDF. This layout presents information on Implementation, Execution Of Process, Budget. It is also available for immediate download and adjustment. So, changes can be made in the color, design, graphics or any other component to create a unique layout.
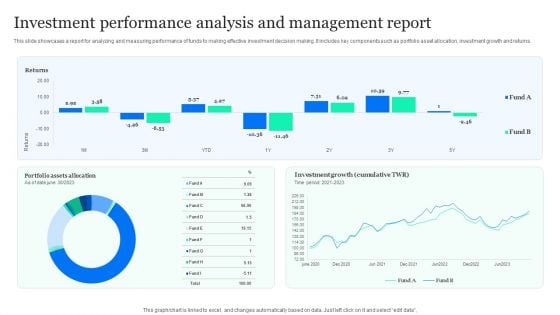
Investment Performance Analysis And Management Report Sample PDF
This slide showcases a report for analyzing and measuring performance of funds to making effective investment decision making. It includes key components such as portfolio asset allocation, investment growth and returns. Pitch your topic with ease and precision using this Investment Performance Analysis And Management Report Sample PDF. This layout presents information on Portfolio Assets Allocation, Investment Growth, Returns. It is also available for immediate download and adjustment. So, changes can be made in the color, design, graphics or any other component to create a unique layout.
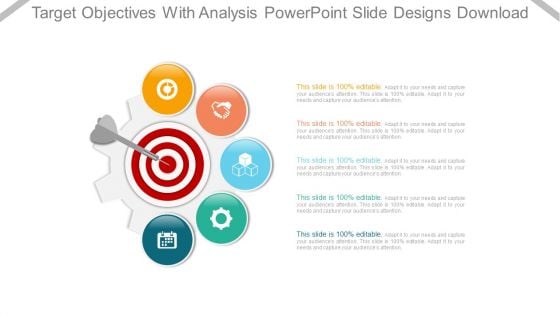
Target Objectives With Analysis Powerpoint Slide Designs Download
This is a target objectives with analysis powerpoint slide designs download. This is a five stage process. The stages in this process are target, success, business, marketing, arrows, icons.
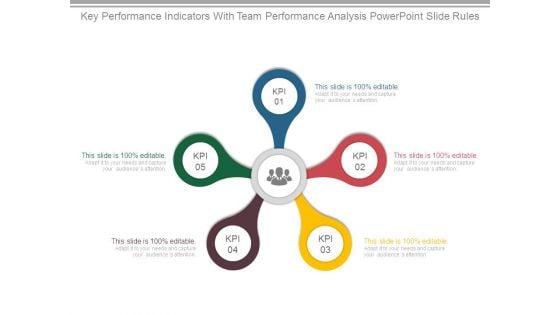
Key Performance Indicators With Team Performance Analysis Powerpoint Slide Rules
This is a key performance indicators with team performance analysis powerpoint slide rules. This is a five stage process. The stages in this process are business, strategy, marketing, success, process, icons.
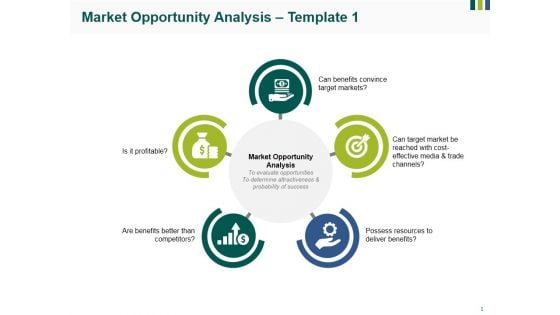
Market Opportunity Analysis Template 1 Ppt PowerPoint Presentation Layouts Slideshow
This is a market opportunity analysis template 1 ppt powerpoint presentation layouts slideshow. This is a five stage process. The stages in this process are business, icons, marketing, strategy, process.
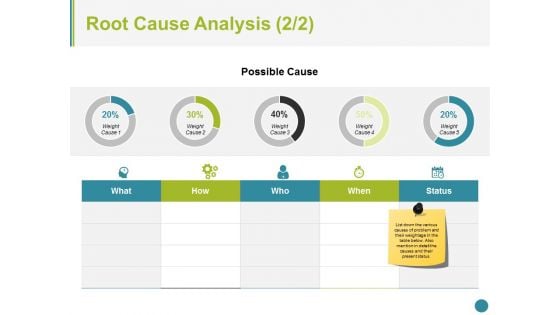
Root Cause Analysis Template 2 Ppt PowerPoint Presentation Styles Graphics
This is a root cause analysis template 2 ppt powerpoint presentation styles graphics. This is a five stage process. The stages in this process are business, icons, marketing, strategy, process.
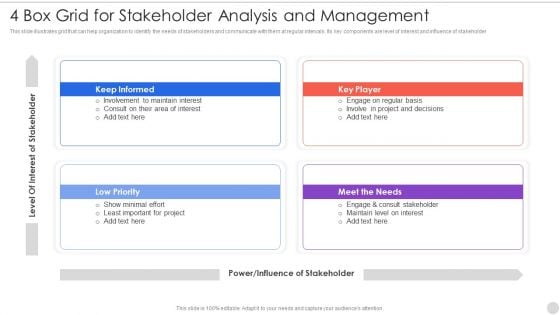
4 Box Grid For Stakeholder Analysis And Management Information PDF
This slide illustrates grid that can help organization to identify the needs of stakeholders and communicate with them at regular intervals. Its key components are level of interest and influence of stakeholder. Presenting 4 box grid for stakeholder analysis and management information pdf to dispense important information. This template comprises four stages. It also presents valuable insights into the topics including keep informed, low priority, meet the needs. This is a completely customizable PowerPoint theme that can be put to use immediately. So, download it and address the topic impactfully.
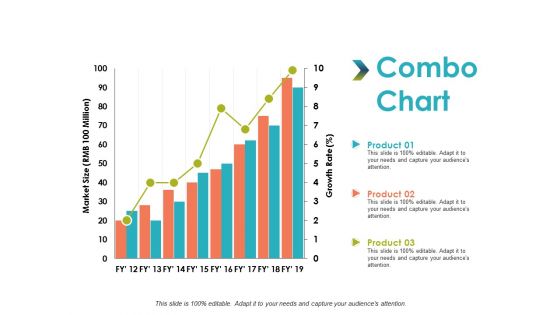
Combo Chart Analysis Management Ppt PowerPoint Presentation Professional Gridlines
This is a combo chart analysis management ppt powerpoint presentation professional gridlines. This is a three stage process. The stages in this process are combo chart, finance, marketing, business, analysis.
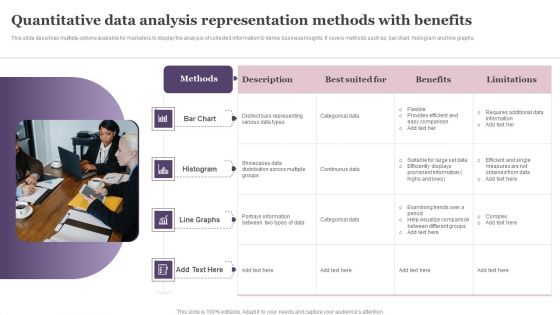
Quantitative Data Analysis Representation Methods With Benefits Template PDF
This slide describes multiple options available for marketers to display the analysis of collected information to derive business insights. It covers methods such as, bar chart, histogram and line graphs. Persuade your audience using this Quantitative Data Analysis Representation Methods With Benefits Template PDF. This PPT design covers four stages, thus making it a great tool to use. It also caters to a variety of topics including Bar Chart, Histogram, Line Graphs. Download this PPT design now to present a convincing pitch that not only emphasizes the topic but also showcases your presentation skills.
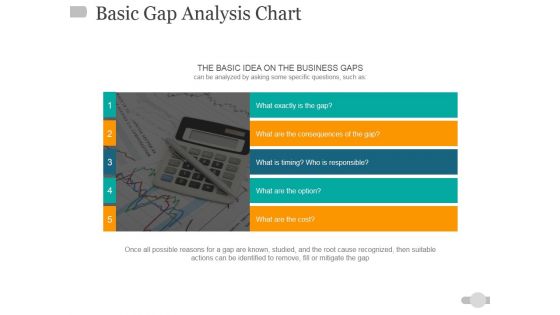
Basic Gap Analysis Chart Ppt PowerPoint Presentation Pictures Design Ideas
This is a basic gap analysis chart ppt powerpoint presentation pictures design ideas. This is a five stage process. The stages in this process are business, finance, marketing, analysis, investment.
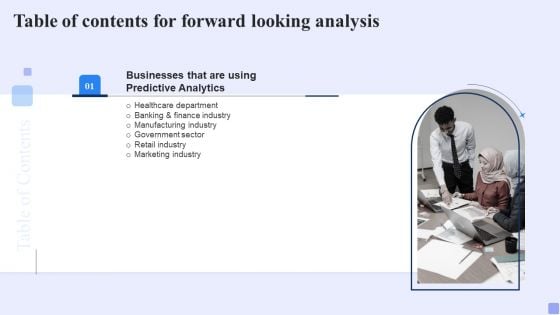
Table Of Contents For Forward Looking Analysis Rules Graphics PDF
Do you know about Slidesgeeks Table Of Contents For Forward Looking Analysis Rules Graphics PDF These are perfect for delivering any kind od presentation. Using it, create PowerPoint presentations that communicate your ideas and engage audiences. Save time and effort by using our pre-designed presentation templates that are perfect for a wide range of topic. Our vast selection of designs covers a range of styles, from creative to business, and are all highly customizable and easy to edit. Download as a PowerPoint template or use them as Google Slides themes.
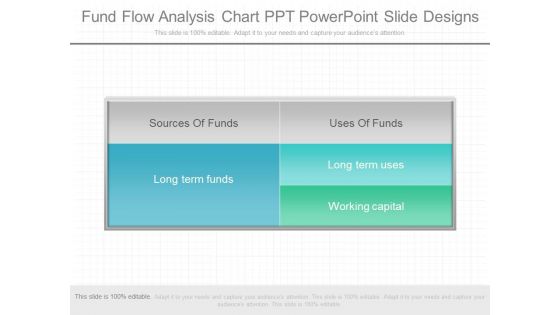
Fund Flow Analysis Chart Ppt Powerpoint Slide Designs
This is a fund flow analysis chart ppt powerpoint slide designs. This is a five stage process. The stages in this process are sources of funds, long term funds, uses of funds, long term uses, working capital.

Break Point Chart For Quality Analysis Powerpoint Slide Show
This is a break point chart for quality analysis powerpoint slide show. This is a one stage process. The stages in this process are total variable costs, fixed costs, quality sold.
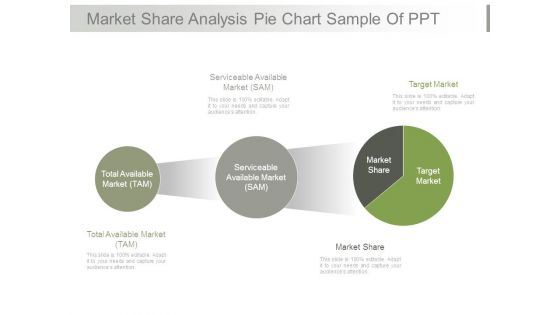
Market Share Analysis Pie Chart Sample Of Ppt
This is a market share analysis pie chart sample of ppt. This is a three stage process. The stages in this process are serviceable available market sam, target market, total available market tam, market share.
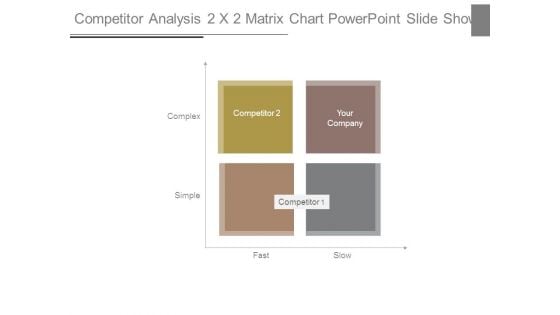
Competitor Analysis 2 X 2 Matrix Chart Powerpoint Slide Show
This is a competitor analysis 2 x 2 matrix chart powerpoint slide show. This is a four stage process. The stages in this process are competitor, your company, competitor, complex, simple, fast, slow.
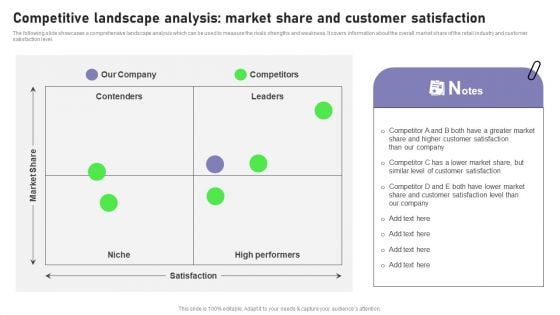
Competitive Landscape Analysis Market Share And Customer Satisfaction Topics PDF
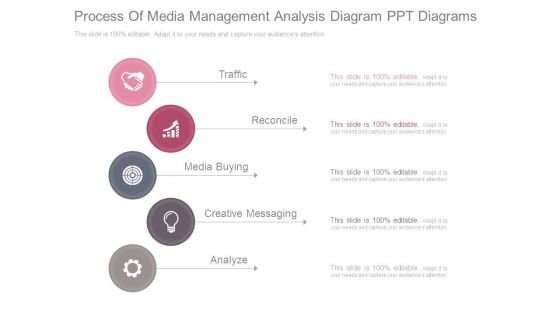
Process Of Media Management Analysis Diagram Ppt Diagrams
This is a process of media management analysis diagram ppt diagrams. This is a five stage process. The stages in this process are traffic, reconcile, media buying, creative messaging, analyze.
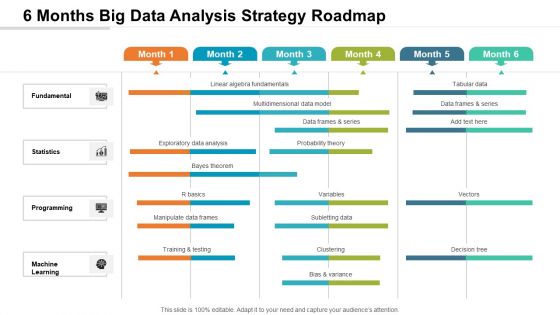
6 Months Big Data Analysis Strategy Roadmap Diagrams
We present our 6 months big data analysis strategy roadmap diagrams. This PowerPoint layout is easy-to-edit so you can change the font size, font type, color, and shape conveniently. In addition to this, the PowerPoint layout is Google Slides compatible, so you can share it with your audience and give them access to edit it. Therefore, download and save this well-researched 6 months big data analysis strategy roadmap diagrams in different formats like PDF, PNG, and JPG to smoothly execute your business plan.
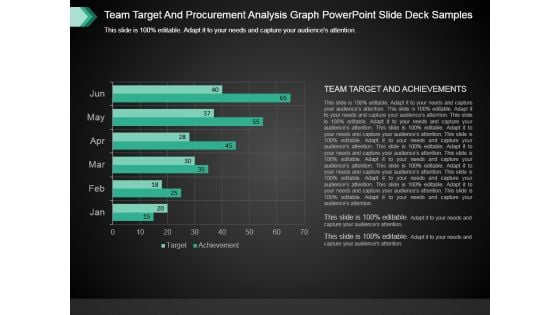
Team Target And Procurement Analysis Graph Powerpoint Slide Deck Samples
This is a team target and procurement analysis graph powerpoint slide deck samples. This is a six stage process. The stages in this process are graph chart, business, success, strategy, management.
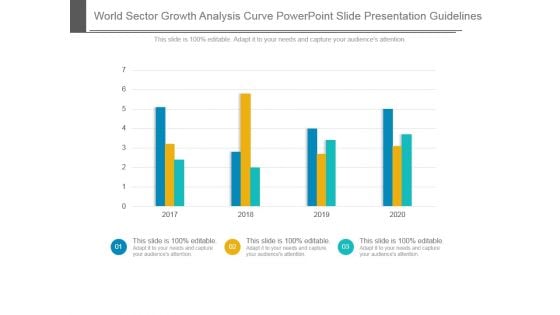
World Sector Growth Analysis Curve Powerpoint Slide Presentation Guidelines
This is a world sector growth analysis curve powerpoint slide presentation guidelines. This is a four stage process. The stages in this process are chart, business, presentation, strategy, presentation.
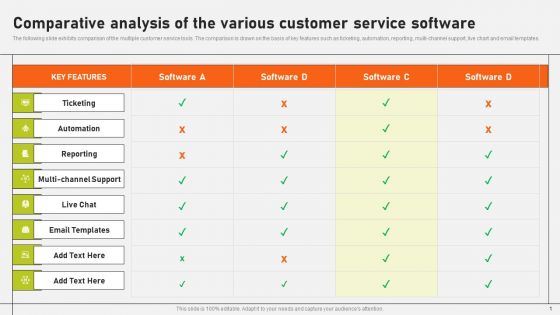
Comparative Analysis Of The Various Customer Service Software Brochure PDF
The following slide exhibits comparison of the multiple customer service tools. The comparison is drawn on the basis of key features such as ticketing, automation, reporting, multi-channel support, live chart and email templates. Boost your pitch with our creative Comparative Analysis Of The Various Customer Service Software Brochure PDF. Deliver an awe inspiring pitch that will mesmerize everyone. Using these presentation templates you will surely catch everyones attention. You can browse the ppts collection on our website. We have researchers who are experts at creating the right content for the templates. So you do not have to invest time in any additional work. Just grab the template now and use them.
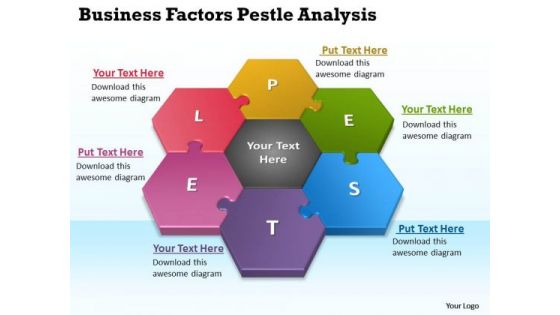
PowerPoint Presentations Process Pestlel Analysis Model Circular Flow Slides
We present our powerpoint presentations process pestlel analysis model Circular Flow Slides.Present our Business PowerPoint Templates because you too have got the framework of your companys growth in place. Download and present our Marketing PowerPoint Templates because colours generate instant reactions in our brains. Use our Shapes PowerPoint Templates because you know your business and have a vision for it. Download our Finance PowerPoint Templates because profit is fairly earned in what you believe. Download our Symbol PowerPoint Templates because presenting your views using our innovative slides, will be assured of leaving a lasting impression.Use these PowerPoint slides for presentations relating to Analysis, Business, Component, Diagram, Direction, Economic, Environmental, Factors, Framework, Graph, Illustration, Law, Leadership, Legal, Macro, Management, Market, Research, Model, Operations, Position, Potential, Research, Scanning, Social, Strategic, , Management, Technology. The prominent colors used in the PowerPoint template are Red, Green, Blue. We assure you our powerpoint presentations process pestlel analysis model Circular Flow Slides are Spectacular. Customers tell us our Diagram PowerPoint templates and PPT Slides are Dazzling. The feedback we get is that our powerpoint presentations process pestlel analysis model Circular Flow Slides are Detailed. We assure you our Direction PowerPoint templates and PPT Slides are Reminiscent. People tell us our powerpoint presentations process pestlel analysis model Circular Flow Slides have awesome images to get your point across. We assure you our Diagram PowerPoint templates and PPT Slides are Colorful. Dwell on your argument with our PowerPoint Presentations Process Pestlel Analysis Model Circular Flow Slides. Your audience will see eye to eye with you.
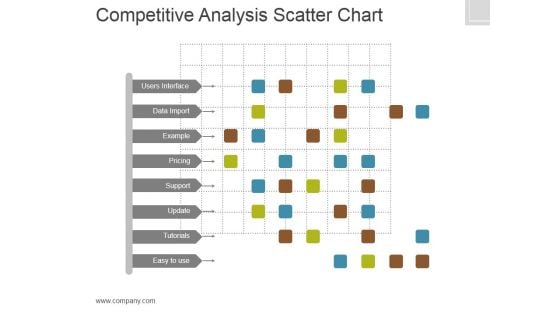
Competitive Analysis Template 6 Scatter Chart Ppt PowerPoint Presentation Slides
This is a competitive analysis template 6 scatter chart ppt powerpoint presentation slides. This is a eight stage process. The stages in this process are users interface, data import, example, pricing, support, update, tutorials, easy to use, table.
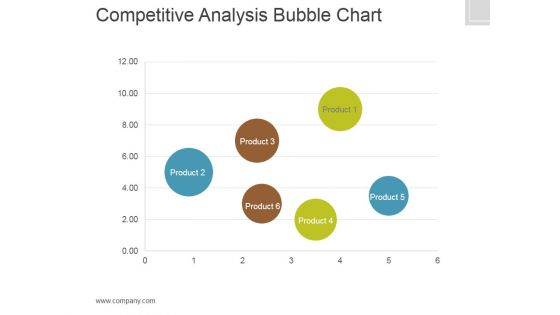
Competitive Analysis Template 7 Bubble Chart Ppt PowerPoint Presentation Deck
This is a competitive analysis template 7 bubble chart ppt powerpoint presentation deck. This is a six stage process. The stages in this process are users interface, data import, example, pricing, support, update, tutorials, easy to use, table.


 Continue with Email

 Home
Home


