Business Analytics Dashboard Diagram
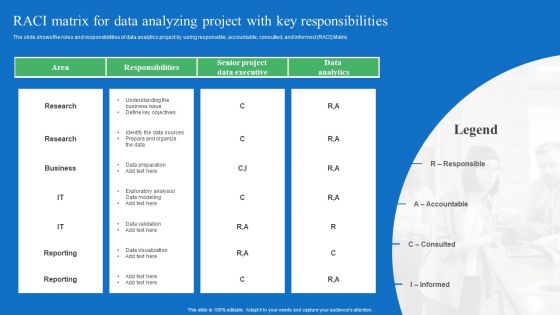
Toolkit For Data Science And Analytics Transition RACI Matrix For Data Analyzing Project With Key Responsibilities Background PDF
The slide shows the roles and responsibilities of data analytics project by using responsible, accountable, consulted, and informed RACI Matrix. Whether you have daily or monthly meetings, a brilliant presentation is necessary. Toolkit For Data Science And Analytics Transition RACI Matrix For Data Analyzing Project With Key Responsibilities Background PDF can be your best option for delivering a presentation. Represent everything in detail using Toolkit For Data Science And Analytics Transition RACI Matrix For Data Analyzing Project With Key Responsibilities Background PDF and make yourself stand out in meetings. The template is versatile and follows a structure that will cater to your requirements. All the templates prepared by Slidegeeks are easy to download and edit. Our research experts have taken care of the corporate themes as well. So, give it a try and see the results.
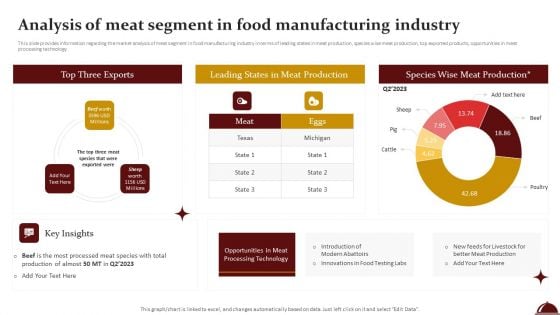
Food Processing Industry Latest Insights Trends And Analytics Analysis Of Meat Segment In Food Manufacturing Industry Inspiration PDF
This slide provides information regarding the market analysis of meat segment in food manufacturing industry in terms of leading states in meat production, species wise meat production, top exported products, opportunities in meat processing technology. Take your projects to the next level with our ultimate collection of Food Processing Industry Latest Insights Trends And Analytics Analysis Of Meat Segment In Food Manufacturing Industry Inspiration PDF. Slidegeeks has designed a range of layouts that are perfect for representing task or activity duration, keeping track of all your deadlines at a glance. Tailor these designs to your exact needs and give them a truly corporate look with your own brand colors they will make your projects stand out from the rest.
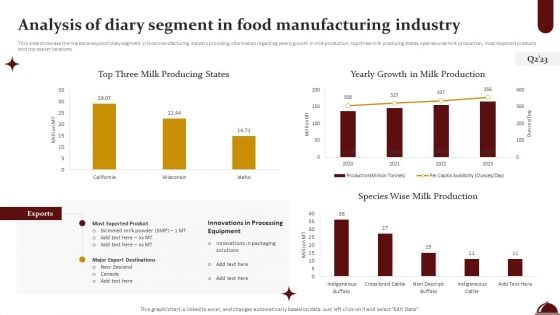
Food Processing Industry Latest Insights Trends And Analytics Analysis Of Diary Segment In Food Manufacturing Industry Mockup PDF
This slide showcase the market analysis of diary segment in food manufacturing industry providing information regarding yearly growth in milk production, top three milk producing states, species wise milk production, most exported products and top export locations. This Food Processing Industry Latest Insights Trends And Analytics Analysis Of Diary Segment In Food Manufacturing Industry Mockup PDF from Slidegeeks makes it easy to present information on your topic with precision. It provides customization options, so you can make changes to the colors, design, graphics, or any other component to create a unique layout. It is also available for immediate download, so you can begin using it right away. Slidegeeks has done good research to ensure that you have everything you need to make your presentation stand out. Make a name out there for a brilliant performance.
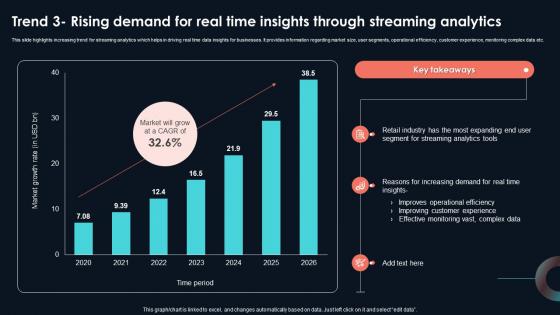
Trend 3 Rising Demand For Real Time Insights Developing Strategic Insights Using Big Data Analytics SS V
This slide highlights increasing trend for streaming analytics which helps in driving real time data insights for businesses. It provides information regarding market size, user segments, operational efficiency, customer experience, monitoring complex data etc. Take your projects to the next level with our ultimate collection of Trend 3 Rising Demand For Real Time Insights Developing Strategic Insights Using Big Data Analytics SS V. Slidegeeks has designed a range of layouts that are perfect for representing task or activity duration, keeping track of all your deadlines at a glance. Tailor these designs to your exact needs and give them a truly corporate look with your own brand colors they will make your projects stand out from the rest This slide highlights increasing trend for streaming analytics which helps in driving real time data insights for businesses. It provides information regarding market size, user segments, operational efficiency, customer experience, monitoring complex data etc.
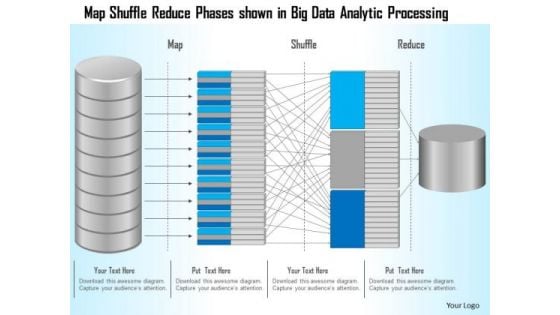
Business Diagram Map Shuffle Reduce Phases Shown In Big Data Analytic Processing Ppt Slide
This technology slide has been designed with graphic of map and data text. This diagram helps to depict concept of data analysis and processing. Use this diagram slide for computer technology related presentations.
Business Diagram Big Data Cloud With Analytic Icons Surrounding It Presentation Template
This PowerPoint template has been designed with graphic of blue colored cloud and various icons in surrounding. This diagram can be used for cloud technology related topics. Explain data sharing on cloud technology with this exclusive business slide.
AI Playbook For Business KPI Dashboard For Tracking Business Performance Demonstration PDF
Mentioned slide portrays KPI dashboard that can be used by organizations to measure their business performance post AI introduction. KPIS covered here are progress, before versus after AI implementation, risks and issues. Deliver and pitch your topic in the best possible manner with this AI Playbook For Business KPI Dashboard For Tracking Business Performance Demonstration PDF. Use them to share invaluable insights on Performance KPIs, Progress, Risk And Issues and impress your audience. This template can be altered and modified as per your expectations. So, grab it now.
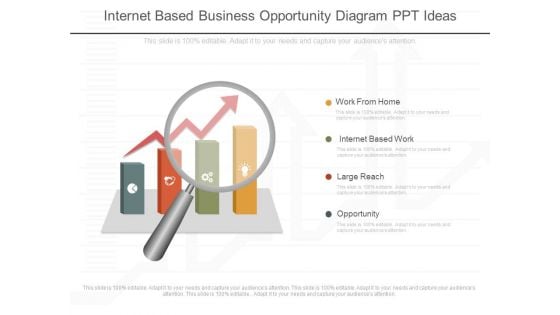
Internet Based Business Opportunity Diagram Ppt Ideas
This is a internet based business opportunity diagram ppt ideas. This is a four stage process. The stages in this process are work from home, internet based work, large reach, opportunity.
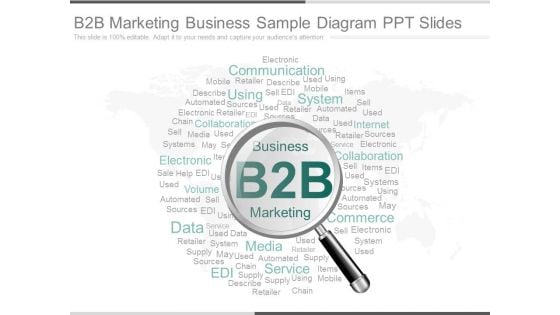
B2b Marketing Business Sample Diagram Ppt Slides
This is a b2b marketing business sample diagram ppt slides. This is a one stage process. The stages in this process are communication, electronic, retailer, mobile, used, system, collaboration, volume, business, b2b, marketing, commerce, media, service, edi, chain, data, internet, sell, automated, may, using.
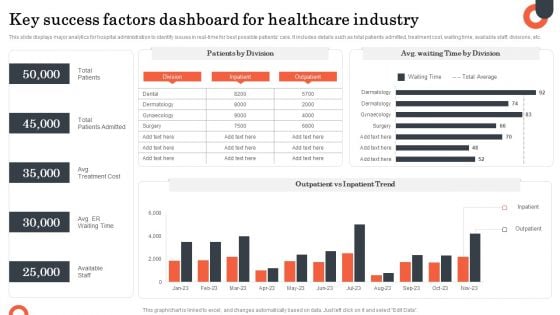
Key Success Factors Dashboard For Healthcare Industry Diagrams PDF
This slide displays major analytics for hospital administration to identify issues in real-time for best possible patients care. It includes details such as total patients admitted, treatment cost, waiting time, available staff, divisions, etc. Showcasing this set of slides titled Key Success Factors Dashboard For Healthcare Industry Diagrams PDF. The topics addressed in these templates are Success Factors, Total Patients, Total Patients Admitted, Available Staff. All the content presented in this PPT design is completely editable. Download it and make adjustments in color, background, font etc. as per your unique business setting.
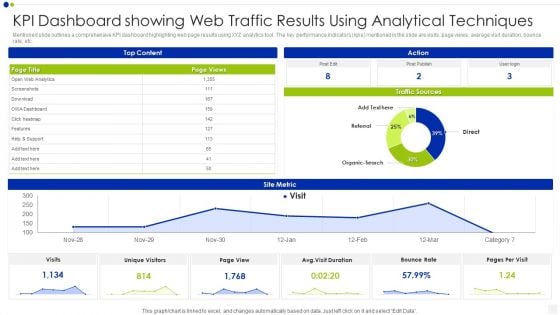
KPI Dashboard Showing Web Traffic Results Using Analytical Techniques Inspiration PDF
Mentioned slide outlines a comprehensive KPI dashboard highlighting web page results using XYZ analytics tool. The key performance indicators kpis mentioned in the slide are visits, page views, average visit duration, bounce rate, etc. Pitch your topic with ease and precision using this kpi dashboard showing web traffic results using analytical techniques inspiration pdf. This layout presents information on bounce rate, traffic sources, analytics. It is also available for immediate download and adjustment. So, changes can be made in the color, design, graphics or any other component to create a unique layout.
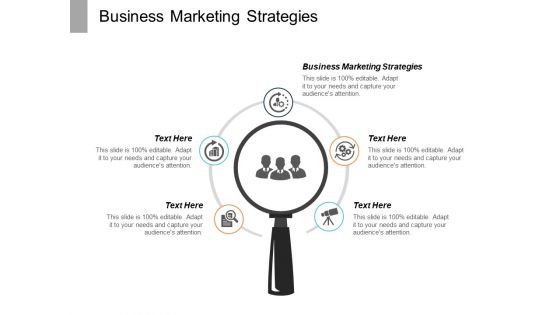
Business Business Marketing Strategies Ppt PowerPoint Presentation Diagram Images Cpb
This is a business business marketing strategies ppt powerpoint presentation diagram images cpb. This is a five stage process. The stages in this process are business business marketing strategies.
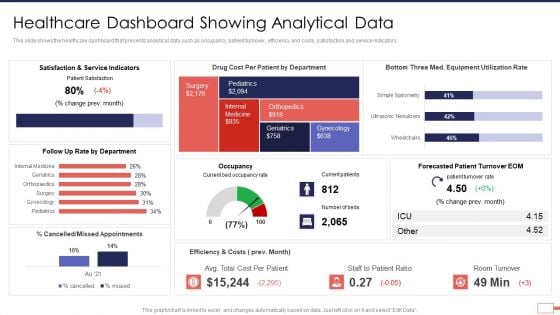
Iot Digital Twin Technology Post Covid Expenditure Management Healthcare Dashboard Showing Analytical Data Brochure PDF
This slide shows the healthcare dashboard that presents analytical data such as occupancy, patient turnover, efficiency and costs, satisfaction and service indicators. Deliver an awe inspiring pitch with this creative iot digital twin technology post covid expenditure management healthcare dashboard showing analytical data brochure pdf bundle. Topics like service, indicators, cost, appointments, turnover can be discussed with this completely editable template. It is available for immediate download depending on the needs and requirements of the user.
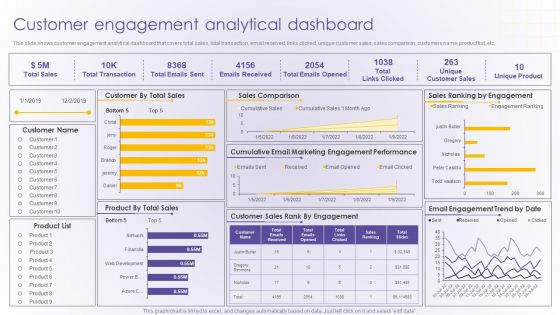
Customer Engagement Analytical Dashboard Developing Online Consumer Engagement Program Professional PDF
This slide shows customer engagement analytical dashboard that covers total sales, total transaction, email received, links clicked, unique customer sales, sales comparison, customers name, product list, etc.Deliver and pitch your topic in the best possible manner with this Customer Engagement Analytical Dashboard Developing Online Consumer Engagement Program Professional PDF. Use them to share invaluable insights on Cumulative Email, Marketing Engagement, Performance and impress your audience. This template can be altered and modified as per your expectations. So, grab it now.
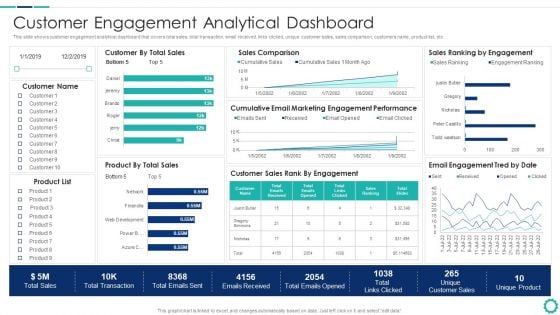
Creating Successful Strategies To Enhance Customer Experience Customer Engagement Analytical Dashboard Slides PDF
This slide shows customer engagement analytical dashboard that covers total sales, total transaction, email received, links clicked, unique customer sales, sales comparison, customers name, product list, etc.Deliver an awe inspiring pitch with this creative Creating Successful Strategies To Enhance Customer Experience Customer Engagement Analytical Dashboard Slides PDF bundle. Topics like Sales Comparison, Engagement Performance, Customer Sales can be discussed with this completely editable template. It is available for immediate download depending on the needs and requirements of the user.

Iot And Digital Twin To Reduce Costs Post Covid Healthcare Dashboard Showing Analytical Data Elements PDF
This slide shows the healthcare dashboard that presents analytical data such as occupancy, patient turnover, efficiency and costs, satisfaction and service indicators. Deliver and pitch your topic in the best possible manner with this iot and digital twin to reduce costs post covid healthcare dashboard showing analytical data elements pdf. Use them to share invaluable insights on occupancy, patient turnover, efficiency and costs, satisfaction and service indicators and impress your audience. This template can be altered and modified as per your expectations. So, grab it now.
Vendor Performance KPI Analytical Dashboard Icon For Data Management Background PDF
Persuade your audience using this Vendor Performance KPI Analytical Dashboard Icon For Data Management Background PDF. This PPT design covers three stages, thus making it a great tool to use. It also caters to a variety of topics including Vendor Performance, KPI Analytical Dashboard, Icon Data Management. Download this PPT design now to present a convincing pitch that not only emphasizes the topic but also showcases your presentation skills.
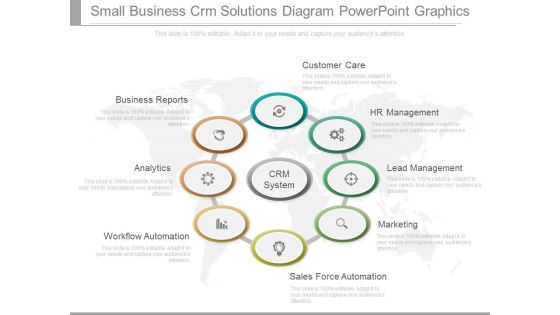
Small Business Crm Solutions Diagram Powerpoint Graphics
This is a small business crm solutions diagram powerpoint graphics. This is a eight stage process. The stages in this process are business reports, analytics, workflow automation, sales force automation, marketing, lead management, hr management, customer care, crm system.
Digital Media Tracking Dashboard Deploying Artificial Intelligence In Business Portrait PDF
This slide covers the digital marketing dashboard along with the lead breakdown, google analytics traffic, and social media channels.Deliver and pitch your topic in the best possible manner with this Digital Media Tracking Dashboard Deploying Artificial Intelligence In Business Portrait PDF. Use them to share invaluable insights on Digital Media, Tracking Dashboard and impress your audience. This template can be altered and modified as per your expectations. So, grab it now.
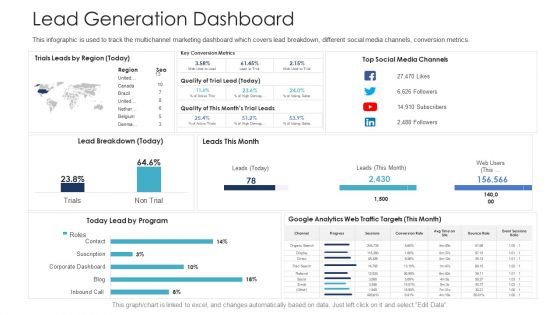
B2C Marketing Initiatives Strategies For Business Lead Generation Dashboard Ppt Styles Styles PDF
This infographic is used to track the multichannel marketing dashboard which covers lead breakdown, different social media channels, conversion metrics. Deliver and pitch your topic in the best possible manner with this B2C marketing initiatives strategies for business lead generation dashboard ppt styles styles pdf. Use them to share invaluable insights on social media channels, lead by program, analytics web traffic targets and impress your audience. This template can be altered and modified as per your expectations. So, grab it now.
Maximizing Business Impact Through ML Digital Media Tracking Dashboard Professional PDF
This slide covers the digital marketing dashboard along with the lead breakdown, google analytics traffic, and social media channels. Slidegeeks has constructed Maximizing Business Impact Through ML Digital Media Tracking Dashboard Professional PDF after conducting extensive research and examination. These presentation templates are constantly being generated and modified based on user preferences and critiques from editors. Here, you will find the most attractive templates for a range of purposes while taking into account ratings and remarks from users regarding the content. This is an excellent jumping-off point to explore our content and will give new users an insight into our top-notch PowerPoint Templates.
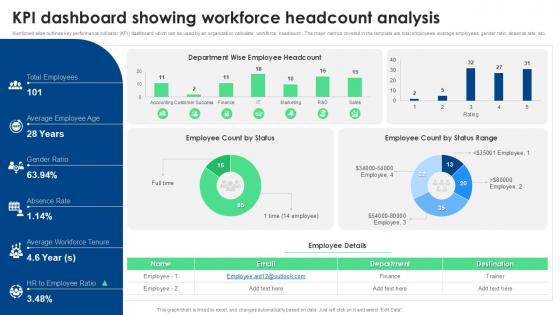
KPI Dashboard Snapshot Showing Workforce Headcount Analysis
From laying roadmaps to briefing everything in detail, our templates are perfect for you. You can set the stage with your presentation slides. All you have to do is download these easy-to-edit and customizable templates. KPI Dashboard Snapshot Showing Workforce Headcount Analysis will help you deliver an outstanding performance that everyone would remember and praise you for. Do download this presentation today. The KPI Dashboard Snapshot Showing Workforce Headcount Analysis is a visually compelling PowerPoint template designed to present key metrics related to workforce composition. It includes dynamic charts and graphs showcasing headcount trends, department breakdowns, gender ratios, and more. This template is perfect for HR teams and executives who need a concise overview of workforce analytics for strategic decision-making and operational efficiency.
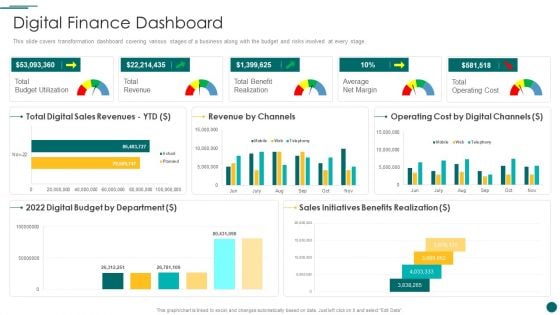
Organization Reinvention Digital Finance Dashboard Clipart PDF
This slide covers the advanced technologies entering the market from past few decades. The combinatorial effects of base technologies, such as mobile, cloud, sensors, analytics and the Internet of Things IoT, are accelerating progress exponentially. This slide covers transformation dashboard covering various stages of a business along with the budget and risks involved at every stage. Deliver and pitch your topic in the best possible manner with this Organization Reinvention Digital Finance Dashboard Clipart PDF. Use them to share invaluable insights on Revenue By Channels, Operating Cost, Digital Budget and impress your audience. This template can be altered and modified as per your expectations. So, grab it now.
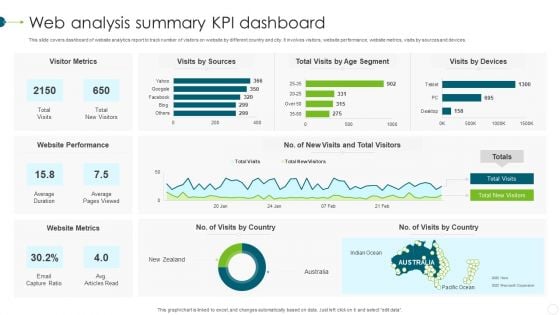
Web Analysis Summary KPI Dashboard Template PDF
This slide covers dashboard of website analytics report to track number of visitors on website by different country and city. It involves visitors, website performance, website metrics, visits by sources and devices. Showcasing this set of slides titled Web Analysis Summary KPI Dashboard Template PDF. The topics addressed in these templates are Website Metrics, Website Performance, Visitor Metrics. All the content presented in this PPT design is completely editable. Download it and make adjustments in color, background, font etc. as per your unique business setting.
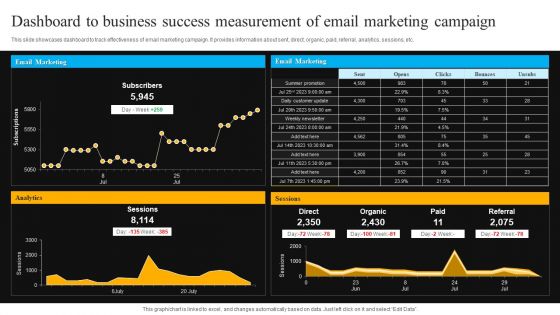
Dashboard To Business Success Measurement Of Email Marketing Campaign Professional PDF
This slide showcases dashboard to track effectiveness of email marketing campaign. It provides information about sent, direct, organic, paid, referral, analytics, sessions, etc. Pitch your topic with ease and precision using this Dashboard To Business Success Measurement Of Email Marketing Campaign Professional PDF. This layout presents information on Email Marketing, Analytics, Sessions. It is also available for immediate download and adjustment. So, changes can be made in the color, design, graphics or any other component to create a unique layout.
Artificial Intelligence For IT Operations Playbook KPI Dashboard For Tracking Business Performance Slides PDF
Mentioned slide portrays KPI dashboard that can be used by organizations to measure their business performance post AI introduction. KPIS covered here are progress, Before versus After AI Implementation, risks issues.Deliver an awe inspiring pitch with this creative Artificial Intelligence For IT Operations Playbook KPI Dashboard For Tracking Business Performance Slides PDF bundle. Topics like Kpi Dashboard, Tracking Business, Performance can be discussed with this completely editable template. It is available for immediate download depending on the needs and requirements of the user.
Artificial Intelligence Playbook Kpi Dashboard For Tracking Business Performance Formats PDF
Mentioned slide portrays KPI dashboard that can be used by organizations to measure their business performance post AI introduction. KPIS covered here are progress, Before versus After AI Implementation, risks and issues. Deliver an awe inspiring pitch with this creative artificial intelligence playbook kpi dashboard for tracking business performance formats pdf bundle. Topics like performance kpis, progress, risk and issues can be discussed with this completely editable template. It is available for immediate download depending on the needs and requirements of the user.
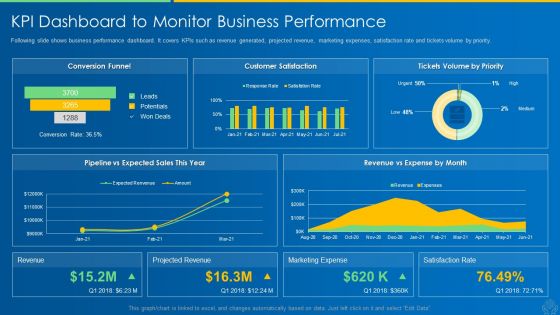
AI And ML Driving Monetary Value For Organization KPI Dashboard To Monitor Business Performance Graphics PDF
Following slide shows business performance dashboard. It covers KPIs such as revenue generated, projected revenue, marketing expenses, satisfaction rate and tickets volume by priority. Deliver and pitch your topic in the best possible manner with this ai and ml driving monetary value for organization kpi dashboard to monitor business performance graphics pdf. Use them to share invaluable insights on business offerings, current impact, product innovations, customer service and impress your audience. This template can be altered and modified as per your expectations. So, grab it now.
Artificial Intelligence Transformation Playbook Kpi Dashboard For Tracking Business Performance Designs PDF
Mentioned slide portrays KPI dashboard that can be used by organizations to measure their business performance post AI introduction. KPIS covered here are progress, Before versus After AI Implementation, risks and issues. Deliver an awe inspiring pitch with this creative artificial intelligence transformation playbook kpi dashboard for tracking business performance designs pdf bundle. Topics like risk and issues, progress, performance kpis, before versus after all implementation can be discussed with this completely editable template. It is available for immediate download depending on the needs and requirements of the user.
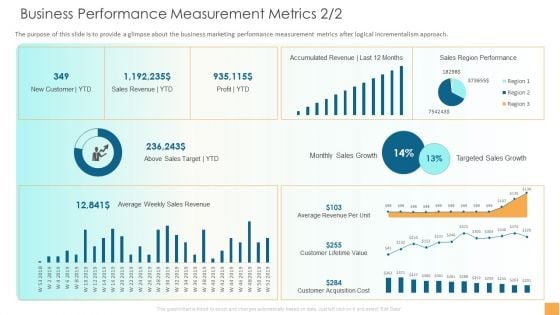
Analytical Incrementalism Business Performance Measurement Metrics Sales Infographics PDF
The purpose of this slide is to provide a glimpse about the business marketing performance measurement metrics after logical incrementalism approach. Deliver an awe-inspiring pitch with this creative analytical incrementalism business performance measurement metrics sales infographics pdf bundle. Topics like gross profit margin, revenue, quick ratio can be discussed with this completely editable template. It is available for immediate download depending on the needs and requirements of the user.
Dashboards Analytical Methods Ppt PowerPoint Presentation Summary Icon Cpb Pdf
Presenting this set of slides with name dashboards analytical methods ppt powerpoint presentation summary icon cpb pdf. This is an editable Powerpoint five stages graphic that deals with topics like dashboards analytical methods to help convey your message better graphically. This product is a premium product available for immediate download and is 100 percent editable in Powerpoint. Download this now and use it in your presentations to impress your audience.
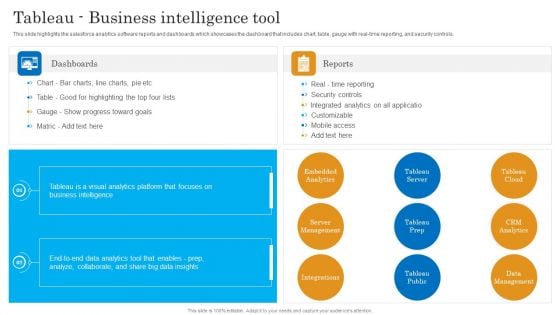
Tableau Business Intelligence Tool Salesforce Business Profile Diagrams PDF
This slide highlights the salesforce analytics software reports and dashboards which showcases the dashboard that includes chart, table, gauge with real-time reporting, and security controls. Deliver an awe inspiring pitch with this creative Tableau Business Intelligence Tool Salesforce Business Profile Diagrams PDF bundle. Topics like Server Management, Embedded Analytics, Security Controls can be discussed with this completely editable template. It is available for immediate download depending on the needs and requirements of the user.
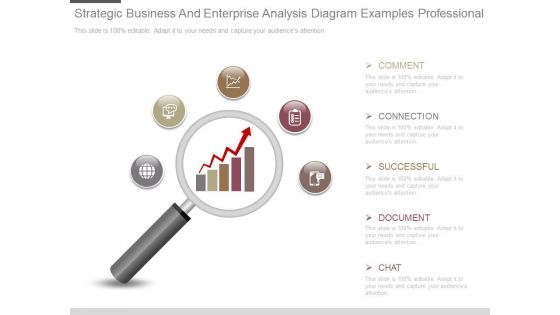
Strategic Business And Enterprise Analysis Diagram Examples Professional
This is a strategic business and enterprise analysis diagram examples professional. This is a five stage process. The stages in this process are comment, connection, successful, document, chat.\n\n\n\n\n\n\n\n
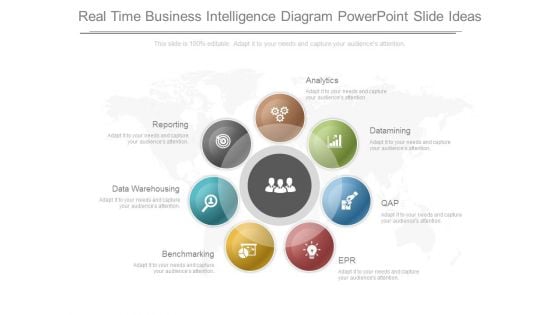
Real Time Business Intelligence Diagram Powerpoint Slide Ideas
This is a real time business intelligence diagram powerpoint slide ideas. This is a seven stage process. The stages in this process are data warehousing, reporting, analytics, datamining, qap, epr, benchmarking.
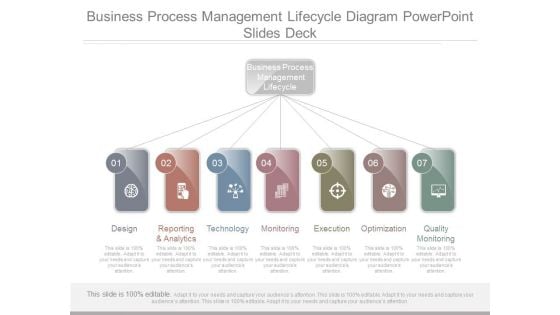
Business Process Management Lifecycle Diagram Powerpoint Slides Deck
This is a business process management lifecycle diagram powerpoint slides deck. This is a seven stage process. The stages in this process are business process management lifecycle, design, reporting and analytics, technology, monitoring, execution, optimization, quality monitoring.
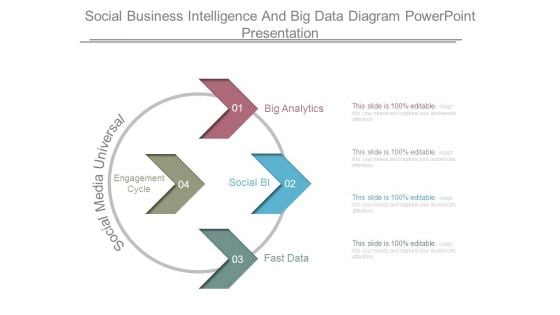
Social Business Intelligence And Big Data Diagram Powerpoint Presentation
This is a social business intelligence and big data diagram powerpoint presentation. This is a four stage process. The stages in this process are big analytics, social bi, fast data, social media universal, engagement cycle.
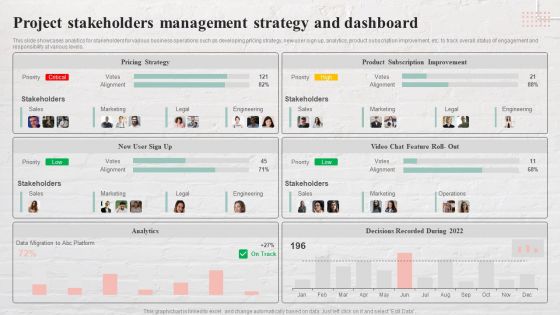
Project Stakeholders Management Strategy And Dashboard Sample PDF
This slide showcases analytics for stakeholders for various business operations such as developing pricing strategy, new user sign up, analytics, product subscription improvement, etc. to track overall status of engagement and responsibility at various levels. Pitch your topic with ease and precision using this Project Stakeholders Management Strategy And Dashboard Sample PDF. This layout presents information on Pricing Strategy, Product Subscription Improvement. It is also available for immediate download and adjustment. So, changes can be made in the color, design, graphics or any other component to create a unique layout.
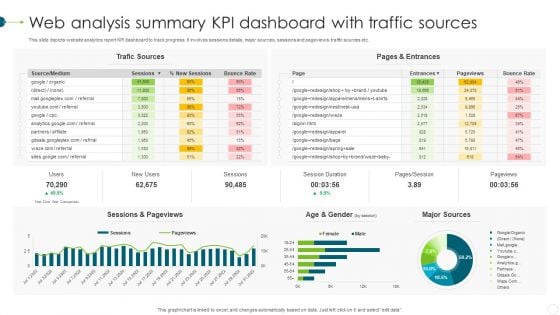
Web Analysis Summary KPI Dashboard With Traffic Sources Portrait PDF
This slide depicts website analytics report KPI dashboard to track progress. It involves sessions details, major sources, sessions and pageviews, traffic sources etc. Showcasing this set of slides titled Web Analysis Summary KPI Dashboard With Traffic Sources Portrait PDF. The topics addressed in these templates are Web Analysis Summary, KPI Dashboard, Traffic Sources. All the content presented in this PPT design is completely editable. Download it and make adjustments in color, background, font etc. as per your unique business setting.
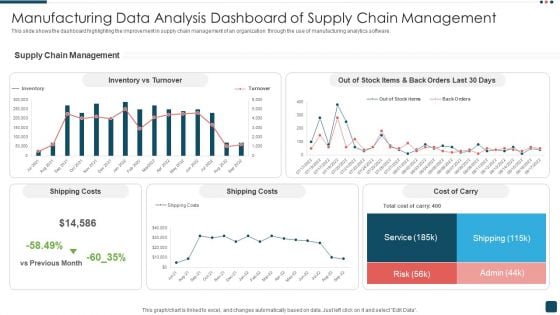
Manufacturing Data Analysis Dashboard Of Supply Chain Management Background PDF
This slide shows the dashboard highlighting the improvement in supply chain management of an organization through the use of manufacturing analytics software. Showcasing this set of slides titled Manufacturing Data Analysis Dashboard Of Supply Chain Management Background PDF. The topics addressed in these templates are Shipping Costs, Service, Risk. All the content presented in this PPT design is completely editable. Download it and make adjustments in color, background, font etc. as per your unique business setting.
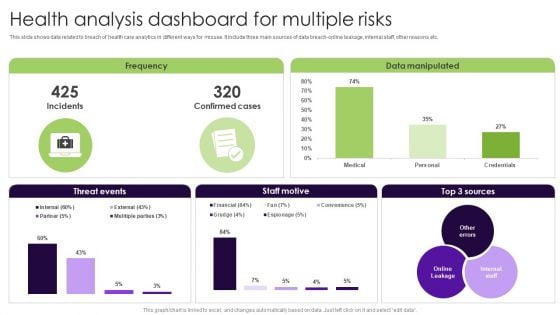
Health Analysis Dashboard For Multiple Risks Elements PDF
This slide shows data related to breach of health care analytics in different ways for misuse. It include three main sources of data breach-online leakage, internal staff, other reasons etc. Showcasing this set of slides titled Health Analysis Dashboard For Multiple Risks Elements PDF. The topics addressed in these templates are Health Analysis Dashboard, Multiple Risks. All the content presented in this PPT design is completely editable. Download it and make adjustments in color, background, font etc. as per your unique business setting.
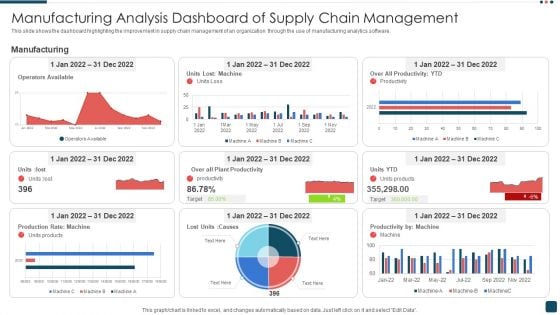
Manufacturing Analysis Dashboard Of Supply Chain Management Formats PDF
This slide shows the dashboard highlighting the improvement in supply chain management of an organization through the use of manufacturing analytics software. Showcasing this set of slides titled Manufacturing Analysis Dashboard Of Supply Chain Management Formats PDF. The topics addressed in these templates are Plant Productivity, Operators Available, Manufacturing. All the content presented in this PPT design is completely editable. Download it and make adjustments in color, background, font etc. as per your unique business setting.
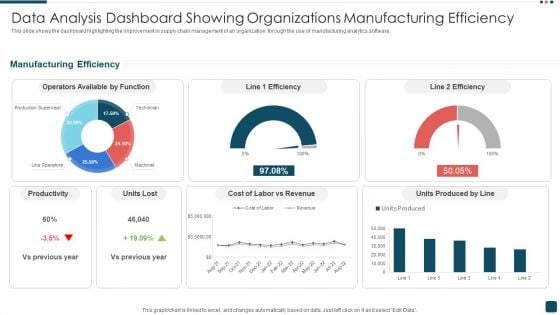
Data Analysis Dashboard Showing Organizations Manufacturing Efficiency Demonstration PDF
This slide shows the dashboard highlighting the improvement in supply chain management of an organization through the use of manufacturing analytics software. Pitch your topic with ease and precision using this Data Analysis Dashboard Showing Organizations Manufacturing Efficiency Demonstration PDF. This layout presents information on Productivity, Revenue, Manufacturing Efficiency. It is also available for immediate download and adjustment. So, changes can be made in the color, design, graphics or any other component to create a unique layout.
Digital Media Tracking Dashboard AI For Brand Administration Template PDF
This slide covers the digital marketing dashboard along with the lead breakdown, google analytics traffic, and social media channels.From laying roadmaps to briefing everything in detail, our templates are perfect for you. You can set the stage with your presentation slides. All you have to do is download these easy-to-edit and customizable templates. Digital Media Tracking Dashboard AI For Brand Administration Template PDF will help you deliver an outstanding performance that everyone would remember and praise you for. Do download this presentation today.
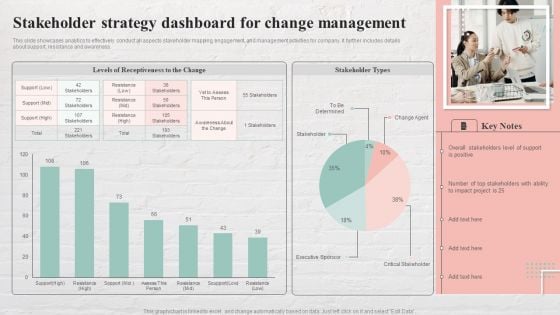
Stakeholder Strategy Dashboard For Change Management Brochure PDF
This slide showcases analytics to effectively conduct all aspects stakeholder mapping, engagement, and management activities for company. It further includes details about support, resistance and awareness. Showcasing this set of slides titled Stakeholder Strategy Dashboard For Change Management Brochure PDF. The topics addressed in these templates are Level Of Support, Stakeholders With Ability. All the content presented in this PPT design is completely editable. Download it and make adjustments in color, background, font etc. as per your unique business setting.
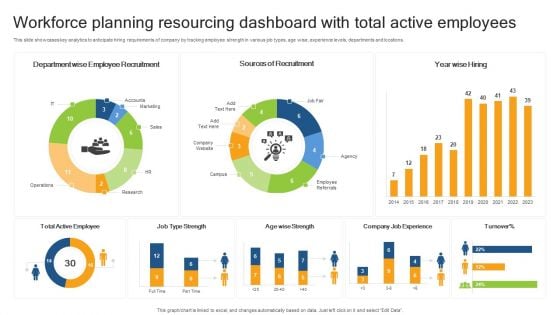
Workforce Planning Resourcing Dashboard With Total Active Employees Rules PDF
This slide showcases key analytics to anticipate hiring requirements of company by tracking employee strength in various job types, age wise, experience levels, departments and locations. Showcasing this set of slides titled Workforce Planning Resourcing Dashboard With Total Active Employees Rules PDF. The topics addressed in these templates are Employee Recruitment, Sources Recruitment, Active Employee . All the content presented in this PPT design is completely editable. Download it and make adjustments in color, background, font etc. as per your unique business setting.
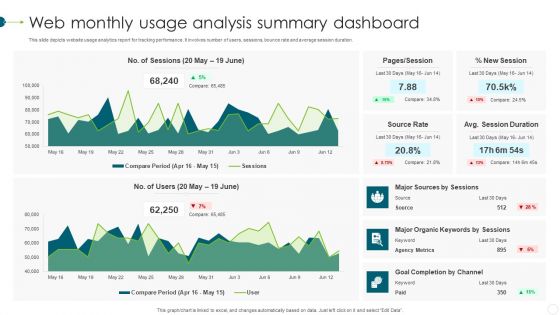
Web Monthly Usage Analysis Summary Dashboard Clipart PDF
This slide depicts website usage analytics report for tracking performance. It involves number of users, sessions, bounce rate and average session duration. Pitch your topic with ease and precision using this Web Monthly Usage Analysis Summary Dashboard Clipart PDF. This layout presents information on Agency Metrics, Source Rate, Goal. It is also available for immediate download and adjustment. So, changes can be made in the color, design, graphics or any other component to create a unique layout.
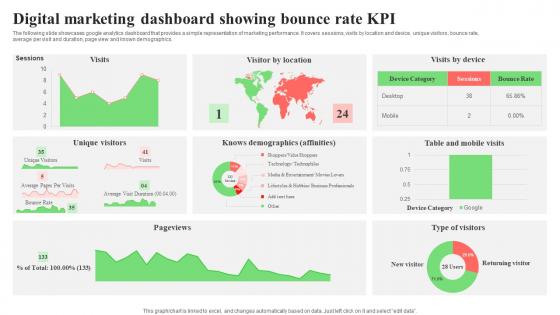
Digital Marketing Dashboard Showing Bounce Rate KPI Microsoft Pdf
The following slide showcases google analytics dashboard that provides a simple representation of marketing performance. It covers sessions, visits by location and device, unique visitors, bounce rate, average per visit and duration, page view and known demographics. Showcasing this set of slides titled Digital Marketing Dashboard Showing Bounce Rate KPI Microsoft Pdf. The topics addressed in these templates are Unique Visitors, Bounce Rate, Average Per Visit. All the content presented in this PPT design is completely editable. Download it and make adjustments in color, background, font etc. as per your unique business setting. The following slide showcases google analytics dashboard that provides a simple representation of marketing performance. It covers sessions, visits by location and device, unique visitors, bounce rate, average per visit and duration, page view and known demographics.
Customer Relationship Management Dashboard Marketing Roadmap Icons PDF
Presenting customer relationship management dashboard marketing roadmap icons pdf to provide visual cues and insights. Share and navigate important information on four stages that need your due attention. This template can be used to pitch topics like newsletter sign up plugin, whitepaper development, analytics implementation, blog post developments, home page redesign. In addtion, this PPT design contains high resolution images, graphics, etc, that are easily editable and available for immediate download.
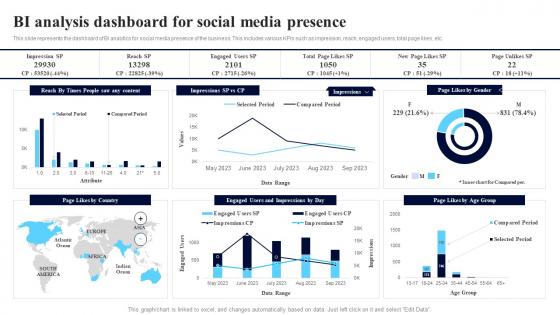
BI Analysis Dashboard For Social Media Presence Introduction Pdf
This slide represents the dashboard of BI analytics for social media presence of the business. This includes various KPIs such as impression, reach, engaged users, total page likes, etc. Pitch your topic with ease and precision using this BI Analysis Dashboard For Social Media Presence Introduction Pdf. This layout presents information on Impressions, Page Likes, Engaged Users. It is also available for immediate download and adjustment. So, changes can be made in the color, design, graphics or any other component to create a unique layout. This slide represents the dashboard of BI analytics for social media presence of the business. This includes various KPIs such as impression, reach, engaged users, total page likes, etc.
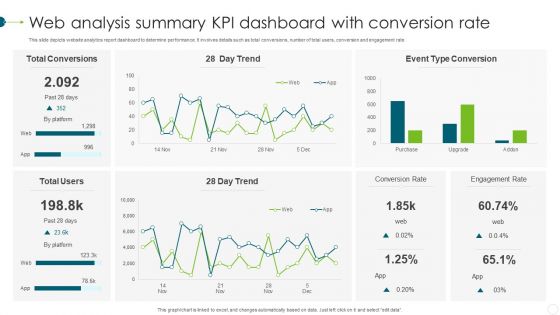
Web Analysis Summary KPI Dashboard With Conversion Rate Themes PDF
This slide depicts website analytics report dashboard to determine performance. It involves details such as total conversions, number of total users, conversion and engagement rate. Pitch your topic with ease and precision using this Web Analysis Summary KPI Dashboard With Conversion Rate Themes PDF. This layout presents information on Web Analysis Summary, KPI Dashboard, Conversion Rate. It is also available for immediate download and adjustment. So, changes can be made in the color, design, graphics or any other component to create a unique layout.
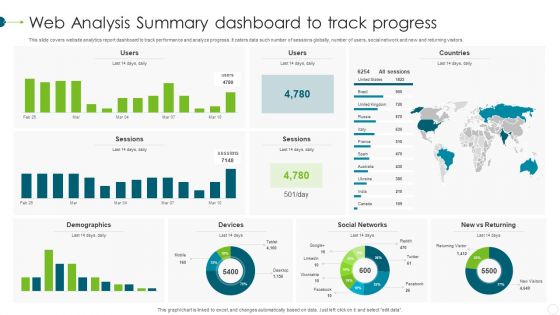
Web Analysis Summary Dashboard To Track Progress Elements PDF
This slide covers website analytics report dashboard to track performance and analyze progress. It caters data such number of sessions globally, number of users, social network and new and returning visitors. Showcasing this set of slides titled Web Analysis Summary Dashboard To Track Progress Elements PDF. The topics addressed in these templates are Demographics, Devices, Social Networks. All the content presented in this PPT design is completely editable. Download it and make adjustments in color, background, font etc. as per your unique business setting.
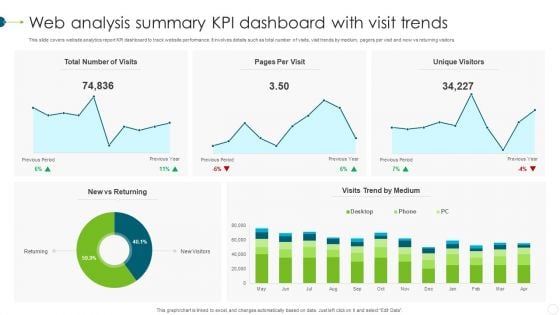
Web Analysis Summary KPI Dashboard With Visit Trends Professional PDF
This slide covers website analytics report KPI dashboard to track website performance. It involves details such as total number of visits, visit trends by medium, pagers per visit and new vs returning visitors. Pitch your topic with ease and precision using this Web Analysis Summary KPI Dashboard With Visit Trends Professional PDF. This layout presents information on Web Analysis Summary, KPI Dashboard, Visit Trends. It is also available for immediate download and adjustment. So, changes can be made in the color, design, graphics or any other component to create a unique layout.
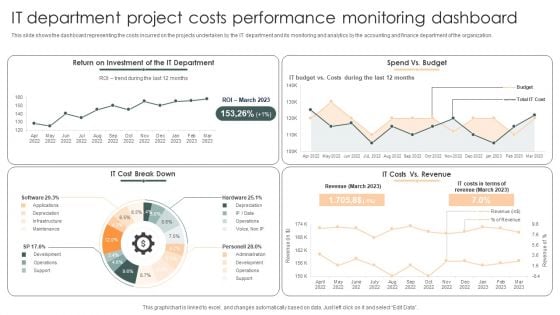
IT Department Project Costs Performance Monitoring Dashboard Demonstration PDF
This slide shows the dashboard representing the costs incurred on the projects undertaken by the IT department and its monitoring and analytics by the accounting and finance department of the organization.Showcasing this set of slides titled IT Department Project Costs Performance Monitoring Dashboard Demonstration PDF. The topics addressed in these templates are Return Investment, Cost Break, Costs Revenue. All the content presented in this PPT design is completely editable. Download it and make adjustments in color, background, font etc. as per your unique business setting.
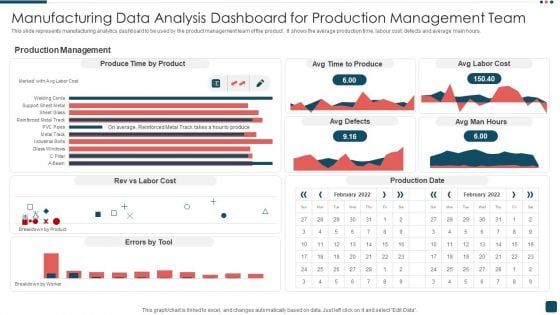
Manufacturing Data Analysis Dashboard For Production Management Team Summary PDF
This slide represents manufacturing analytics dashboard to be used by the product management team of the product . It shows the average production time, labour cost, defects and average main hours. Pitch your topic with ease and precision using this Manufacturing Data Analysis Dashboard For Production Management Team Summary PDF. This layout presents information on Production Management, Product, Cost. It is also available for immediate download and adjustment. So, changes can be made in the color, design, graphics or any other component to create a unique layout.
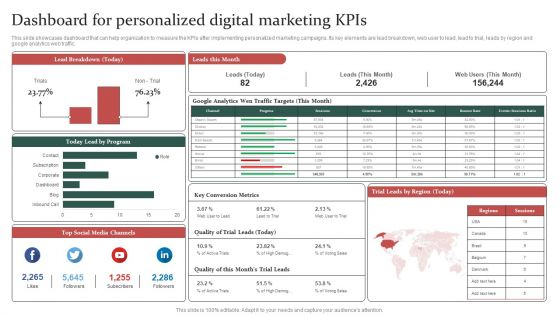
Gathering Customer Dashboard For Personalized Digital Marketing Kpis Demonstration PDF
This slide showcases dashboard that can help organization to measure the KPIs after implementing personalized marketing campaigns. Its key elements are lead breakdown, web user to lead, lead to trial, leads by region and google analytics web traffic. Find a pre-designed and impeccable Gathering Customer Dashboard For Personalized Digital Marketing Kpis Demonstration PDF. The templates can ace your presentation without additional effort. You can download these easy-to-edit presentation templates to make your presentation stand out from others. So, what are you waiting for Download the template from Slidegeeks today and give a unique touch to your presentation.
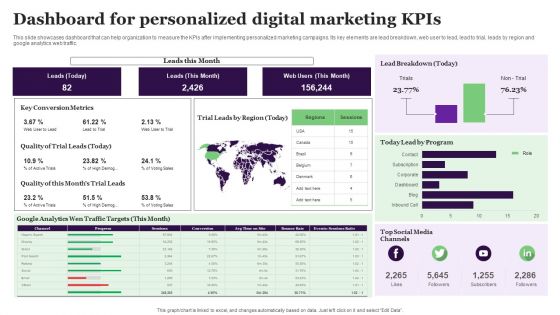
Dashboard For Personalized Digital Marketing Kpis Introduction PDF
This slide showcases dashboard that can help organization to measure the KPIs after implementing personalized marketing campaigns. Its key elements are lead breakdown, web user to lead, lead to trial, leads by region and google analytics web traffic. Boost your pitch with our creative Dashboard For Personalized Digital Marketing Kpis Introduction PDF. Deliver an awe-inspiring pitch that will mesmerize everyone. Using these presentation templates you will surely catch everyones attention. You can browse the ppts collection on our website. We have researchers who are experts at creating the right content for the templates. So you do not have to invest time in any additional work. Just grab the template now and use them.
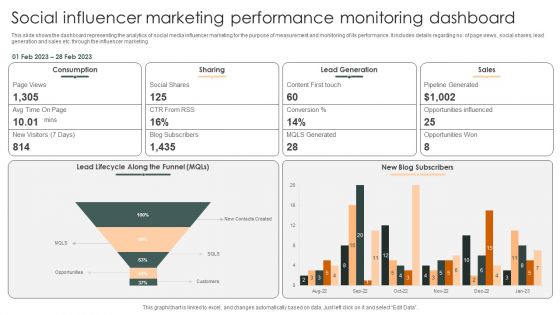
Social Influencer Marketing Performance Monitoring Dashboard Slides PDF
This slide shows the dashboard representing the analytics of social media influencer marketing for the purpose of measurement and monitoring of its performance. It includes details regarding no. of page views, social shares, lead generation and sales etc. through the influencer marketing.Pitch your topic with ease and precision using this Social Influencer Marketing Performance Monitoring Dashboard Slides PDF. This layout presents information on Lead Generation, Pipeline Generated, Opportunities Influenced. It is also available for immediate download and adjustment. So, changes can be made in the color, design, graphics or any other component to create a unique layout.
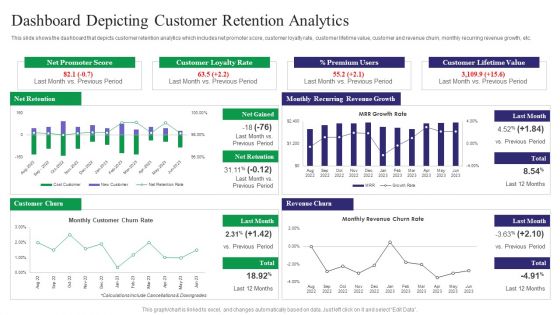
Reducing Customer Turnover Rates Dashboard Depicting Customer Retention Brochure PDF
This slide shows the dashboard that depicts customer retention analytics which includes net promoter score, customer loyalty rate, customer lifetime value, customer and revenue churn, monthly recurring revenue growth, etc. From laying roadmaps to briefing everything in detail, our templates are perfect for you. You can set the stage with your presentation slides. All you have to do is download these easy-to-edit and customizable templates. Reducing Customer Turnover Rates Dashboard Depicting Customer Retention Brochure PDF will help you deliver an outstanding performance that everyone would remember and praise you for. Do download this presentation today.
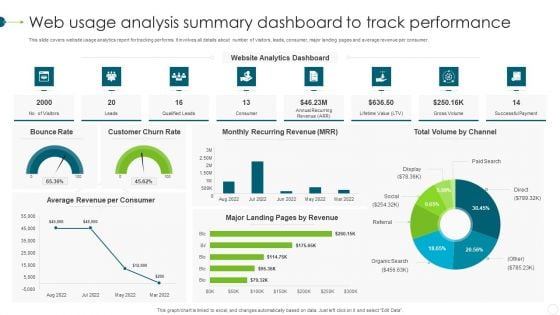
Web Usage Analysis Summary Dashboard To Track Performance Background PDF
This slide covers website usage analytics report for tracking performs. It involves all details about number of visitors, leads, consumer, major landing pages and average revenue per consumer. Showcasing this set of slides titled Web Usage Analysis Summary Dashboard To Track Performance Background PDF. The topics addressed in these templates are Customer Churn Rate, Bounce Rate, Monthly Recurring Revenue. All the content presented in this PPT design is completely editable. Download it and make adjustments in color, background, font etc. as per your unique business setting.
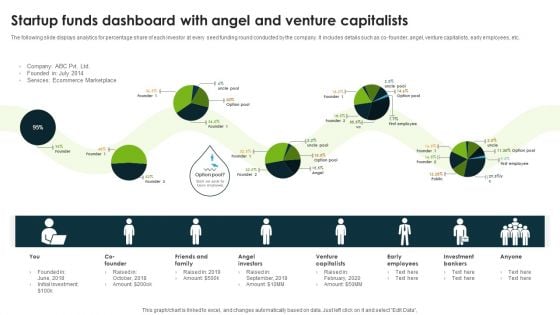
Startup Funds Dashboard With Angel And Venture Capitalists Infographics PDF
The following slide displays analytics for percentage share of each investor at every seed funding round conducted by the company. It includes details such as co founder, angel, venture capitalists, early employees, etc. Showcasing this set of slides titled Startup Funds Dashboard With Angel And Venture Capitalists Infographics PDF. The topics addressed in these templates are Angel Investors, Venture Capitalists, Early Employees. All the content presented in this PPT design is completely editable. Download it and make adjustments in color, background, font etc. as per your unique business setting.


 Continue with Email

 Home
Home


