Business Analytics Dashboard Diagram
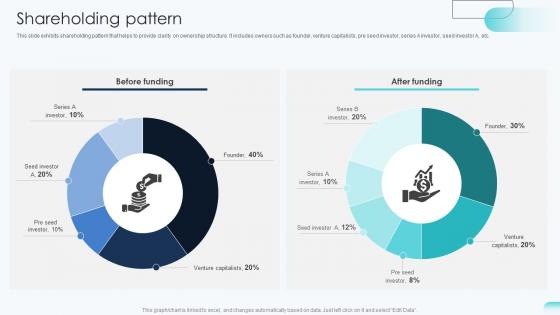
Shareholding Pattern Big Data Analytics Investor Funding Elevator Pitch Deck
This slide exhibits shareholding pattern that helps to provide clarity on ownership structure. It includes owners such as founder, venture capitalists, pre seed investor, series A investor, seed investor A, etc. This Shareholding Pattern Big Data Analytics Investor Funding Elevator Pitch Deck is perfect for any presentation, be it in front of clients or colleagues. It is a versatile and stylish solution for organizing your meetings. The Shareholding Pattern Big Data Analytics Investor Funding Elevator Pitch Deck features a modern design for your presentation meetings. The adjustable and customizable slides provide unlimited possibilities for acing up your presentation. Slidegeeks has done all the homework before launching the product for you. So, do not wait, grab the presentation templates today This slide exhibits shareholding pattern that helps to provide clarity on ownership structure. It includes owners such as founder, venture capitalists, pre seed investor, series A investor, seed investor A, etc.
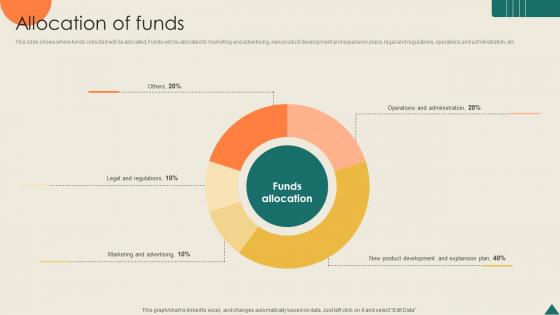
Allocation Of Funds Financial Analytics Platform Investor Elevator Pitch Deck
This slide shows where funds collected will be allocated. Funds will be allocated to marketing and advertising, new product development and expansion plans, legal and regulations, operations and administration, etc. The Allocation Of Funds Financial Analytics Platform Investor Elevator Pitch Deck is a compilation of the most recent design trends as a series of slides. It is suitable for any subject or industry presentation, containing attractive visuals and photo spots for businesses to clearly express their messages. This template contains a variety of slides for the user to input data, such as structures to contrast two elements, bullet points, and slides for written information. Slidegeeks is prepared to create an impression. This slide shows where funds collected will be allocated. Funds will be allocated to marketing and advertising, new product development and expansion plans, legal and regulations, operations and administration, etc.
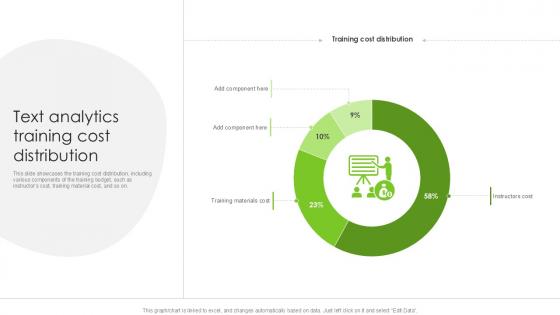
Text Analytics Training Cost Distribution PPT Sample SS
This slide showcases the training cost distribution, including various components of the training budget, such as instructors cost, training material cost, and so on. The Text Analytics Training Cost Distribution PPT Sample SS is a compilation of the most recent design trends as a series of slides. It is suitable for any subject or industry presentation, containing attractive visuals and photo spots for businesses to clearly express their messages. This template contains a variety of slides for the user to input data, such as structures to contrast two elements, bullet points, and slides for written information. Slidegeeks is prepared to create an impression. This slide showcases the training cost distribution, including various components of the training budget, such as instructors cost, training material cost, and so on.
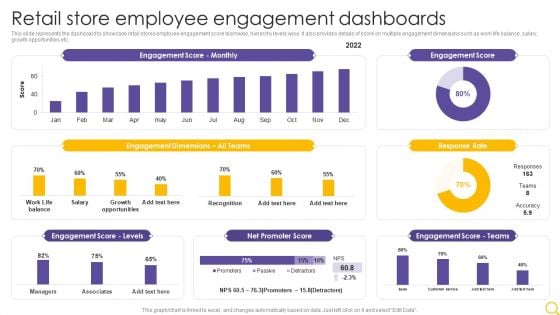
Retail Outlet Operational Efficiency Analytics Retail Store Employee Engagement Dashboards Sample PDF
This slide represents the dashboard to showcase retail stores employee engagement score teamwise, hierarchy levels wise. It also provides details of score on multiple engagement dimensions such as work life balance, salary, growth opportunities etc. Deliver an awe inspiring pitch with this creative Retail Outlet Operational Efficiency Analytics Retail Store Employee Engagement Dashboards Sample PDF bundle. Topics like Engagement Score Monthly, Engagement Dimensions, Engagement Score Levels can be discussed with this completely editable template. It is available for immediate download depending on the needs and requirements of the user.
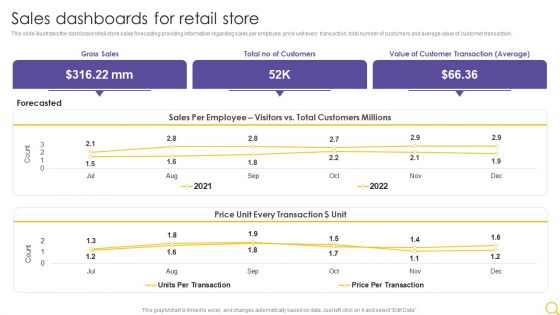
Retail Outlet Operational Efficiency Analytics Sales Dashboards For Retail Store Inspiration PDF
This slide illustrates the dashboard retail store sales forecasting providing information regarding sales per employee, price unit every transaction, total number of customers and average value of customer transaction. Deliver and pitch your topic in the best possible manner with this Retail Outlet Operational Efficiency Analytics Sales Dashboards For Retail Store Inspiration PDF. Use them to share invaluable insights on Gross Sales, Total No Customers, Value Customer and impress your audience. This template can be altered and modified as per your expectations. So, grab it now.
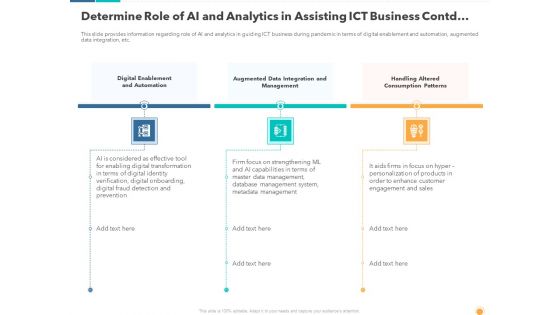
Determine Role Of AI And Analytics In Assisting ICT Business Contd Microsoft PDF
Presentingdetermine role of ai and analytics in assisting ict business contd microsoft pdf to provide visual cues and insights. Share and navigate important information on three stages that need your due attention. This template can be used to pitch topics like digital enablement and automation , augmented data integration and management, handling altered consumption patterns . In addtion, this PPT design contains high resolution images, graphics, etc, that are easily editable and available for immediate download.
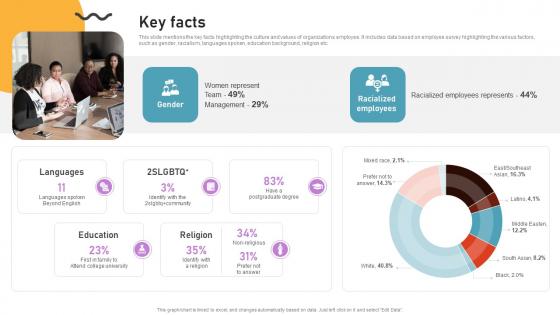
Key Facts Cloud Based Predictive Analytics Software Pitch Deck
This slide mentions the key facts highlighting the culture and values of organizations employee. It includes data based on employee survey highlighting the various factors, such as gender, racialism, languages spoken, education background, religion etc. Find highly impressive Key Facts Cloud Based Predictive Analytics Software Pitch Deck on Slidegeeks to deliver a meaningful presentation. You can save an ample amount of time using these presentation templates. No need to worry to prepare everything from scratch because Slidegeeks experts have already done a huge research and work for you. You need to download Key Facts Cloud Based Predictive Analytics Software Pitch Deck for your upcoming presentation. All the presentation templates are 100 percent editable and you can change the color and personalize the content accordingly. Download now This slide mentions the key facts highlighting the culture and values of organizations employee. It includes data based on employee survey highlighting the various factors, such as gender, racialism, languages spoken, education background, religion etc.
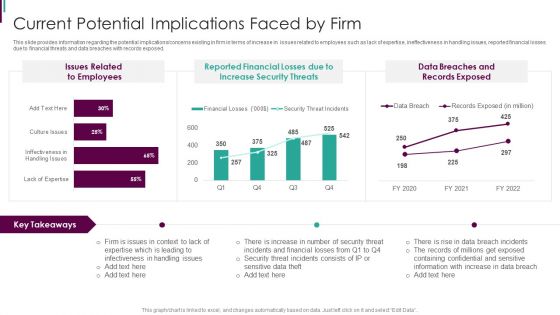
Developing Business Analytics Framework Current Potential Implications Faced By Firm Graphics PDF
This slide provides information regarding the potential implications concerns existing in firm in terms of increase in issues related to employees such as lack of expertise, ineffectiveness in handling issues, reported financial losses due to financial threats and data breaches with records exposed. Deliver and pitch your topic in the best possible manner with this Developing Business Analytics Framework Current Potential Implications Faced By Firm Graphics PDF Use them to share invaluable insights on Reported Financial, Increase Security, Data Breaches and impress your audience. This template can be altered and modified as per your expectations. So, grab it now.
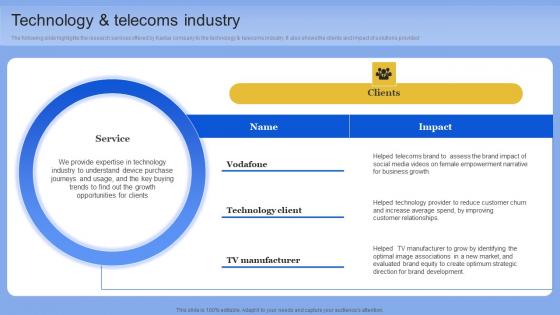
Technology And Telecoms Industry Data Analytics Company Outline Rules PDF
The following slide highlights the research services offered by Kantar company to the technology and telecoms industry. It also shows the clients and impact of solutions provided. Do you know about Slidesgeeks Technology And Telecoms Industry Data Analytics Company Outline Rules PDF These are perfect for delivering any kind od presentation. Using it, create PowerPoint presentations that communicate your ideas and engage audiences. Save time and effort by using our pre-designed presentation templates that are perfect for a wide range of topic. Our vast selection of designs covers a range of styles, from creative to business, and are all highly customizable and easy to edit. Download as a PowerPoint template or use them as Google Slides themes. The following slide highlights the research services offered by Kantar company to the technology and telecoms industry. It also shows the clients and impact of solutions provided
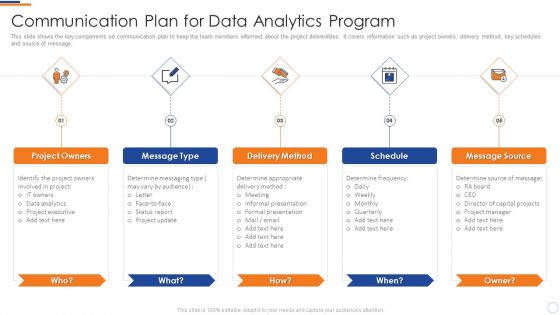
Communication Plan For Program Business Intelligence And Big Data Analytics Slides PDF
This slide shows the key components od communication plan to keep the team members informed about the project deliverables. It covers information such as project owners, delivery method, key schedules and source of message.Presenting communication plan for program business intelligence and big data analytics slides pdf to provide visual cues and insights. Share and navigate important information on five stages that need your due attention. This template can be used to pitch topics like project owners, message type, delivery method, schedule, message source. In addtion, this PPT design contains high resolution images, graphics, etc, that are easily editable and available for immediate download.
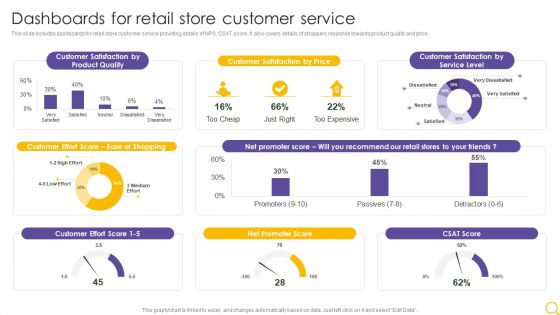
Retail Outlet Operational Efficiency Analytics Dashboards For Retail Store Customer Service Professional PDF
This slide includes dashboards for retail store customer service providing details of NPS, CSAT score. It also covers details of shoppers response towards product quality and price. Deliver an awe inspiring pitch with this creative Retail Outlet Operational Efficiency Analytics Dashboards For Retail Store Customer Service Professional PDF bundle. Topics like Product Quality, Customer Satisfaction, Customer Effort Score can be discussed with this completely editable template. It is available for immediate download depending on the needs and requirements of the user.
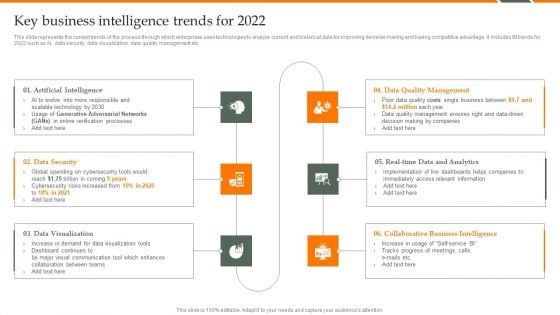
Human Resource Analytics Key Business Intelligence Trends For 2022 Elements PDF
This slide represents the current trends of the process through which enterprises uses technologies to analyze current and historical data for improving decision making and having competitive advantage. It includes BI trends for 2022 such as AI, data security, data visualization, data quality management etc. Welcome to our selection of the Human Resource Analytics Key Business Intelligence Trends For 2022 Elements PDF. These are designed to help you showcase your creativity and bring your sphere to life. Planning and Innovation are essential for any business that is just starting out. This collection contains the designs that you need for your everyday presentations. All of our PowerPoints are 100 percent editable, so you can customize them to suit your needs. This multi-purpose template can be used in various situations. Grab these presentation templates today.
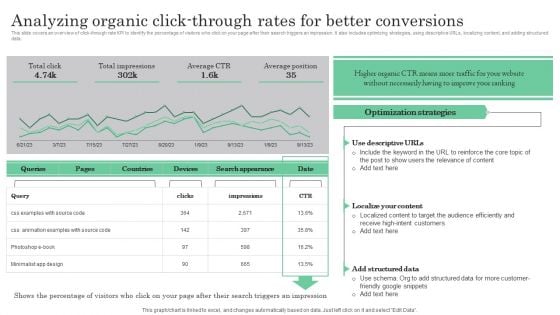
Online Marketing Analytics To Enhance Business Growth Analyzing Organic Click Through Rates For Better Guidelines PDF
This slide covers an overview of click-through rate KPI to identify the percentage of visitors who click on your page after their search triggers an impression. It also includes optimizing strategies, using descriptive URLs, localizing content, and adding structured data. Boost your pitch with our creative Online Marketing Analytics To Enhance Business Growth Analyzing Organic Click Through Rates For Better Guidelines PDF. Deliver an awe-inspiring pitch that will mesmerize everyone. Using these presentation templates you will surely catch everyones attention. You can browse the ppts collection on our website. We have researchers who are experts at creating the right content for the templates. So you do not have to invest time in any additional work. Just grab the template now and use them.
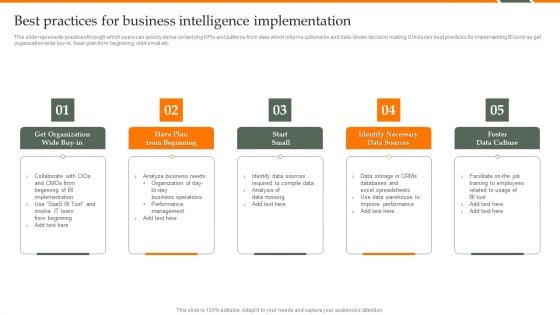
Human Resource Analytics Best Practices For Business Intelligence Implementation Sample PDF
This slide represents practices through which users can quickly derive underlying KPIs and patterns from data which informs actionable and data-driven decision making. It includes best practices for implementing BI such as get organization wide buy-in, have plan from beginning, start small etc. Slidegeeks is one of the best resources for PowerPoint templates. You can download easily and regulate Human Resource Analytics Best Practices For Business Intelligence Implementation Sample PDF for your personal presentations from our wonderful collection. A few clicks is all it takes to discover and get the most relevant and appropriate templates. Use our Templates to add a unique zing and appeal to your presentation and meetings. All the slides are easy to edit and you can use them even for advertisement purposes.
Oracle Analytics Cloud Solutions Collaboration And Publishing Icons PDF
This slide depicts the professional edition provided by Oracle Analytics Cloud and its various features that users can use to carry out valuable insights from data. This is a oracle analytics cloud solutions collaboration and publishing icons pdf template with various stages. Focus and dispense information on six stages using this creative set, that comes with editable features. It contains large content boxes to add your information on topics like business, application, collecting, processes, analytics. You can also showcase facts, figures, and other relevant content using this PPT layout. Grab it now.
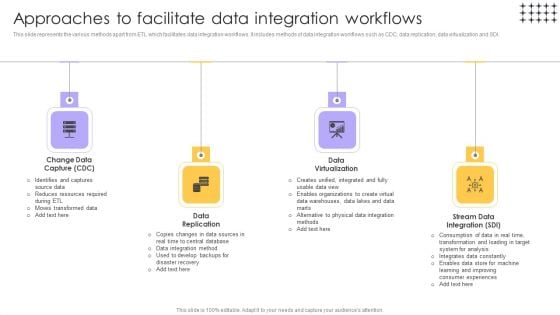
Tools For HR Business Analytics Approaches To Facilitate Data Integration Workflows Formats PDF
This slide represents the various methods apart from ETL which facilitates data integration workflows. It includes methods of data integration workflows such as CDC, data replication, data virtualization and SDI. Slidegeeks is one of the best resources for PowerPoint templates. You can download easily and regulate Tools For HR Business Analytics Approaches To Facilitate Data Integration Workflows Formats PDF for your personal presentations from our wonderful collection. A few clicks is all it takes to discover and get the most relevant and appropriate templates. Use our Templates to add a unique zing and appeal to your presentation and meetings. All the slides are easy to edit and you can use them even for advertisement purposes.
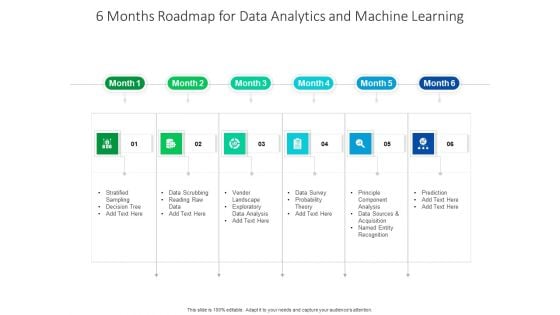
6 Months Roadmap For Data Analytics And Machine Learning Rules
Introducing our 6 months roadmap for data analytics and machine learning rules. This PPT presentation is Google Slides compatible, therefore, you can share it easily with the collaborators for measuring the progress. Also, the presentation is available in both standard screen and widescreen aspect ratios. So edit the template design by modifying the font size, font type, color, and shapes as per your requirements. As this PPT design is fully editable it can be presented in PDF, JPG and PNG formats.
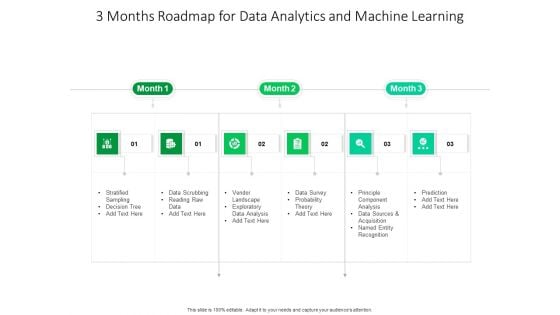
3 Months Roadmap For Data Analytics And Machine Learning Formats
Presenting the 3 months roadmap for data analytics and machine learning formats. The template includes a roadmap that can be used to initiate a strategic plan. Not only this, the PowerPoint slideshow is completely editable and you can effortlessly modify the font size, font type, and shapes according to your needs. This PPT slide can be easily reached in standard screen and widescreen aspect ratios. The set is also available in various formats like PDF, PNG, and JPG. So download and use it multiple times as per your knowledge.

5 Year Roadmap For Data Analytics And Machine Learning Elements
Presenting the 5 year roadmap for data analytics and machine learning elements. The template includes a roadmap that can be used to initiate a strategic plan. Not only this, the PowerPoint slideshow is completely editable and you can effortlessly modify the font size, font type, and shapes according to your needs. This PPT slide can be easily reached in standard screen and widescreen aspect ratios. The set is also available in various formats like PDF, PNG, and JPG. So download and use it multiple times as per your knowledge.
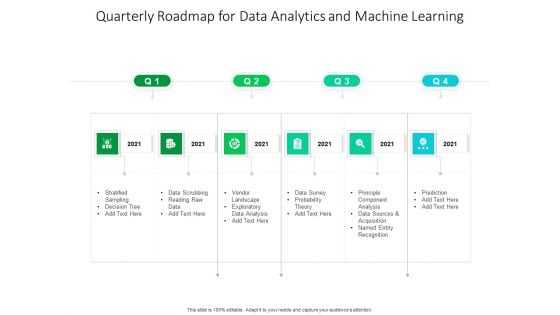
Quarterly Roadmap For Data Analytics And Machine Learning Information
Presenting the quarterly roadmap for data analytics and machine learning information. The template includes a roadmap that can be used to initiate a strategic plan. Not only this, the PowerPoint slideshow is completely editable and you can effortlessly modify the font size, font type, and shapes according to your needs. This PPT slide can be easily reached in standard screen and widescreen aspect ratios. The set is also available in various formats like PDF, PNG, and JPG. So download and use it multiple times as per your knowledge.

3 Months Roadmap For SAP Analytics Online Data Storage Guidelines
Presenting our jaw-dropping 3 months roadmap for sap analytics online data storage guidelines. You can alternate the color, font size, font type, and shapes of this PPT layout according to your strategic process. This PPT presentation is compatible with Google Slides and is available in both standard screen and widescreen aspect ratios. You can also download this well-researched PowerPoint template design in different formats like PDF, JPG, and PNG. So utilize this visually-appealing design by clicking the download button given below.
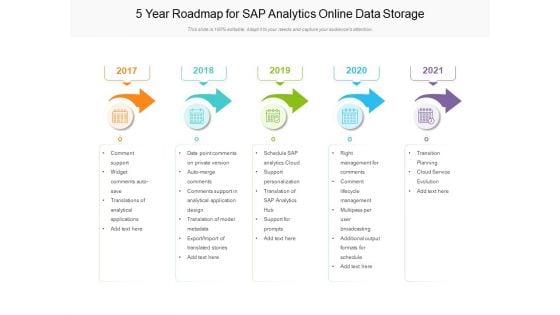
5 Year Roadmap For SAP Analytics Online Data Storage Professional
Presenting our jaw-dropping 5 year roadmap for sap analytics online data storage professional. You can alternate the color, font size, font type, and shapes of this PPT layout according to your strategic process. This PPT presentation is compatible with Google Slides and is available in both standard screen and widescreen aspect ratios. You can also download this well-researched PowerPoint template design in different formats like PDF, JPG, and PNG. So utilize this visually-appealing design by clicking the download button given below.
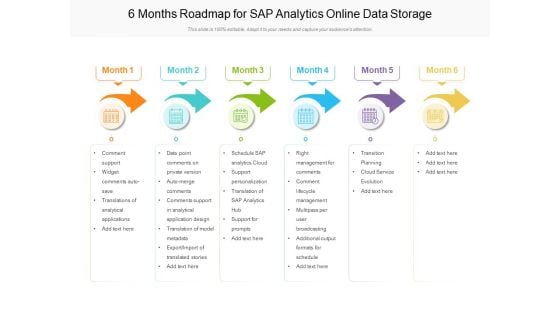
6 Months Roadmap For SAP Analytics Online Data Storage Information
Presenting our jaw-dropping 6 months roadmap for sap analytics online data storage information. You can alternate the color, font size, font type, and shapes of this PPT layout according to your strategic process. This PPT presentation is compatible with Google Slides and is available in both standard screen and widescreen aspect ratios. You can also download this well-researched PowerPoint template design in different formats like PDF, JPG, and PNG. So utilize this visually-appealing design by clicking the download button given below.
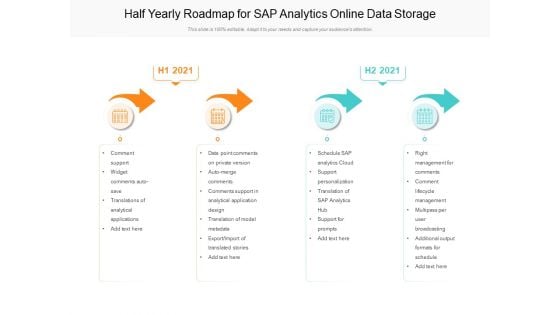
Half Yearly Roadmap For SAP Analytics Online Data Storage Pictures
Presenting our jaw-dropping half yearly roadmap for sap analytics online data storage pictures. You can alternate the color, font size, font type, and shapes of this PPT layout according to your strategic process. This PPT presentation is compatible with Google Slides and is available in both standard screen and widescreen aspect ratios. You can also download this well-researched PowerPoint template design in different formats like PDF, JPG, and PNG. So utilize this visually-appealing design by clicking the download button given below.
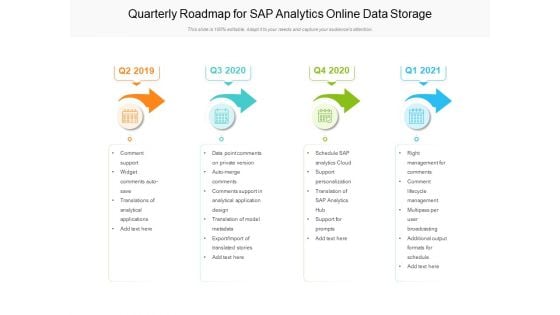
Quarterly Roadmap For SAP Analytics Online Data Storage Guidelines
Presenting our jaw-dropping quarterly roadmap for sap analytics online data storage guidelines. You can alternate the color, font size, font type, and shapes of this PPT layout according to your strategic process. This PPT presentation is compatible with Google Slides and is available in both standard screen and widescreen aspect ratios. You can also download this well-researched PowerPoint template design in different formats like PDF, JPG, and PNG. So utilize this visually-appealing design by clicking the download button given below.
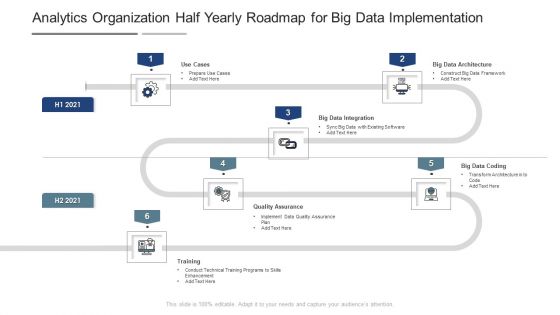
Analytics Organization Half Yearly Roadmap For Big Data Implementation Template
Presenting our innovatively structured analytics organization half yearly roadmap for big data implementation template Template. Showcase your roadmap process in different formats like PDF, PNG, and JPG by clicking the download button below. This PPT design is available in both Standard Screen and Widescreen aspect ratios. It can also be easily personalized and presented with modified font size, font type, color, and shapes to measure your progress in a clear way.
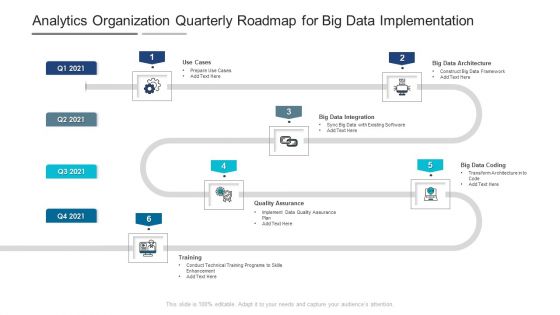
Analytics Organization Quarterly Roadmap For Big Data Implementation Portrait
Introducing our analytics organization quarterly roadmap for big data implementation portrait. This PPT presentation is Google Slides compatible, therefore, you can share it easily with the collaborators for measuring the progress. Also, the presentation is available in both standard screen and widescreen aspect ratios. So edit the template design by modifying the font size, font type, color, and shapes as per your requirements. As this PPT design is fully editable it can be presented in PDF, JPG and PNG formats.

Business Intelligence And Big Data Analytics Transformation Toolkit Ppt PowerPoint Presentation Complete Deck With Slides
This complete deck acts as a great communication tool. It helps you in conveying your business message with personalized sets of graphics, icons etc. Comprising a set of ninety five slides, this complete deck can help you persuade your audience. It also induces strategic thinking as it has been thoroughly researched and put together by our experts. Not only is it easily downloadable but also editable. The color, graphics, theme any component can be altered to fit your individual needs. So grab it now.
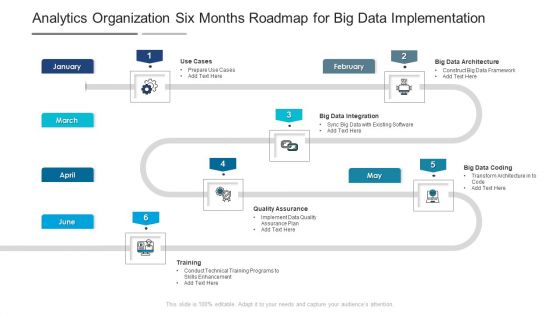
Analytics Organization Six Months Roadmap For Big Data Implementation Inspiration
Presenting the analytics organization six months roadmap for big data implementation inspiration. The template includes a roadmap that can be used to initiate a strategic plan. Not only this, the PowerPoint slideshow is completely editable and you can effortlessly modify the font size, font type, and shapes according to your needs. This PPT slide can be easily reached in standard screen and widescreen aspect ratios. The set is also available in various formats like PDF, PNG, and JPG. So download and use it multiple times as per your knowledge.
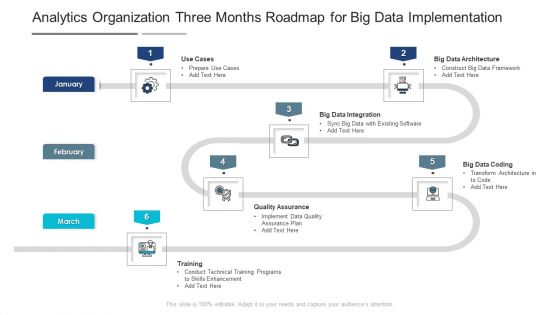
Analytics Organization Three Months Roadmap For Big Data Implementation Demonstration
Presenting our jaw dropping analytics organization three months roadmap for big data implementation demonstration. You can alternate the color, font size, font type, and shapes of this PPT layout according to your strategic process. This PPT presentation is compatible with Google Slides and is available in both standard screen and widescreen aspect ratios. You can also download this well researched PowerPoint template design in different formats like PDF, JPG, and PNG. So utilize this visually appealing design by clicking the download button given below.
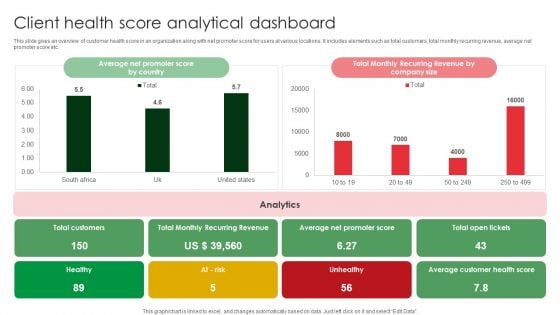
Client Health Score Analytical Dashboard Rules PDF
This slide gives an overview of customer health score in an organization along with net promoter score for users at various locations. It includes elements such as total customers, total monthly recurring revenue, average net promoter score etc. Showcasing this set of slides titled Client Health Score Analytical Dashboard Rules PDF. The topics addressed in these templates are Average Net Promoter, Average Customer Health, Healthy. All the content presented in this PPT design is completely editable. Download it and make adjustments in color, background, font etc. as per your unique business setting.
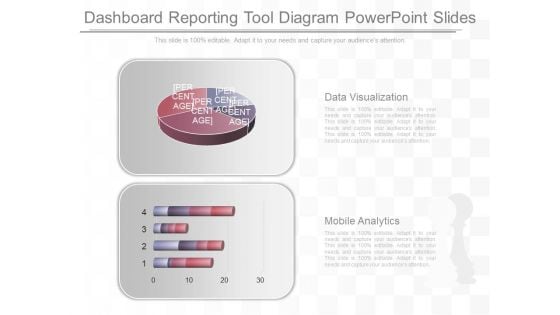
Dashboard Reporting Tool Diagram Powerpoint Slides
This is a dashboard reporting tool diagram powerpoint slides. This is a two stage process. The stages in this process are data visualization, mobile analytics.
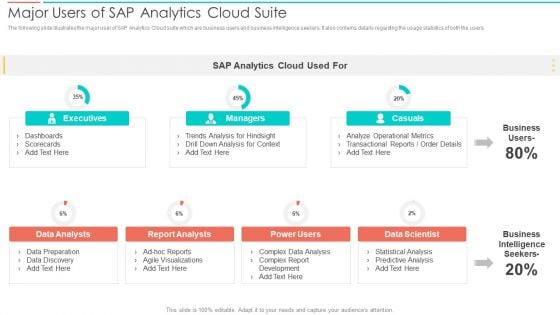
SAC Planning And Implementation Major Users Of SAP Analytics Cloud Suite Diagrams PDF
The following slide illustrates the major user of SAP Analytics Cloud suite which are business users and business intelligence seekers. It also contains details regarding the usage statistics of both the users. Deliver an awe inspiring pitch with this creative SAC Planning And Implementation Major Users Of SAP Analytics Cloud Suite Diagrams PDF bundle. Topics like Executives, Casuals, Business Intelligence Seekers, Data Scientist can be discussed with this completely editable template. It is available for immediate download depending on the needs and requirements of the user.
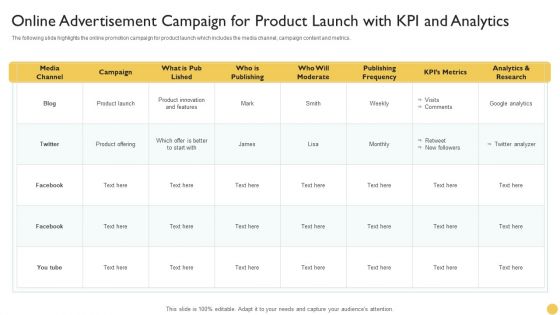
Online Advertisement Campaign For Product Launch With KPI And Analytics Diagrams PDF
The following slide highlights the online promotion campaign for product launch which includes the media channel, campaign content and metrics. Showcasing this set of slides titled Online Advertisement Campaign For Product Launch With KPI And Analytics Diagrams PDF. The topics addressed in these templates are Kpis Metrics, Google Analytics, Product Offering. All the content presented in this PPT design is completely editable. Download it and make adjustments in color, background, font etc. as per your unique business setting.
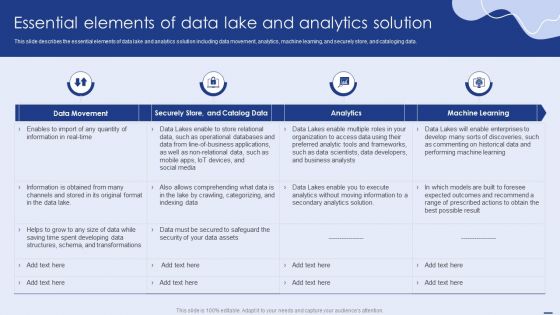
Essential Elements Of Data Lake And Analytics Solution Ppt PowerPoint Presentation File Diagrams PDF
This slide describes the essential elements of data lake and analytics solution including data movement, analytics, machine learning, and securely store, and cataloging data. This Essential Elements Of Data Lake And Analytics Solution Ppt PowerPoint Presentation File Diagrams PDF is perfect for any presentation, be it in front of clients or colleagues. It is a versatile and stylish solution for organizing your meetings. The product features a modern design for your presentation meetings. The adjustable and customizable slides provide unlimited possibilities for acing up your presentation. Slidegeeks has done all the homework before launching the product for you. So, do not wait, grab the presentation templates today.
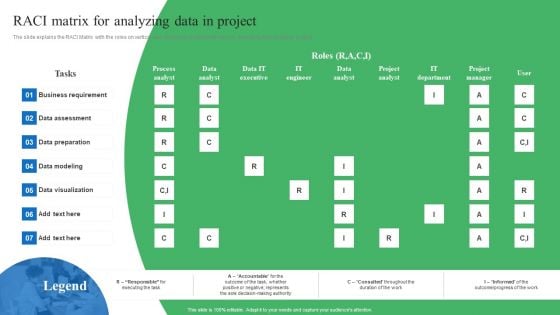
Toolkit For Data Science And Analytics Transition RACI Matrix For Analyzing Data In Project Diagrams PDF
The slide explains the RACI Matrix with the roles on vertical axis and tasks on horizontal axis for executing data analytics project. Explore a selection of the finest Toolkit For Data Science And Analytics Transition RACI Matrix For Analyzing Data In Project Diagrams PDF here. With a plethora of professionally designed and pre made slide templates, you can quickly and easily find the right one for your upcoming presentation. You can use our Toolkit For Data Science And Analytics Transition RACI Matrix For Analyzing Data In Project Diagrams PDF to effectively convey your message to a wider audience. Slidegeeks has done a lot of research before preparing these presentation templates. The content can be personalized and the slides are highly editable. Grab templates today from Slidegeeks.
Data Assimilation Advanced Analytics Final Output Results Mean Ppt Icon Diagrams PDF
Deliver an awe inspiring pitch with this creative data assimilation advanced analytics final output results mean ppt icon diagrams pdf bundle. Topics like outcome, metric, data source, analysis approach, environment can be discussed with this completely editable template. It is available for immediate download depending on the needs and requirements of the user.

Big Data Analytics Lifecycle Top Big Data Technology Domains Ppt Show Diagrams PDF
This slide represents the top big data technology domains, such as data storage, mining, analytics, and data visualization. It caters to the big data tools that every domain contains, such as Hadoop, MongoDB, RainStor, Presto, RapidMiner, etc. There are so many reasons you need a Big Data Analytics Lifecycle Top Big Data Technology Domains Ppt Show Diagrams PDF. The first reason is you cant spend time making everything from scratch, Thus, Slidegeeks has made presentation templates for you too. You can easily download these templates from our website easily.
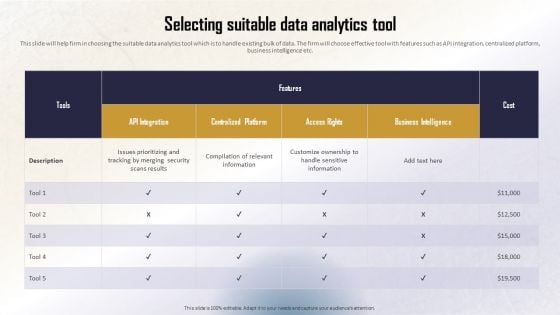
Identifying Direct And Indirect Selecting Suitable Data Analytics Tool Diagrams PDF
This slide will help firm in choosing the suitable data analytics tool which is to handle existing bulk of data. The firm will choose effective tool with features such as API integration, centralized platform, business intelligence etc. Retrieve professionally designed Identifying Direct And Indirect Selecting Suitable Data Analytics Tool Diagrams PDF to effectively convey your message and captivate your listeners. Save time by selecting pre-made slideshows that are appropriate for various topics, from business to educational purposes. These themes come in many different styles, from creative to corporate, and all of them are easily adjustable and can be edited quickly. Access them as PowerPoint templates or as Google Slides themes. You dont have to go on a hunt for the perfect presentation because Slidegeeks got you covered from everywhere.

Executing Advance Data Analytics At Workspace Addressing Service Provider Vendor Diagrams PDF
This slide provides details about various vendors analysis. These vendors are assessed on various parameters and scores are allotted them. Deliver an awe inspiring pitch with this creative executing advance data analytics at workspace addressing service provider vendor diagrams pdf bundle. Topics like addressing service provider vendor evaluation scorecard can be discussed with this completely editable template. It is available for immediate download depending on the needs and requirements of the user.
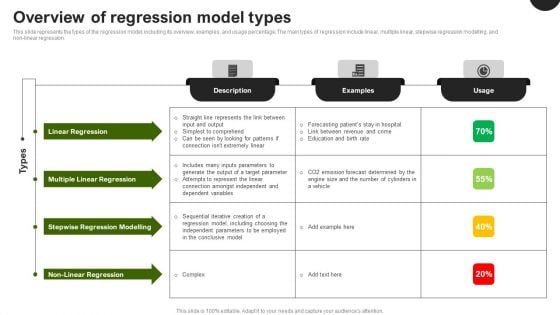
Predictive Analytics In The Age Of Big Data Overview Of Regression Model Types Diagrams PDF
This slide represents the types of the regression model, including its overview, examples, and usage percentage. The main types of regression include linear, multiple linear, stepwise regression modelling, and non-linear regression. If you are looking for a format to display your unique thoughts, then the professionally designed Predictive Analytics In The Age Of Big Data Overview Of Regression Model Types Diagrams PDF is the one for you. You can use it as a Google Slides template or a PowerPoint template. Incorporate impressive visuals, symbols, images, and other charts. Modify or reorganize the text boxes as you desire. Experiment with shade schemes and font pairings. Alter, share or cooperate with other people on your work. Download Predictive Analytics In The Age Of Big Data Overview Of Regression Model Types Diagrams PDF and find out how to give a successful presentation. Present a perfect display to your team and make your presentation unforgettable.
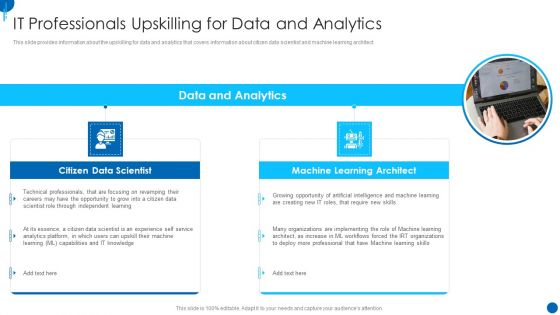
Information Technology Strategy IT Professionals Upskilling For Data And Analytics Diagrams PDF
This slide provides information about the upskilling for data and analytics that covers information about citizen data scientist and machine learning architect. This is a information technology strategy it professionals upskilling for data and analytics diagrams pdf template with various stages. Focus and dispense information on two stages using this creative set, that comes with editable features. It contains large content boxes to add your information on topics like data and analytics, citizen data scientist, machine learning architect. You can also showcase facts, figures, and other relevant content using this PPT layout. Grab it now.
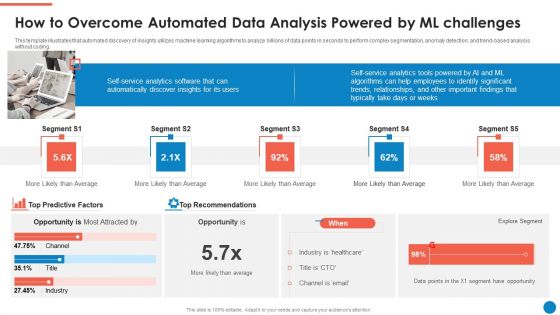
Data And Analytics Playbook How To Overcome Automated Data Analysis Powered By Ml Diagrams PDF
This template illustrates that automated discovery of insights utilizes machine learning algorithms to analyze billions of data points in seconds to perform complex segmentation, anomaly detection, and trend-based analysis without coding. This is a Data And Analytics Playbook How To Overcome Automated Data Analysis Powered By Ml Diagrams PDF template with various stages. Focus and dispense information on one stages using this creative set, that comes with editable features. It contains large content boxes to add your information on topics like Self Service Analytics Software, Top Recommendations, Explore Segment. You can also showcase facts, figures, and other relevant content using this PPT layout. Grab it now.
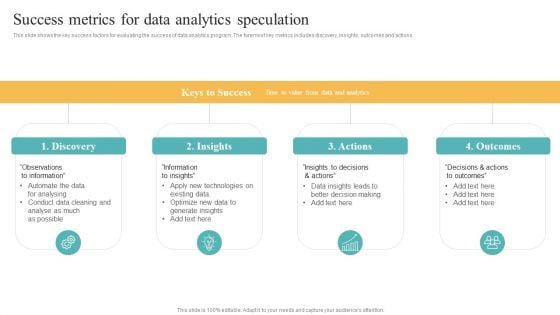
Transformation Toolkit Competitive Intelligence Information Analysis Success Metrics For Data Analytics Speculation Diagrams PDF
This slide shows the key success factors for evaluating the success of data analytics program. The foremost key metrics includes discovery, insights, outcomes and actions. Do you have to make sure that everyone on your team knows about any specific topic I yes, then you should give Transformation Toolkit Competitive Intelligence Information Analysis Success Metrics For Data Analytics Speculation Diagrams PDF a try. Our experts have put a lot of knowledge and effort into creating this impeccable Transformation Toolkit Competitive Intelligence Information Analysis Success Metrics For Data Analytics Speculation Diagrams PDF. You can use this template for your upcoming presentations, as the slides are perfect to represent even the tiniest detail. You can download these templates from the Slidegeeks website and these are easy to edit. So grab these today.
Key Issues And Solutions With Analytics And Reporting Ppt PowerPoint Presentation Icon Diagrams PDF
Persuade your audience using this key issues and solutions with analytics and reporting ppt powerpoint presentation icon diagrams pdf. This PPT design covers eight stages, thus making it a great tool to use. It also caters to a variety of topics including management, analytics, security. Download this PPT design now to present a convincing pitch that not only emphasizes the topic but also showcases your presentation skills.
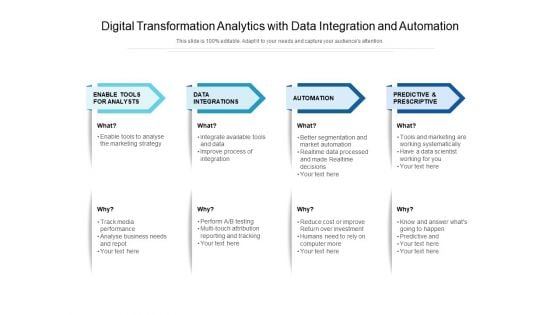
Digital Transformation Analytics With Data Integration And Automation Ppt PowerPoint Presentation File Diagrams PDF
Presenting this set of slides with name digital transformation analytics with data integration and automation ppt powerpoint presentation file diagrams pdf. This is a four stage process. The stages in this process are integrations, automation, prescriptive. This is a completely editable PowerPoint presentation and is available for immediate download. Download now and impress your audience.
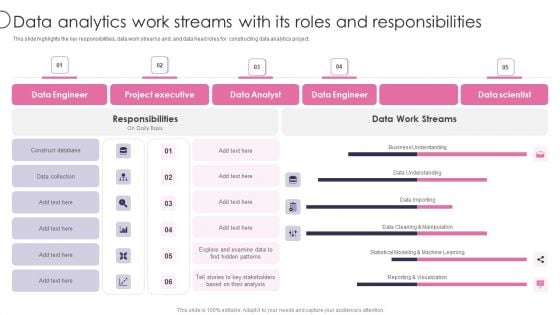
Information Transformation Process Toolkit Data Analytics Work Streams With Its Roles And Responsibilities Diagrams PDF
This slide highlights the key responsibilities, data work streams and. and data head roles for constructing data analytics project. Presenting Information Transformation Process Toolkit Data Analytics Work Streams With Its Roles And Responsibilities Diagrams PDF to provide visual cues and insights. Share and navigate important information on six stages that need your due attention. This template can be used to pitch topics like Data Engineer, Project Executive, Data Analyst. In addtion, this PPT design contains high resolution images, graphics, etc, that are easily editable and available for immediate download.
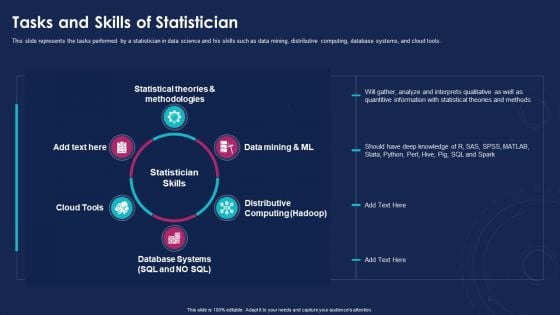
Data Analytics IT Tasks And Skills Of Statistician Ppt Pictures Diagrams PDF
This slide represents the tasks performed by a statistician in data science and his skills such as data mining, distributive computing, database systems, and cloud tools. Presenting data analytics it tasks and skills of statistician ppt pictures diagrams pdf to provide visual cues and insights. Share and navigate important information on six stages that need your due attention. This template can be used to pitch topics like statistical theories and methodologies, cloud tools, database systems, distributive computing, data mining and ml. In addtion, this PPT design contains high resolution images, graphics, etc, that are easily editable and available for immediate download.
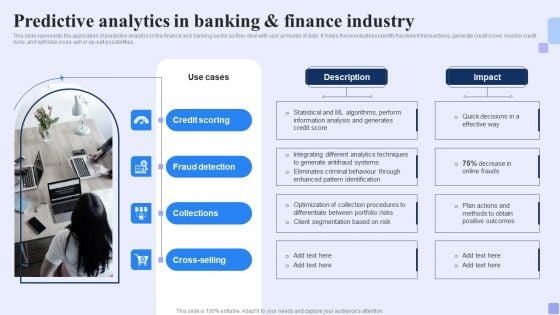
Predictive Analytics In Banking And Finance Industry Forward Looking Analysis IT Diagrams PDF
This slide represents the application of predictive analytics in the finance and banking sector as they deal with vast amounts of data. It helps these industries identify fraudulent transactions, generate credit score, monitor credit risks, and optimize cross-sell or up-sell possibilities.Coming up with a presentation necessitates that the majority of the effort goes into the content and the message you intend to convey. The visuals of a PowerPoint presentation can only be effective if it supplements and supports the story that is being told. Keeping this in mind our experts created Predictive Analytics In Banking And Finance Industry Forward Looking Analysis IT Diagrams PDF to reduce the time that goes into designing the presentation. This way, you can concentrate on the message while our designers take care of providing you with the right template for the situation.
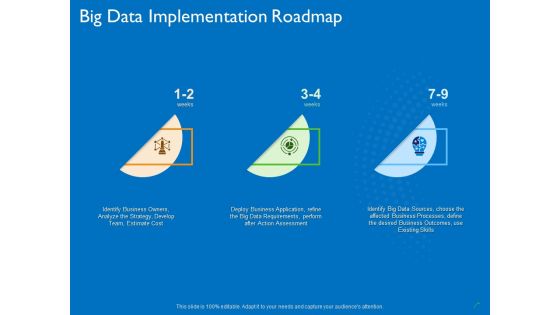
Transforming Big Data Analytics To Knowledge Big Data Implementation Roadmap Ppt Summary Diagrams PDF
This is a transforming big data analytics to knowledge big data implementation roadmap ppt summary diagrams pdf template with various stages. Focus and dispense information on three stages using this creative set, that comes with editable features. It contains large content boxes to add your information on topics like roadmap. You can also showcase facts, figures, and other relevant content using this PPT layout. Grab it now.
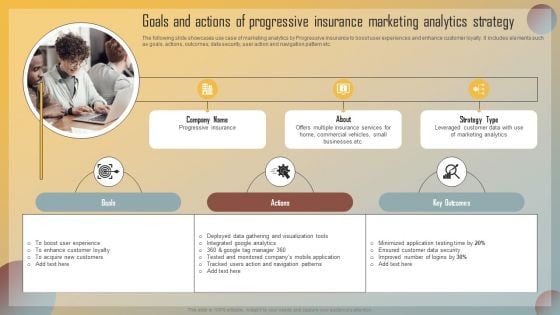
Guide For Marketing Analytics To Improve Decisions Goals And Actions Of Progressive Insurance Marketing Diagrams PDF
The following slide showcases use case of marketing analytics by Progressive insurance to boost user experiences and enhance customer loyalty. It includes elements such as goals, actions, outcomes, data security, user action and navigation pattern etc. Present like a pro with Guide For Marketing Analytics To Improve Decisions Goals And Actions Of Progressive Insurance Marketing Diagrams PDF Create beautiful presentations together with your team, using our easy to use presentation slides. Share your ideas in real time and make changes on the fly by downloading our templates. So whether you are in the office, on the go, or in a remote location, you can stay in sync with your team and present your ideas with confidence. With Slidegeeks presentation got a whole lot easier. Grab these presentations today.
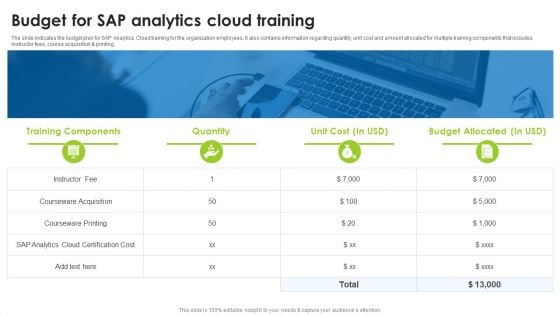
BI Technique For Data Informed Decisions Budget For Sap Analytics Cloud Training Diagrams PDF
The slide indicates the budget plan for SAP Analytics Cloud training for the organization employees. It also contains information regarding quantity, unit cost and amount allocated for multiple training components that includes instructor fees, course acquisition and printing. Boost your pitch with our creative BI Technique For Data Informed Decisions Budget For Sap Analytics Cloud Training Diagrams PDF. Deliver an awe-inspiring pitch that will mesmerize everyone. Using these presentation templates you will surely catch everyones attention. You can browse the ppts collection on our website. We have researchers who are experts at creating the right content for the templates. So you do not have to invest time in any additional work. Just grab the template now and use them.
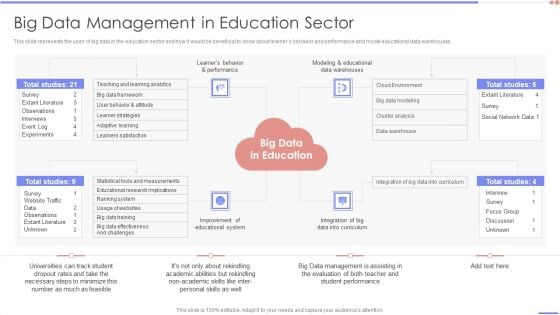
Data Analytics Management Big Data Management In Education Sector Diagrams PDF
This slide represents the uses of big data in the education sector and how it would be beneficial to know about learners behavior and performance and model educational data warehouses.This is a Data Analytics Management Big Data Management In Education Sector Diagrams PDF template with various stages. Focus and dispense information on four stages using this creative set, that comes with editable features. It contains large content boxes to add your information on topics like Extant Literature, Observations, Experiments . You can also showcase facts, figures, and other relevant content using this PPT layout. Grab it now.
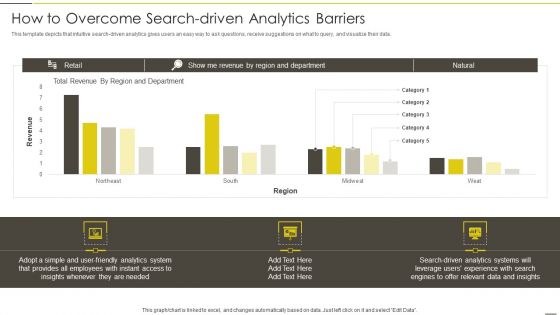
Administered Data And Analytic Quality Playbook How To Overcome Search Driven Analytics Barriers Infographics PDF
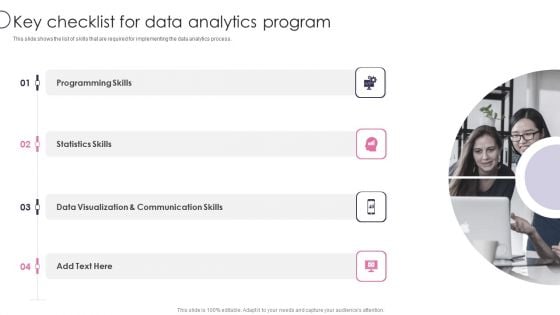
Information Transformation Process Toolkit Key Checklist For Data Analytics Program Template PDF
This diagram illustrates the Stream Analytics pipeline, showing how data is ingested, analyzed, and then sent for presentation or action. Deliver an awe inspiring pitch with this creative Information Transformation Process Toolkit Key Checklist For Data Analytics Program Template PDF bundle. Topics like Batch Analytics, Term Storage, Dashboard can be discussed with this completely editable template. It is available for immediate download depending on the needs and requirements of the user.
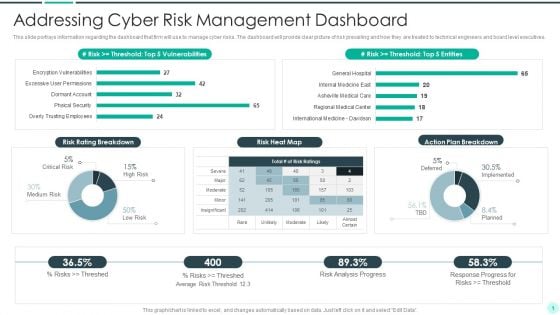
Executing Advance Data Analytics At Workspace Addressing Cyber Risk Guidelines PDF
This slide portrays information regarding the dashboard that firm will use to manage cyber risks. The dashboard will provide clear picture of risk prevailing and how they are treated to technical engineers and board level executives.Deliver an awe inspiring pitch with this creative executing advance data analytics at workspace addressing cyber risk guidelines pdf bundle. Topics like addressing cyber risk management dashboard can be discussed with this completely editable template. It is available for immediate download depending on the needs and requirements of the user.
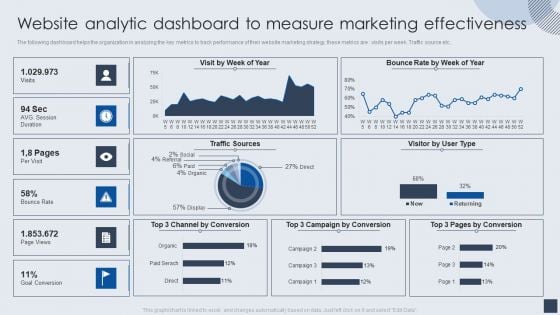
Website Analytic Dashboard To Measure Marketing Effectiveness Demonstration PDF
The following dashboard helps the organization in analyzing the key metrics to track performance of their website marketing strategy, these metrics are visits per week. Traffic source etc. Deliver and pitch your topic in the best possible manner with this Website Analytic Dashboard To Measure Marketing Effectiveness Demonstration PDF. Use them to share invaluable insights on Website Analytic Dashboard, Measure Marketing Effectiveness and impress your audience. This template can be altered and modified as per your expectations. So, grab it now.
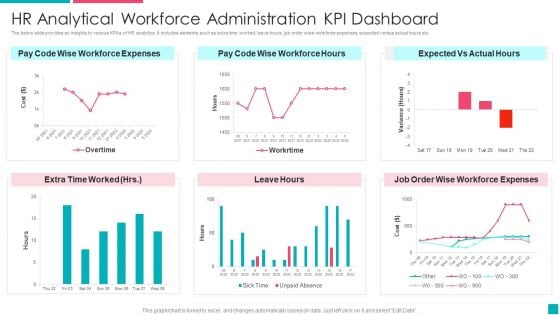
HR Analytical Workforce Administration Kpi Dashboard Introduction PDF
The below slide provides an insights to various KPAs of HR analytics. It includes elements such as extra time worked, leave hours, job order wise workforce expenses, expected versus actual hours etc. Showcasing this set of slides titled HR Analytical Workforce Administration Kpi Dashboard Introduction PDF. The topics addressed in these templates are Workforce Expenses, Administration KPI Dashboard. All the content presented in this PPT design is completely editable. Download it and make adjustments in color, background, font etc. as per your unique business setting.
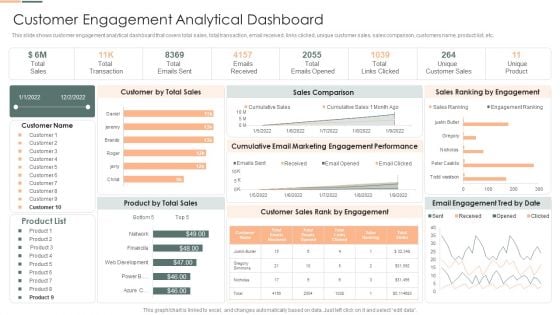
Developing Client Engagement Techniques Customer Engagement Analytical Dashboard Clipart PDF
This slide shows customer engagement analytical dashboard that covers total sales, total transaction, email received, links clicked, unique customer sales, sales comparison, customers name, product list, etc. Deliver an awe inspiring pitch with this creative Developing Client Engagement Techniques Customer Engagement Analytical Dashboard Clipart PDF bundle. Topics like Sales Comparison, Cumulative Email Marketing, Sales Ranking can be discussed with this completely editable template. It is available for immediate download depending on the needs and requirements of the user.
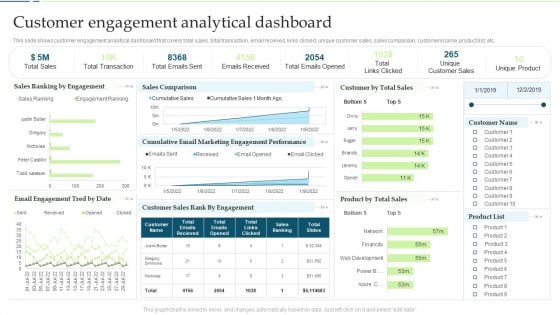
Customer Engagement And Experience Customer Engagement Analytical Dashboard Slides PDF
This slide shows customer engagement analytical dashboard that covers total sales, total transaction, email received, links clicked, unique customer sales, sales comparison, customers name, product list, etc.Deliver an awe inspiring pitch with this creative Customer Engagement And Experience Customer Engagement Analytical Dashboard Slides PDF bundle. Topics like Total Transaction, Emails Received, Unique Customer can be discussed with this completely editable template. It is available for immediate download depending on the needs and requirements of the user.


 Continue with Email

 Home
Home


