Business Snapshot
Key Success Factors Icon Showing Business Growth Guidelines PDF
Persuade your audience using this Key Success Factors Icon Showing Business Growth Guidelines PDF. This PPT design covers Three stages, thus making it a great tool to use. It also caters to a variety of topics including Key Success Factors, Icon Showing Business Growth. Download this PPT design now to present a convincing pitch that not only emphasizes the topic but also showcases your presentation skills.
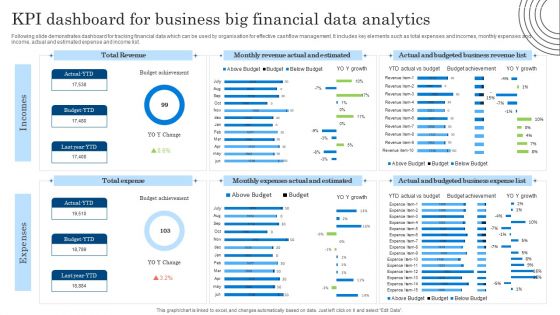
KPI Dashboard For Business Big Financial Data Analytics Diagrams PDF
Following slide demonstrates dashboard for tracking financial data which can be used by organisation for effective cashflow management. It includes key elements such as total expenses and incomes, monthly expenses and income, actual and estimated expense and income list. Showcasing this set of slides titled KPI Dashboard For Business Big Financial Data Analytics Diagrams PDF. The topics addressed in these templates are KPI Dashboard, Business Big Financial, Data Analytics. All the content presented in this PPT design is completely editable. Download it and make adjustments in color, background, font etc. as per your unique business setting.
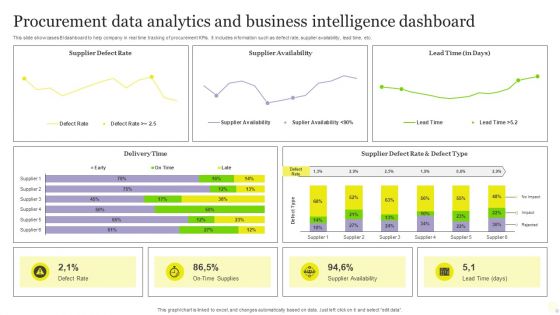
Procurement Data Analytics And Business Intelligence Dashboard Pictures PDF
This slide showcases BI dashboard to help company in real time tracking of procurement KPIs. It includes information such as defect rate, supplier availability, lead time, etc. Pitch your topic with ease and precision using this Procurement Data Analytics And Business Intelligence Dashboard Pictures PDF. This layout presents information on Procurement Data Analytics, Business Intelligence Dashboard. It is also available for immediate download and adjustment. So, changes can be made in the color, design, graphics or any other component to create a unique layout.

Business Customer Marketing Ppt Powerpoint Presentation Summary Background Image Cpb
This is a business customer marketing ppt powerpoint presentation summary background image cpb. This is a two stage process. The stages in this process are business to customer marketing.
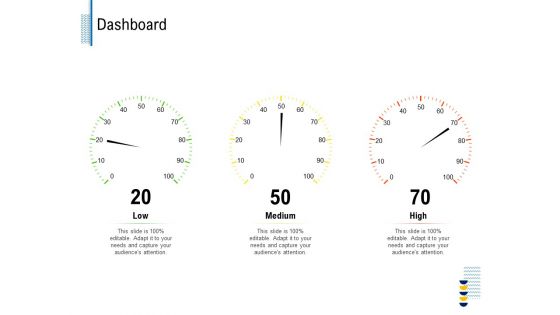
Fundamentals Of Business Organization Dashboard Ppt Portfolio Ideas PDF
This is a fundamentals of business organization dashboard ppt portfolio ideas pdf template with various stages. Focus and dispense information on three stages using this creative set, that comes with editable features. It contains large content boxes to add your information on topics like dashboard. You can also showcase facts, figures, and other relevant content using this PPT layout. Grab it now.
Business Intelligence Dashboard Icon To Analyze Industry Trends Topics PDF
Persuade your audience using this Business Intelligence Dashboard Icon To Analyze Industry Trends Topics PDF. This PPT design covers three stages, thus making it a great tool to use. It also caters to a variety of topics including Business Intelligence Dashboard Icon, Analyze Industry Trends. Download this PPT design now to present a convincing pitch that not only emphasizes the topic but also showcases your presentation skills.
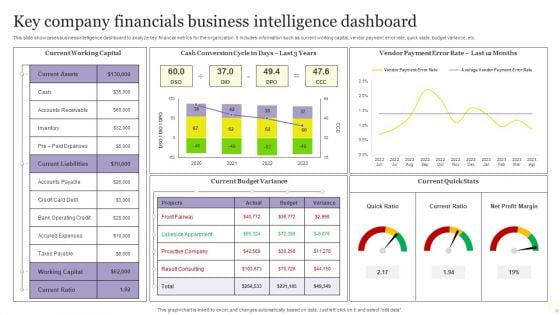
Key Company Financials Business Intelligence Dashboard Graphics PDF
This slide showcases business intelligence dashboard to analyze key financial metrics for the organization. It includes information such as current working capital, vendor payment error rate, quick stats, budget variance, etc. Showcasing this set of slides titled Key Company Financials Business Intelligence Dashboard Graphics PDF. The topics addressed in these templates are Key Company Financials, Business Intelligence Dashboard. All the content presented in this PPT design is completely editable. Download it and make adjustments in color, background, font etc. as per your unique business setting.
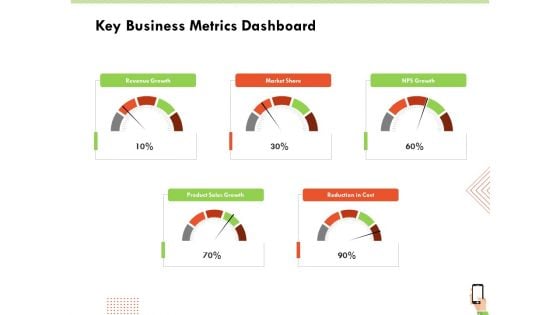
Multi Channel Online Commerce Key Business Metrics Dashboard Background PDF
Deliver and pitch your topic in the best possible manner with this multi channel online commerce key business metrics dashboard background pdf. Use them to share invaluable insights on revenue, market, sales, growth, cost and impress your audience. This template can be altered and modified as per your expectations. So, grab it now.

ETL Data Integration Monitoring Dashboard Data Integration Strategies For Business
This slide represents the dashboard to track the data integration implementation plan. The purpose of this slide is to showcase the ETL data integration tools, and the components include data sources, checks, last incident, and last check. Are you searching for a ETL Data Integration Monitoring Dashboard Data Integration Strategies For Business that is uncluttered, straightforward, and original Its easy to edit, and you can change the colors to suit your personal or business branding. For a presentation that expresses how much effort you have put in, this template is ideal With all of its features, including tables, diagrams, statistics, and lists, its perfect for a business plan presentation. Make your ideas more appealing with these professional slides. Download ETL Data Integration Monitoring Dashboard Data Integration Strategies For Business from Slidegeeks today. This slide represents the dashboard to track the data integration implementation plan. The purpose of this slide is to showcase the ETL data integration tools, and the components include data sources, checks, last incident, and last check.
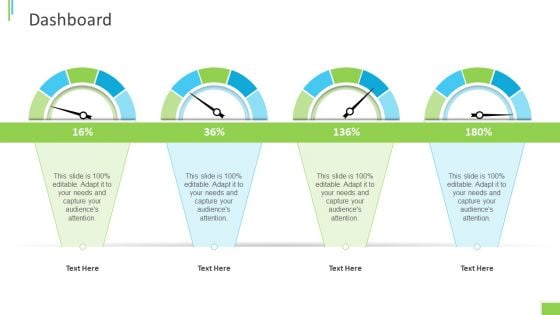
Business Overview PPT Slides Dashboard Ppt Slides Designs PDF
Presenting business overview ppt slides dashboard ppt slides designs pdf to provide visual cues and insights. Share and navigate important information on four stages that need your due attention. This template can be used to pitch topics like dashboard. In addtion, this PPT design contains high resolution images, graphics, etc, that are easily editable and available for immediate download.
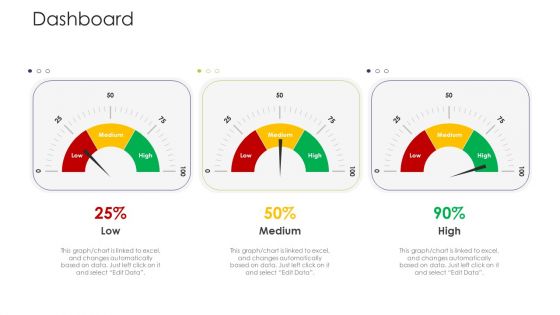
Business Venture Tactical Planning Complete PPT Deck Dashboard Elements PDF
This is a business venture tactical planning complete ppt deck dashboard elements pdf template with various stages. Focus and dispense information on three stages using this creative set, that comes with editable features. It contains large content boxes to add your information on topic like dashboard. You can also showcase facts, figures, and other relevant content using this PPT layout. Grab it now.
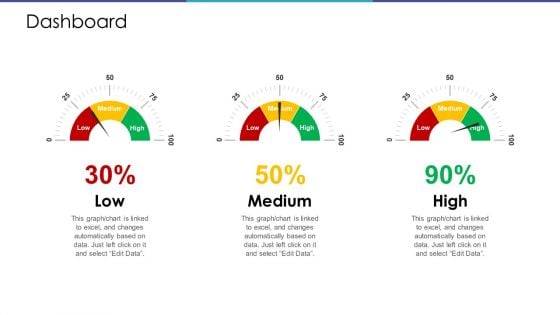
Merchandising Business Analysis Dashboard Ppt Infographics Guidelines PDF
This is a merchandising business analysis dashboard ppt infographics guidelines pdf. template with various stages. Focus and dispense information on three stages using this creative set, that comes with editable features. It contains large content boxes to add your information on topics like low, medium, high. You can also showcase facts, figures, and other relevant content using this PPT layout. Grab it now.
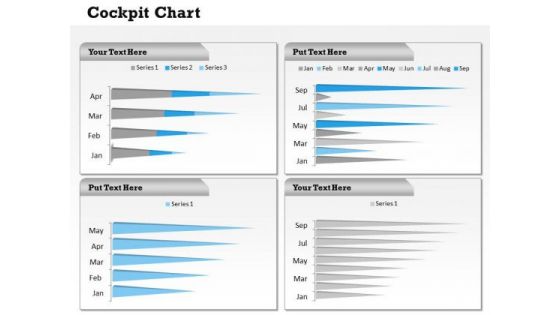
Business Diagram Dashboard Design For Data Management Marketing Diagram
Be The Doer With Our Business Diagram Dashboard Design For Data Management Marketing Diagram Powerpoint Templates. Put Your Thoughts Into Practice.
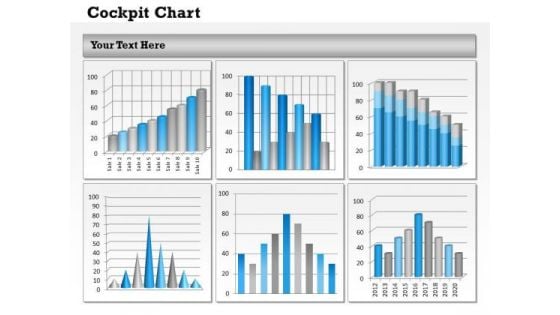
Consulting Diagram Dashboard To Visualize Business Data Consulting Diagram
Establish Your Dominion With Our Consulting Diagram Dashboard To Visualize Business Data Consulting Diagram Powerpoint Templates. Rule The Stage With Your Thoughts.
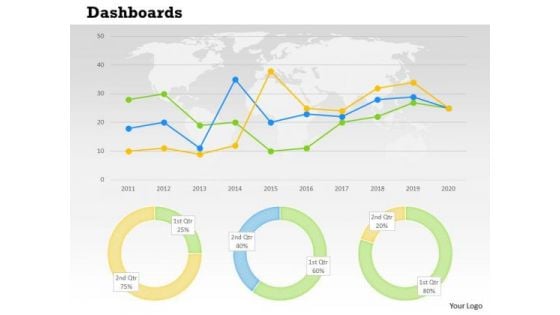
Sales Diagram Dashboard For Quantitative Business Data Consulting Diagram
Deliver The Right Dose With Our Sales Diagram Dashboard For Quantitative Business Data Consulting Diagram Powerpoint Templates. Your Ideas Will Get The Correct Illumination.
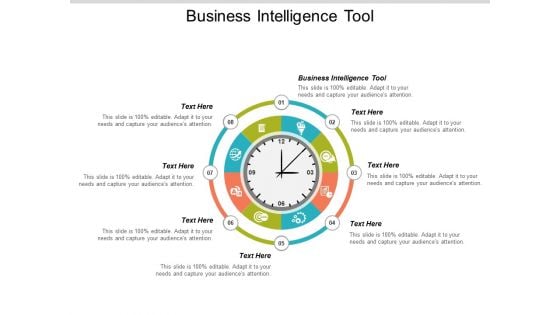
Business Intelligence Tool Ppt PowerPoint Presentation Outline Gridlines Cpb
This is a business intelligence tool ppt powerpoint presentation outline gridlines cpb. This is a eight stage process. The stages in this process are business intelligence tool.

Business Intelligence And Data Visualization Tools DT SS V
This slide presents various business intelligence and data visualization tools that help SMEs make better business decisions. It also mentions applications such as data analysis, exploration, visualization, reporting and dashboard creations.Present like a pro with Business Intelligence And Data Visualization Tools DT SS V. Create beautiful presentations together with your team, using our easy-to-use presentation slides. Share your ideas in real-time and make changes on the fly by downloading our templates. So whether you are in the office, on the go, or in a remote location, you can stay in sync with your team and present your ideas with confidence. With Slidegeeks presentation got a whole lot easier. Grab these presentations today. This slide presents various business intelligence and data visualization tools that help SMEs make better business decisions. It also mentions applications such as data analysis, exploration, visualization, reporting and dashboard creations.
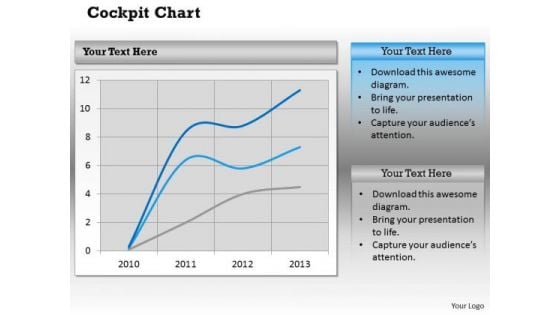
Business Framework Model Buisness Graph Dashboard Style Consulting Diagram
Get Out Of The Dock With Our Business Framework Model Business Graph Dashboard Style Consulting Diagram Powerpoint Templates. Your Mind Will Be Set Free.
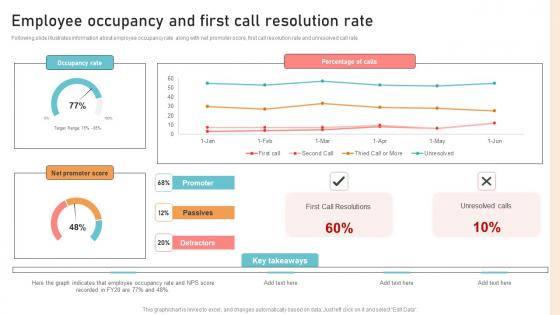
Optimizing Business Integration Employee Occupancy And First Call Demonstration Pdf
Following slide illustrates information about employee occupancy rate along with net promoter score, first call resolution rate and unresolved call rate. Whether you have daily or monthly meetings, a brilliant presentation is necessary. Optimizing Business Integration Employee Occupancy And First Call Demonstration Pdf can be your best option for delivering a presentation. Represent everything in detail using Optimizing Business Integration Employee Occupancy And First Call Demonstration Pdf and make yourself stand out in meetings. The template is versatile and follows a structure that will cater to your requirements. All the templates prepared by Slidegeeks are easy to download and edit. Our research experts have taken care of the corporate themes as well. So, give it a try and see the results. Following slide illustrates information about employee occupancy rate along with net promoter score, first call resolution rate and unresolved call rate.
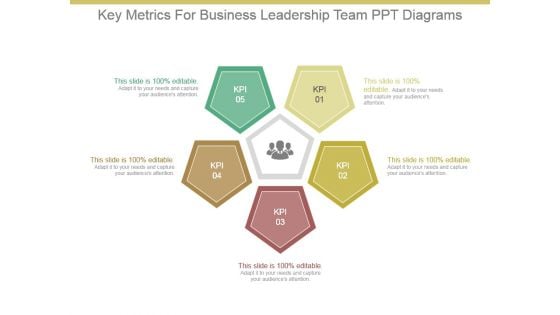
Key Metrics For Business Leadership Team Ppt Diagrams
This is a key metrics for business leadership team ppt diagrams. This is a five stage process. The stages in this process are kpi.
Key Business Metrics Dashboard Ppt Powerpoint Presentation Icon Graphics Design
This is a key business metrics dashboard ppt powerpoint presentation icon graphics design. This is a five stage process. The stages in this process are finance, marketing, management, investment, analysis.
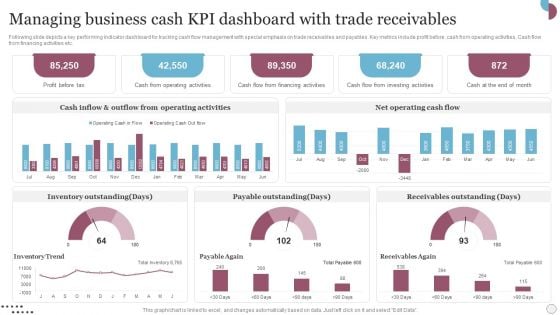
Managing Business Cash Kpi Dashboard With Trade Receivables Slides PDF
Following slide depicts a key performing indicator dashboard for tracking cash flow management with special emphasis on trade receivables and payables. Key metrics include profit before, cash from operating activities, Cash flow from financing activities etc. Showcasing this set of slides titled Managing Business Cash Kpi Dashboard With Trade Receivables Slides PDF. The topics addressed in these templates are Inventory Outstanding, Payable Outstanding, Receivables Outstanding. All the content presented in this PPT design is completely editable. Download it and make adjustments in color, background, font etc. as per your unique business setting.
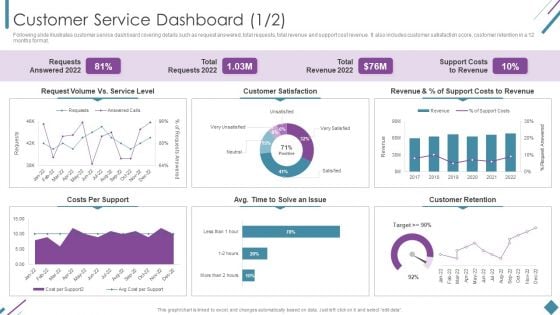
Metrics To Measure Business Performance Customer Service Dashboard Sample PDF
Following slide illustrates customer service dashboard covering details such as request answered, total requests, total revenue and support cost revenue. It also includes customer satisfaction score, customer retention in a 12 months format. Deliver and pitch your topic in the best possible manner with this Metrics To Measure Business Performance Customer Service Dashboard Sample PDF. Use them to share invaluable insights on Requests Answered 2022, Total Requests 2022, Total Revenue 2022 and impress your audience. This template can be altered and modified as per your expectations. So, grab it now.
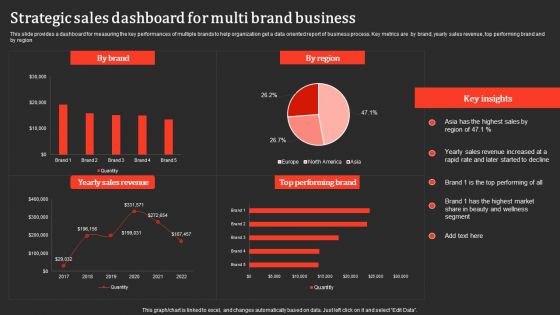
Strategic Sales Dashboard For Multi Brand Business Professional PDF
This slide provides a dashboard for measuring the key performances of multiple brands to help organization get a data oriented report of business process. Key metrics are by brand, yearly sales revenue, top performing brand and by region. Pitch your topic with ease and precision using this Strategic Sales Dashboard For Multi Brand Business Professional PDF. This layout presents information on Yearly Sales Revenue, Performing Brand. It is also available for immediate download and adjustment. So, changes can be made in the color, design, graphics or any other component to create a unique layout.
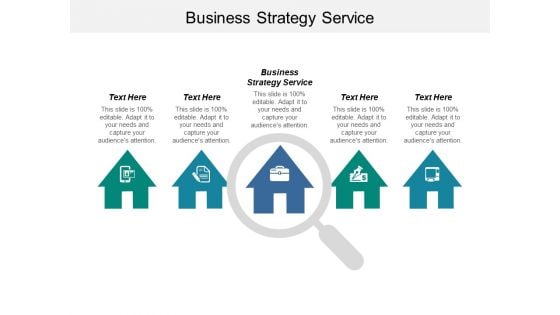
Business Strategy Service Ppt PowerPoint Presentation Pictures Background Images Cpb
This is a business strategy service ppt powerpoint presentation pictures background images cpb. This is a five stage process. The stages in this process are business strategy service.
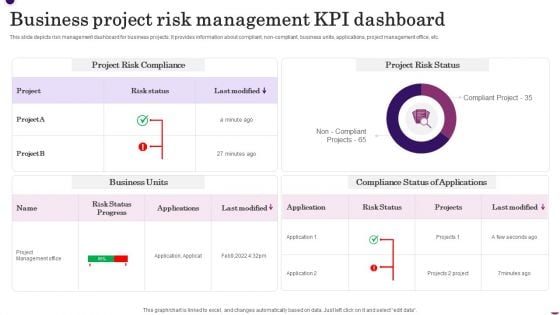
Business Project Risk Management KPI Dashboard Inspiration PDF
This slide depicts risk management dashboard for business projects. It provides information about compliant, non-compliant, business units, applications, project management office, etc. Showcasing this set of slides titled Business Project Risk Management KPI Dashboard Inspiration PDF. The topics addressed in these templates areProject Risk Compliance, Project Risk Status, Business Units . All the content presented in this PPT design is completely editable. Download it and make adjustments in color, background, font etc. as per your unique business setting.
Business Performance Dashboard Vector Icon Ppt PowerPoint Presentation Portfolio Inspiration
Presenting this set of slides with name business performance dashboard vector icon ppt powerpoint presentation portfolio inspiration. This is a three stage process. The stages in this process are business performance, dashboard vector icon. This is a completely editable PowerPoint presentation and is available for immediate download. Download now and impress your audience.
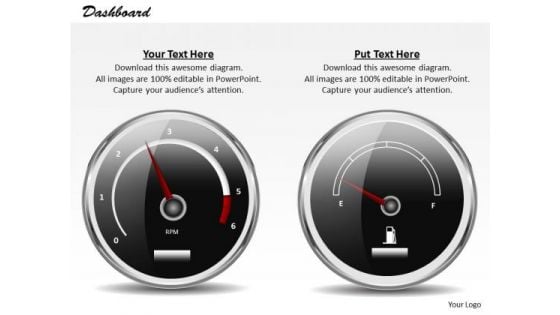
Business Cycle Diagram Dashboard Design To Communicate Effectively Strategy Diagram
Get Out Of The Dock With Our Business Cycle Diagram Dashboard Design To Communicate Effectively Strategy Diagram Powerpoint Templates. Your Mind Will Be Set Free.
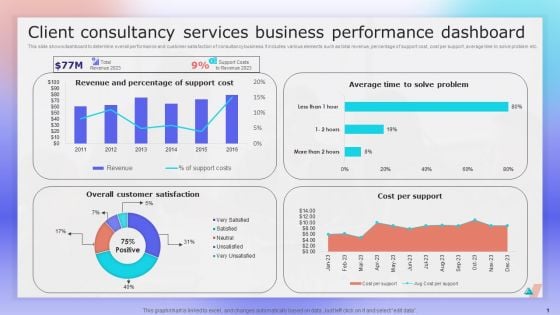
Client Consultancy Services Business Performance Dashboard Ppt File Layout PDF
This slide shows dashboard to determine overall performance and customer satisfaction of consultancy business. It includes various elements such as total revenue, percentage of support cost, cost per support, average time to solve problem etc. Showcasing this set of slides titled Client Consultancy Services Business Performance Dashboard Ppt File Layout PDF. The topics addressed in these templates are Revenue And Percentage, Support Cost, Cost Per Support. All the content presented in this PPT design is completely editable. Download it and make adjustments in color, background, font etc. as per your unique business setting.
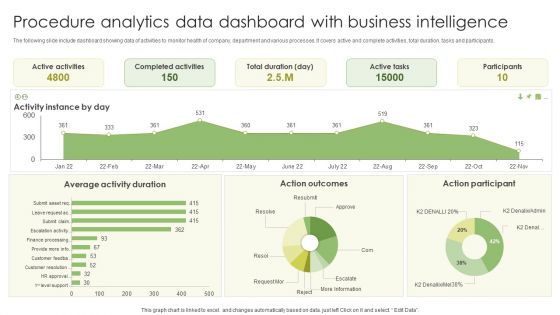
Procedure Analytics Data Dashboard With Business Intelligence Slides PDF
The following slide include dashboard showing data of activities to monitor health of company, department and various processes. It covers active and complete activities, total duration, tasks and participants. Pitch your topic with ease and precision using this Procedure Analytics Data Dashboard With Business Intelligence Slides PDF. This layout presents information on Active Activities, Completed Activities, Active Tasks . It is also available for immediate download and adjustment. So, changes can be made in the color, design, graphics or any other component to create a unique layout.
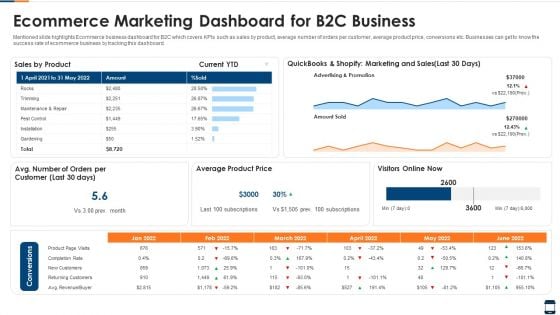
Ecommerce Marketing Dashboard For B2C Business Information PDF
Mentioned slide highlights Ecommerce business dashboard for B2C which covers KPIs such as sales by product, average number of orders per customer, average product price, conversions etc. Businesses can get to know the success rate of ecommerce business by tracking this dashboard. Showcasing this set of slides titled ecommerce marketing dashboard for b2c business information pdf. The topics addressed in these templates are ecommerce marketing dashboard for b2c business. All the content presented in this PPT design is completely editable. Download it and make adjustments in color, background, font etc. as per your unique business setting.
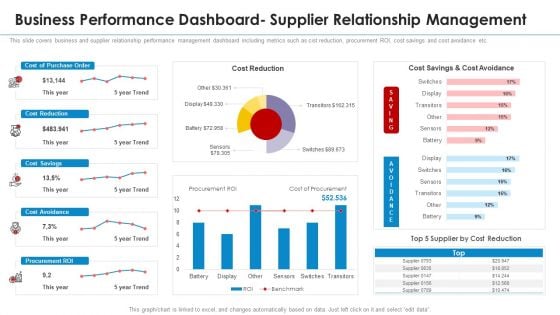
Business Performance Dashboard Supplier Relationship Management Background PDF
This slide covers business and supplier relationship performance management dashboard including metrics such as cist reduction, procurement ROI, cost savings and cost avoidance etc. Deliver an awe inspiring pitch with this creative business performance dashboard supplier relationship management background pdf bundle. Topics like business performance dashboard supplier relationship management can be discussed with this completely editable template. It is available for immediate download depending on the needs and requirements of the user.
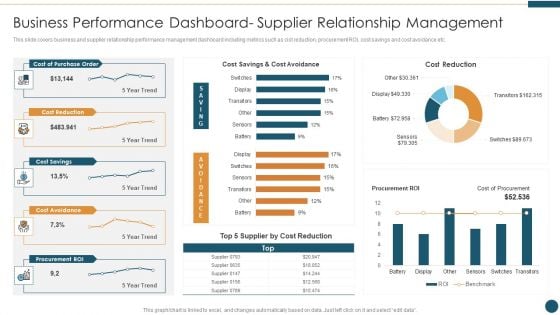
Supplier Relationship Management Business Performance Dashboard Supplier Formats PDF
This slide covers business and supplier relationship performance management dashboard including metrics such as cist reduction, procurement ROI, cost savings and cost avoidance etc. Deliver and pitch your topic in the best possible manner with this Supplier Relationship Management Business Performance Dashboard Supplier Formats PDF Use them to share invaluable insights on Business Performance Dashboard Supplier Relationship Management and impress your audience. This template can be altered and modified as per your expectations. So, grab it now.
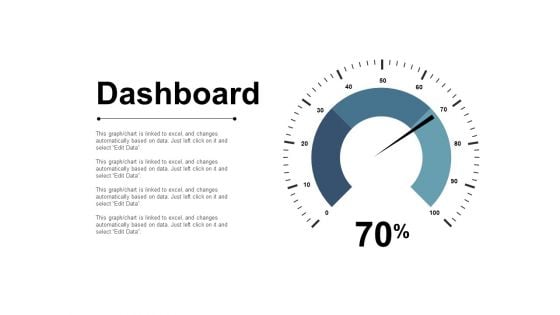
70 Dashboard Business Management Ppt PowerPoint Presentation Model Portfolio
This is a 70 dashboard business management ppt powerpoint presentation model portfolio. This is a four stage process. The stages in this process are dashboard, business, marketing, management, planning.
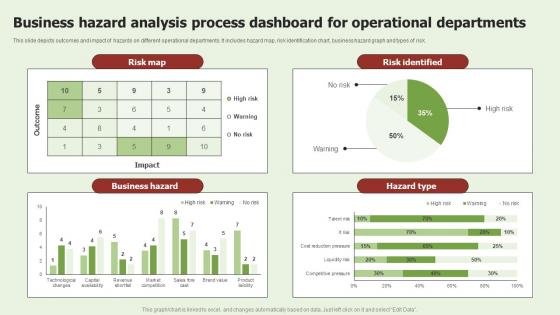
Business Hazard Analysis Process Dashboard For Operational Departments Microsoft Pdf
This slide depicts outcomes and impact of hazards on different operational departments. It includes hazard map, risk identification chart, business hazard graph and types of risk. Pitch your topic with ease and precision using this Business Hazard Analysis Process Dashboard For Operational Departments Microsoft Pdf. This layout presents information on Risk Map, Business Hazard, Hazard Type. It is also available for immediate download and adjustment. So, changes can be made in the color, design, graphics or any other component to create a unique layout. This slide depicts outcomes and impact of hazards on different operational departments. It includes hazard map, risk identification chart, business hazard graph and types of risk.
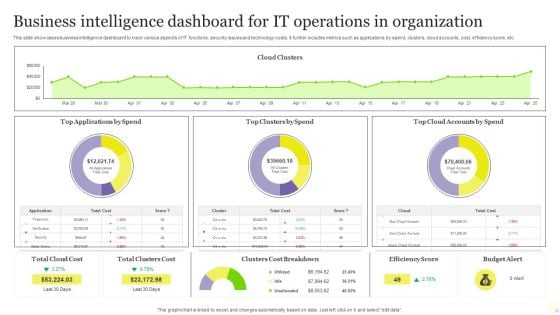
Business Intelligence Dashboard For It Operations In Organization Themes PDF
This slide showcases business intelligence dashboard to track various aspects of IT functions, security issues and technology costs. It further includes metrics such as applications by spend, clusters, cloud accounts, cost, efficiency score, etc. Showcasing this set of slides titled Business Intelligence Dashboard For It Operations In Organization Themes PDF. The topics addressed in these templates are Business Intelligence Dashboard, IT Operations, Organization. All the content presented in this PPT design is completely editable. Download it and make adjustments in color, background, font etc. as per your unique business setting.
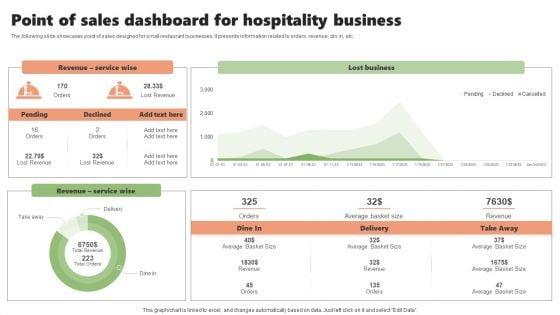
Point Of Sales Dashboard For Hospitality Business Slides PDF
The following slide showcases point of sales designed for small restaurant businesses. It presents information related to orders, revenue, din in, etc. Showcasing this set of slides titled Point Of Sales Dashboard For Hospitality Business Slides PDF. The topics addressed in these templates are Revenue Service Wise, Lost Business, Hospitality Business. All the content presented in this PPT design is completely editable. Download it and make adjustments in color, background, font etc. as per your unique business setting.

Call Center Business Plan Go To Market Strategy
You can survive and sail through cut-throat competition if you have the right skills and products at hand. If a business plan is on your upcoming agenda, then it will not be wise of you to proceed in absence of our well-designed Call Center Business Plan Go To Market Strategy document. Our business plan word document swears by in-depth detailing and thus answers every question that may hit you or your audience at any point of time. Whats more, are the multi-fold benefits that our word document offers. Made up of high-resolution graphics, this document does not hamper when projected on a wide screen. Being pre-designed and thoroughly editable this ready-made business plan saves a lot of the presenters time and efforts which otherwise get wasted in designing the business plan from scratch. We make our business plan word documents available to you keeping in mind the competitive edge. Join your hands with us now.
Business KPI Dashboard Ppt PowerPoint Presentation Styles Deck Cpb
This is a business kpi dashboard ppt powerpoint presentation styles deck cpb. This is a four stage process. The stages in this process are business kpi dashboard.
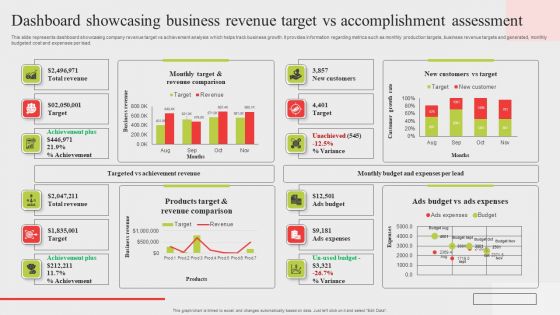
Dashboard Showcasing Business Revenue Target Vs Accomplishment Assessment Information PDF
This slide represents dashboard showcasing company revenue target vs achievement analysis which helps track business growth. It provides information regarding metrics such as monthly production targets, business revenue targets and generated, monthly budgeted cost and expenses per lead. Showcasing this set of slides titled Dashboard Showcasing Business Revenue Target Vs Accomplishment Assessment Information PDF. The topics addressed in these templates are Total Revenue, Target, Achievement. All the content presented in this PPT design is completely editable. Download it and make adjustments in color, background, font etc. as per your unique business setting.

Business Analysis Requirements Gathering Dashboard Diagram Ppt Example
This is a business analysis requirements gathering dashboard diagram ppt example. This is a five stage process. The stages in this process are business, marketing, presentation, success, management.
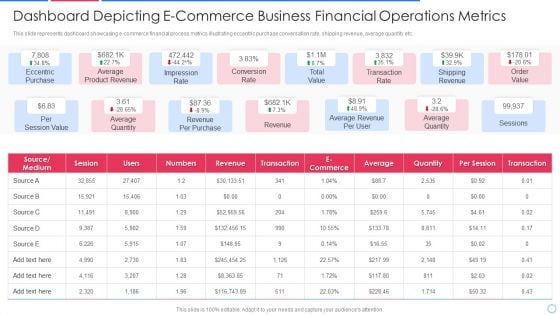
Dashboard Depicting E-Commerce Business Financial Operations Metrics Topics PDF
This slide represents dashboard showcasing e-commerce financial process metrics illustrating eccentric purchase conversation rate, shipping revenue, average quantity etc.Showcasing this set of slides titled dashboard depicting e-commerce business financial operations metrics topics pdf The topics addressed in these templates are eccentric purchase, average product revenue, impression rate All the content presented in this PPT design is completely editable. Download it and make adjustments in color, background, font etc. as per your unique business setting.
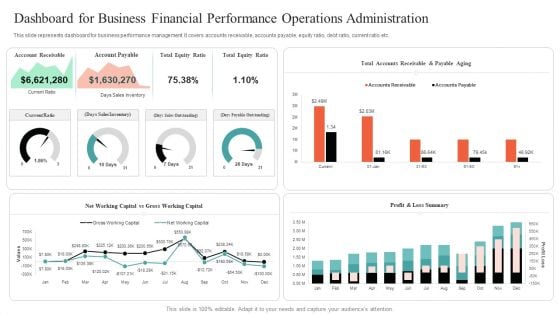
Dashboard For Business Financial Performance Operations Administration Mockup PDF
This slide represents dashboard for business performance management. It covers accounts receivable, accounts payable, equity ratio, debt ratio, current ratio etc. Showcasing this set of slides titled Dashboard For Business Financial Performance Operations Administration Mockup PDF. The topics addressed in these templates are Dashboard For Business Financial, Performance Operations Administration. All the content presented in this PPT design is completely editable. Download it and make adjustments in color, background, font etc. as per your unique business setting.
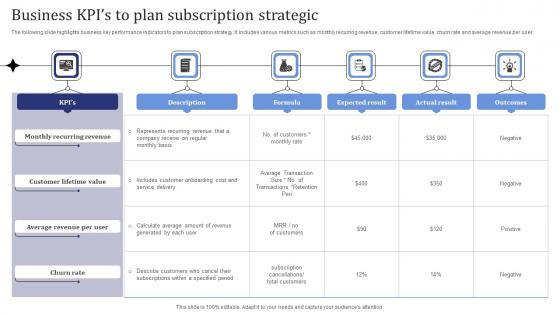
Business Kpis To Plan Subscription Strategic Pictures Pdf
The following slide highlights business key performance indicators to plan subscription strategy. It includes various metrics such as monthly recurring revenue, customer lifetime value, churn rate and average revenue per user. Showcasing this set of slides titled Business Kpis To Plan Subscription Strategic Pictures Pdf. The topics addressed in these templates are Monthly Recurring Revenue, Customer Lifetime Value, Churn Rate. All the content presented in this PPT design is completely editable. Download it and make adjustments in color, background, font etc. as per your unique business setting. The following slide highlights business key performance indicators to plan subscription strategy. It includes various metrics such as monthly recurring revenue, customer lifetime value, churn rate and average revenue per user.
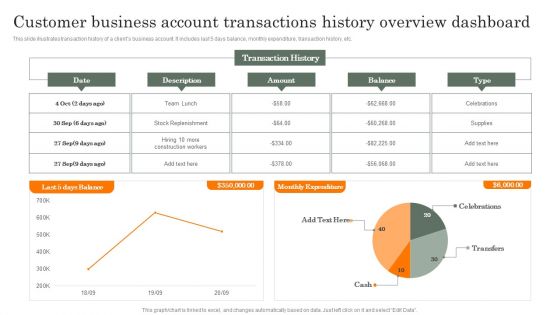
Customer Business Account Transactions History Overview Dashboard Guidelines PDF
This slide illustrates transaction history of a clients business account. It includes last 5 days balance, monthly expenditure, transaction history, etc. Showcasing this set of slides titled Customer Business Account Transactions History Overview Dashboard Guidelines PDF. The topics addressed in these templates are Customer Business, Account Transactions, History Overview. All the content presented in this PPT design is completely editable. Download it and make adjustments in color, background, font etc. as per your unique business setting.
Business Partner Lifecycle Management Dashboard Icon Rules PDF
Showcasing this set of slides titled Business Partner Lifecycle Management Dashboard Icon Rules PDF. The topics addressed in these templates are Management Dashboard Icon, Business Partner Lifecycle. All the content presented in this PPT design is completely editable. Download it and make adjustments in color, background, font etc. as per your unique business setting.
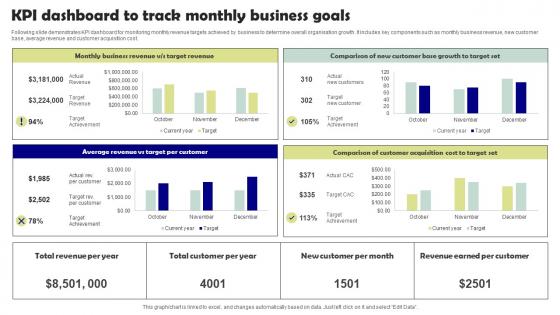
KPI Dashboard To Track Monthly Business Goals Microsoft Pdf
Following slide demonstrates KPI dashboard for monitoring monthly revenue targets achieved by business to determine overall organisation growth. It includes key components such as monthly business revenue, new customer base, average revenue and customer acquisition cost. Pitch your topic with ease and precision using this KPI Dashboard To Track Monthly Business Goals Microsoft Pdf. This layout presents information on Target Per Customer, Target Set. It is also available for immediate download and adjustment. So, changes can be made in the color, design, graphics or any other component to create a unique layout. Following slide demonstrates KPI dashboard for monitoring monthly revenue targets achieved by business to determine overall organisation growth. It includes key components such as monthly business revenue, new customer base, average revenue and customer acquisition cost.

Call Center Business PowerPoint Templates And PowerPoint Backgrounds 0811
Microsoft PowerPoint Template and Background with call center business team in an office full of computers Teach your team with our Call Center Business PowerPoint Templates And PowerPoint Backgrounds 0811. Download without worries with our money back guaranteee.

Call Center Business PowerPoint Themes And PowerPoint Slides 0811
Microsoft PowerPoint Theme and Slide with call center business team in an office full of computers People often criticise without any cause. With our Call Center Business PowerPoint Themes And PowerPoint Slides 0811 you won't give a fig.
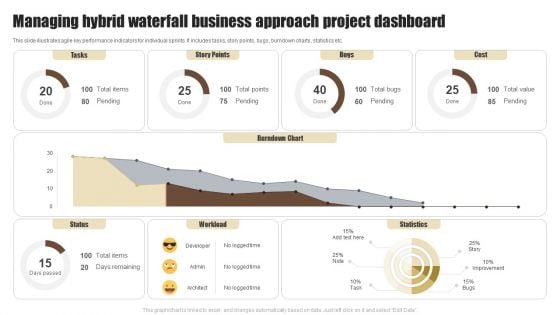
Managing Hybrid Waterfall Business Approach Project Dashboard Summary PDF
This slide illustrates agile key performance indicators for individual sprints. It includes tasks, story points, bugs, burndown charts, statistics etc. Showcasing this set of slides titled Managing Hybrid Waterfall Business Approach Project Dashboard Summary PDF. The topics addressed in these templates are Tasks, Story Points, Bugs. All the content presented in this PPT design is completely editable. Download it and make adjustments in color, background, font etc. as per your unique business setting.
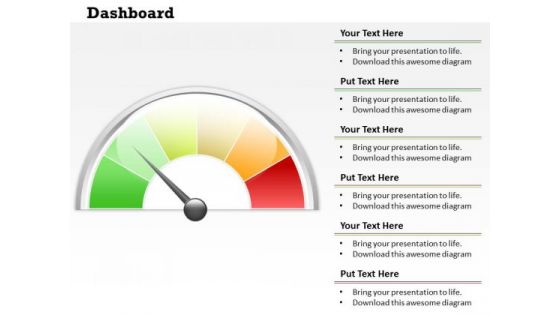
Sales Diagram Dashboard Visual Iinformation Design Business Cycle Diagram
Establish The Dominance Of Your Ideas. Our Sales Diagram Dashboard Visual Information Design Business Cycle Diagram Powerpoint Templates Will Put Them On Top.
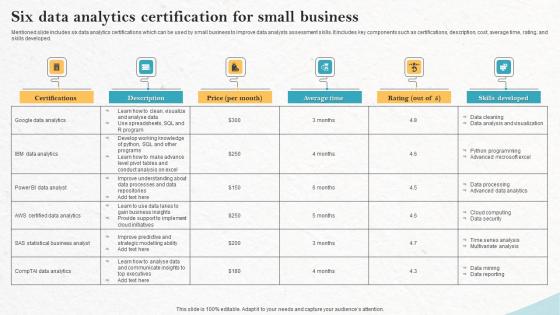
Six Data Analytics Certification For Small Business Pictures Pdf
Mentioned slide includes six data analytics certifications which can be used by small business to improve data analysts assessment skills. It includes key components such as certifications, description, cost, average time, rating, and skills developed. Showcasing this set of slides titled Six Data Analytics Certification For Small Business Pictures Pdf. The topics addressed in these templates are Six Data Analytics, Certification For Small Business, Skills Developed, Analysts Assessment Skills. All the content presented in this PPT design is completely editable. Download it and make adjustments in color, background, font etc. as per your unique business setting. Mentioned slide includes six data analytics certifications which can be used by small business to improve data analysts assessment skills. It includes key components such as certifications, description, cost, average time, rating, and skills developed.
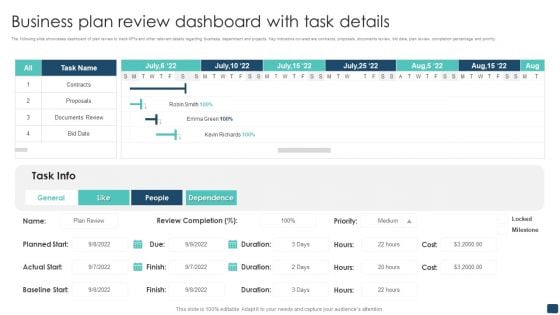
Business Plan Review Dashboard With Task Details Sample PDF
The following slide showcases dashboard of plan review to track KPIs and other relevant details regarding business, department and projects. Key indicators covered are contracts, proposals, documents review, bid date, plan review, completion percentage and priority. Pitch your topic with ease and precision using this Business Plan Review Dashboard With Task Details Sample PDF. This layout presents information on Business Plan Review, Dashboard With Task Details. It is also available for immediate download and adjustment. So, changes can be made in the color, design, graphics or any other component to create a unique layout.
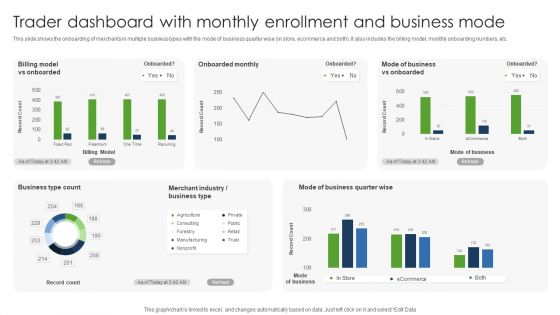
Trader Dashboard With Monthly Enrollment And Business Mode Professional PDF
This slide shows the onboarding of merchants in multiple business types with the mode of business quarter wise in store, ecommerce and both. It also includes the billing model, monthly onboarding numbers, etc. Showcasing this set of slides titled Trader Dashboard With Monthly Enrollment And Business Mode Professional PDF. The topics addressed in these templates are Monthly Enrollment, Business Mode, Trader Dashboard. All the content presented in this PPT design is completely editable. Download it and make adjustments in color, background, font etc. as per your unique business setting.
Pie Chart With Icons For Business Analysis Powerpoint Slides
This dashboard template contains graphics of pie chart with icons. This dashboard PowerPoint template helps to display business analysis in a visual manner. Download this template to make impressive presentations.
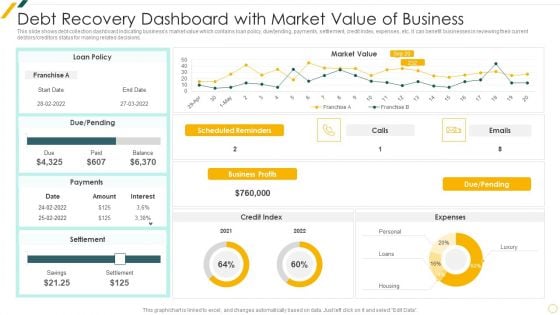
Debt Recovery Dashboard With Market Value Of Business Template PDF
This slide shows debt collection dashboard indicating businesss market value which contains loan policy, due ending, payments, settlement, credit index, expenses, etc. It can benefit businesses in reviewing their current debtors creditors status for making related decisions.Showcasing this set of slides titled Debt Recovery Dashboard With Market Value Of Business Template PDF The topics addressed in these templates are Debt Recovery, Dashboard Market, Value Of Business All the content presented in this PPT design is completely editable. Download it and make adjustments in color, background, font etc. as per your unique business setting.
Generate Digitalization Roadmap For Business Icons Slide Inspiration PDF
Help your business to create an attention grabbing presentation using our generate digitalization roadmap for business digital vitality dashboard diagrams pdf set of slides. The slide contains innovative icons that can be flexibly edited. Choose this generate digitalization roadmap for business digital vitality dashboard diagrams pdf template to create a satisfactory experience for your customers. Go ahead and click the download button.
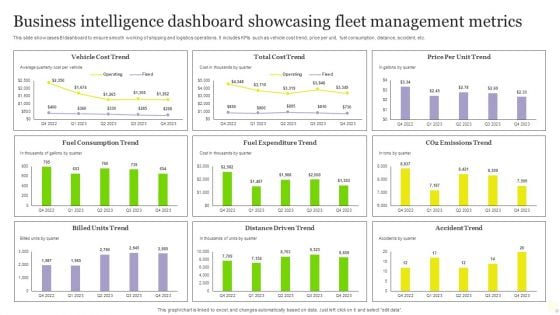
Business Intelligence Dashboard Showcasing Fleet Management Metrics Elements PDF
This slide showcases BI dashboard to ensure smooth working of shipping and logistics operations. It includes KPIs such as vehicle cost trend, price per unit, fuel consumption, distance, accident, etc. Showcasing this set of slides titled Business Intelligence Dashboard Showcasing Fleet Management Metrics Elements PDF. The topics addressed in these templates are Cost Trend, Price Per Unit Trend, Vehicle Cost Trend. All the content presented in this PPT design is completely editable. Download it and make adjustments in color, background, font etc. as per your unique business setting.
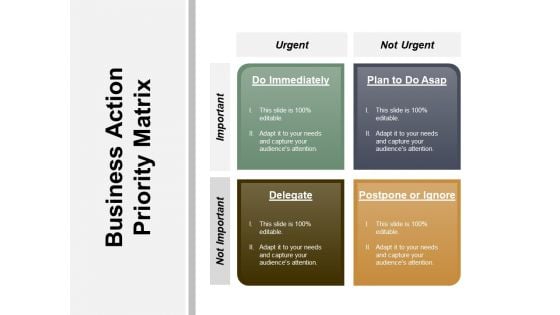
Business Action Priority Matrix Ppt PowerPoint Presentation Pictures Designs
This is a business action priority matrix ppt powerpoint presentation pictures designs. This is a four stage process. The stages in this process are business goals, business objectives, business priorities.
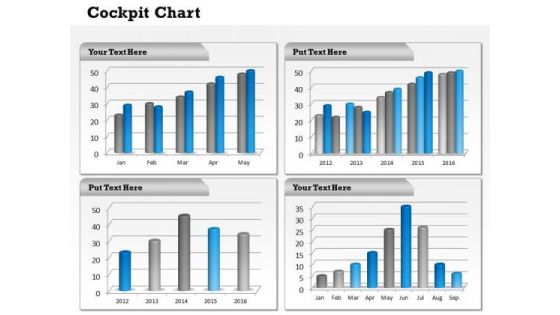
Marketing Diagram Dashboard Design For Business Sales Diagram
Your Listeners Will Never Doodle. Our Marketing Diagram Dashboard Design For Business Sales Diagram Powerpoint Templates Will Hold Their Concentration.


 Continue with Email

 Home
Home


