Business Snapshot
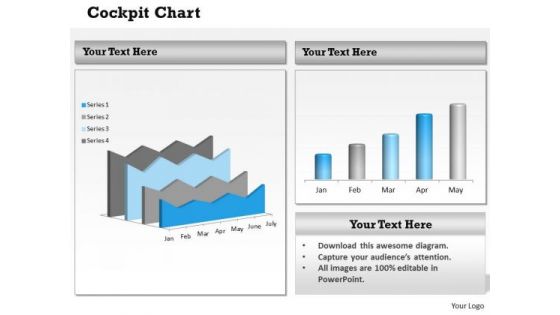
Consulting Diagram Business Dashboard Design Chart Sales Diagram
Document The Process On Our Consulting Diagram Business Dashboard Design Chart Sales Diagram Powerpoint Templates. Make A Record Of Every Detail.
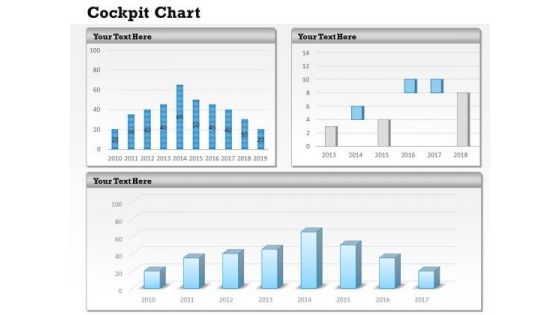
Marketing Diagram Business Intelligence Dashboard Design Sales Diagram
Our Marketing Diagram Business Intelligence Dashboard Design Sales Diagram Powerpoint Templates Team Are A Dogged Lot. They Keep At It Till They Get It Right.
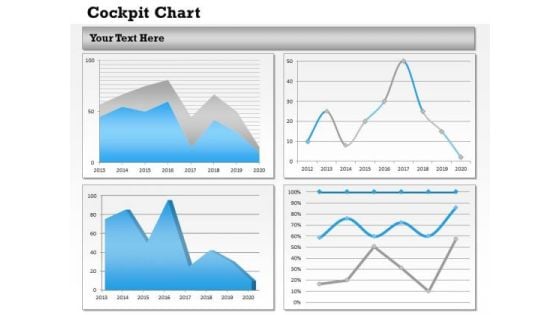
Mba Models And Frameworks Business Reports And Dashboards Consulting Diagram
Get The Doers Into Action. Activate Them With Our MBA Models And Frameworks Business Reports And Dashboards Consulting Diagram Powerpoint Templates.
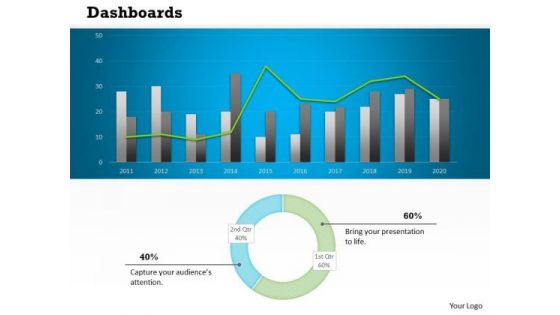
Sales Diagram Business Charts Dashboard Design Strategic Management
Put In A Dollop Of Our Sales Diagram Business Charts Dashboard Design Strategic Management Powerpoint Templates. Give Your Thoughts A Distinctive Flavor.
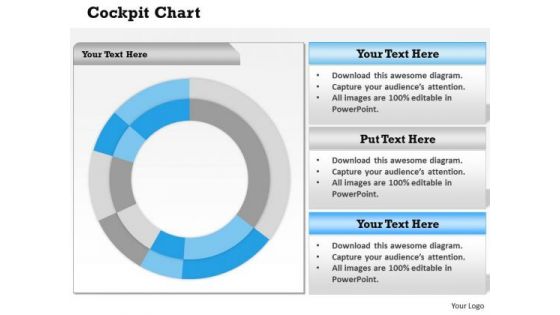
Sales Diagram Business Reports In Dashboard Style Strategic Management
Get The Domestics Right With Our Sales Diagram Business Reports In Dashboard Style Strategic Management Powerpoint Templates. Create The Base For Thoughts To Grow.
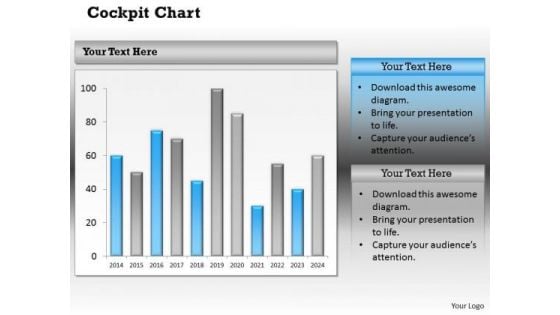
Business Cycle Diagram Dashboard For Executive Reports Strategy Diagram
Document Your Views On Our Business Cycle Diagram Dashboard For Executive Reports Strategy Diagram Powerpoint Templates. They Will Create A Strong Impression.
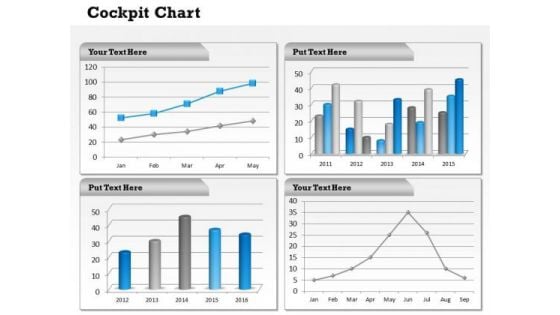
Consulting Diagram Dashboard Layout For Business Reporting Sales Diagram
Dominate Proceedings With Your Ideas. Our Consulting Diagram Dashboard Layout For Business Reporting Sales Diagram Powerpoint Templates Will Empower Your Thoughts.
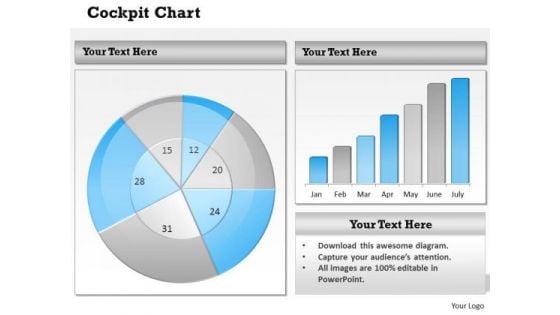
Mba Models And Frameworks Dashboard Layout Business Design Sales Diagram
Open Up Doors That Lead To Success. Our MBA Models And Frameworks Dashboard Layout Business Design Sales Diagram Powerpoint Templates Provide The Handles.
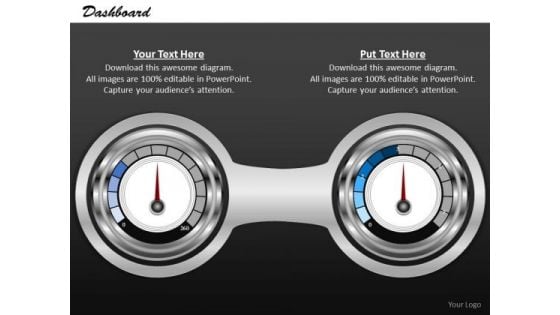
Mba Models And Frameworks Dashboard To Compare Information Business Diagram
Our MBA Models And Frameworks Dashboard To compare Information Business Diagram Powerpoint Templates Abhor Doodling. They Never Let The Interest Flag.
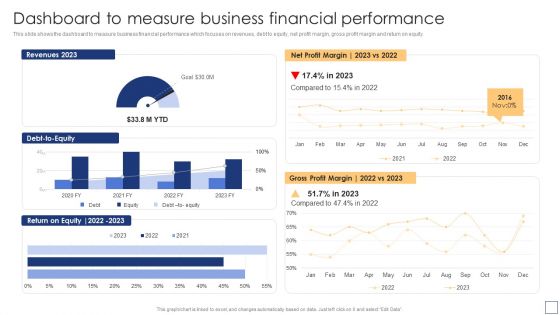
Dashboard To Measure Business Financial Performance Summary PDF
This slide shows the dashboard to measure business financial performance which focuses on revenues, debt to equity, net profit margin, gross profit margin and return on equity. Are you searching for a Dashboard To Measure Business Financial Performance Summary PDF that is uncluttered, straightforward, and original Its easy to edit, and you can change the colors to suit your personal or business branding. For a presentation that expresses how much effort youve put in, this template is ideal With all of its features, including tables, diagrams, statistics, and lists, its perfect for a business plan presentation. Make your ideas more appealing with these professional slides. Download Dashboard To Measure Business Financial Performance Summary PDF from Slidegeeks today.
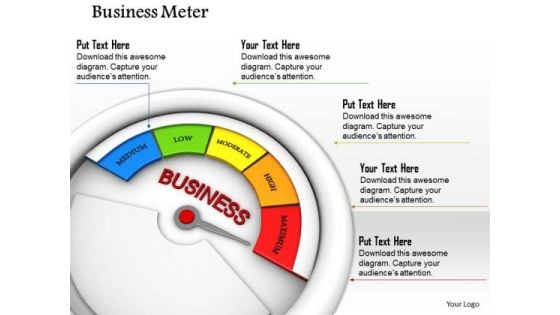
Stock Photo Business Meter Displaying Maximum Value PowerPoint Slide
This PowerPoint slide displays business meter displaying maximum value. This image slide has been crafted with graphic of business meter with values. This image depicts business progress. Use this image slide to express views on success and achievements in your presentations. This image slide may also be used to display successful business model. Enhance the quality of your presentations using this image.
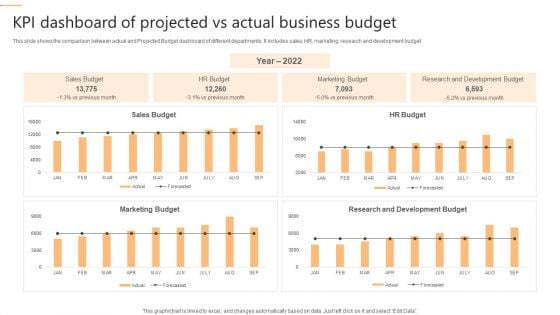
KPI Dashboard Of Projected Vs Actual Business Budget Pictures PDF
This slide shows the comparison between actual and Projected Budget dashboard of different departments. It includes sales, HR, marketing, research and development budget. Showcasing this set of slides titled KPI Dashboard Of Projected Vs Actual Business Budget Pictures PDF. The topics addressed in these templates are Marketing Budget, Development Budget, Sales Budget. All the content presented in this PPT design is completely editable. Download it and make adjustments in color, background, font etc. as per your unique business setting.
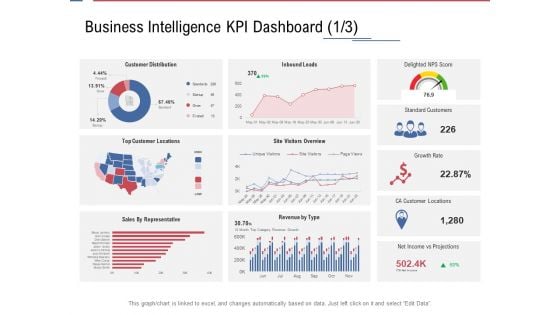
Data Assimilation Business Intelligence KPI Dashboard Score Ppt Graphics PDF
Deliver and pitch your topic in the best possible manner with this data assimilation business intelligence kpi dashboard score ppt graphics pdf. Use them to share invaluable insights on revenue, projections, locations, growth, sales and impress your audience. This template can be altered and modified as per your expectations. So, grab it now.
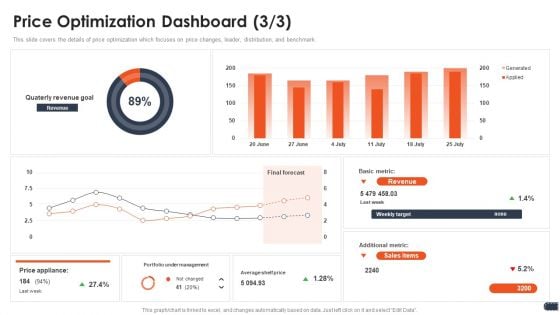
Business Pricing Model Price Optimization Dashboard Metric Clipart PDF
This slide covers the details of price optimization which focuses on price changes, leader, distribution, and benchmark. Deliver and pitch your topic in the best possible manner with this business pricing model price optimization dashboard metric clipart pdf. Use them to share invaluable insights on portfolio, management, price, revenue, target and impress your audience. This template can be altered and modified as per your expectations. So, grab it now.
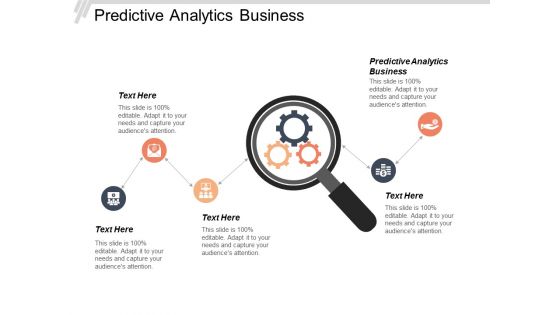
Predictive Analytics Business Ppt Powerpoint Presentation Gallery Shapes Cpb
This is a predictive analytics business ppt powerpoint presentation gallery shapes cpb. This is a five stage process. The stages in this process are predictive analytics business.
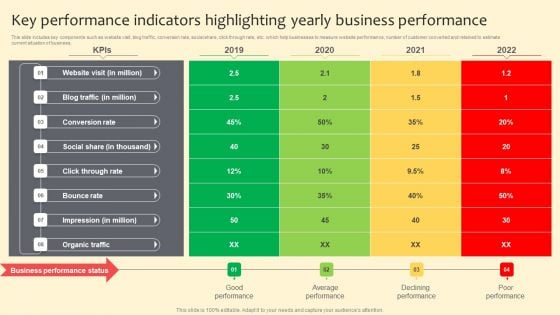
Key Performance Indicators Highlighting Yearly Business Performance Portrait PDF
This slide includes key components such as website visit, blog traffic, conversion rate, social share, click through rate, etc. which help businesses to measure website performance, number of customer converted and retained to estimate current situation of business. Create an editable Key Performance Indicators Highlighting Yearly Business Performance Portrait PDF that communicates your idea and engages your audience. Whether you are presenting a business or an educational presentation, pre designed presentation templates help save time. Key Performance Indicators Highlighting Yearly Business Performance Portrait PDF is highly customizable and very easy to edit, covering many different styles from creative to business presentations. Slidegeeks has creative team members who have crafted amazing templates. So, go and get them without any delay.
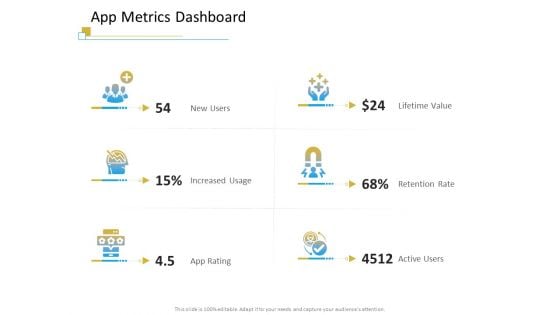
Successful Mobile Strategies For Business App Metrics Dashboard Microsoft PDF
Presenting successful mobile strategies for business app metrics dashboard microsoft pdf to provide visual cues and insights. Share and navigate important information on six stages that need your due attention. This template can be used to pitch topics like app metrics dashboard. In addtion, this PPT design contains high resolution images, graphics, etc, that are easily editable and available for immediate download.
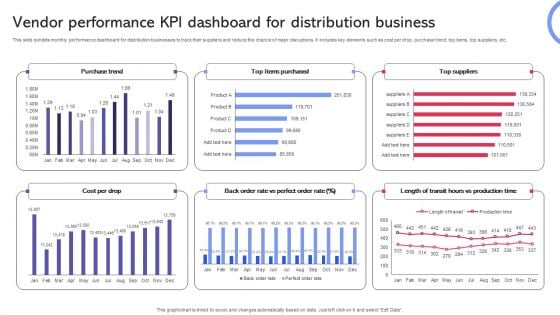
Vendor Performance KPI Dashboard For Distribution Business Formats PDF
This slide exhibits monthly performance dashboard for distribution businesses to track their suppliers and reduce the chance of major disruptions. It includes key elements such as cost per drop, purchase trend, top items, top suppliers, etc. Showcasing this set of slides titled Vendor Performance KPI Dashboard For Distribution Business Formats PDF. The topics addressed in these templates are Purchase Trend, Suppliers, Distribution Business. All the content presented in this PPT design is completely editable. Download it and make adjustments in color, background, font etc. as per your unique business setting.
Business Analysis Review And Segmentation Powerpoint Slide Templates Download
This is a business analysis review and segmentation powerpoint slide templates download. This is a four stage process. The stages in this process are magnifier, technology, marketing, analysis, business.
Business Team Leaders Introduction Ppt PowerPoint Presentation Pictures
This is a business team leaders introduction ppt powerpoint presentation pictures. This is a five stage process. The stages in this process are business, team, leaders, introduction, communication.
Business Data Sources Ppt PowerPoint Presentation Complete Deck With Slides
Presenting this set of slides with name business data sources ppt powerpoint presentation complete deck with slides. The topics discussed in these slides are databases, investment, business profits, analyst reports, information. This is a completely editable PowerPoint presentation and is available for immediate download. Download now and impress your audience.
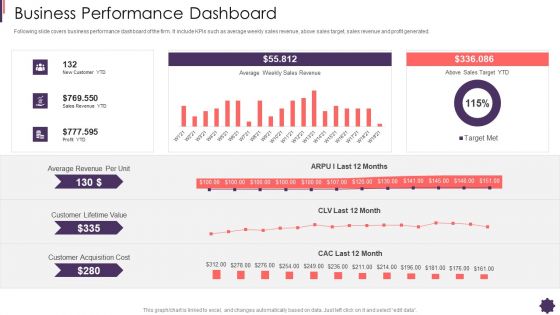
Business Performance Dashboard Brand Techniques Structure Introduction PDF
Following slide covers business performance dashboard of the firm. It include KPIs such as average weekly sales revenue, above sales target, sales revenue and profit generated. Deliver an awe inspiring pitch with this creative business performance dashboard brand techniques structure introduction pdf bundle. Topics like average, revenue, sales, profit, cost can be discussed with this completely editable template. It is available for immediate download depending on the needs and requirements of the user.
Online Business Program Icons Slide Ppt Model Pictures PDF
Help your business to create an attention-grabbing presentation using our online business program icons slide ppt model pictures pdf set of slides. The slide contains innovative icons that can be flexibly edited. Choose this online business program icons slide ppt model pictures pdf template to create a satisfactory experience for your customers. Go ahead and click the download button.
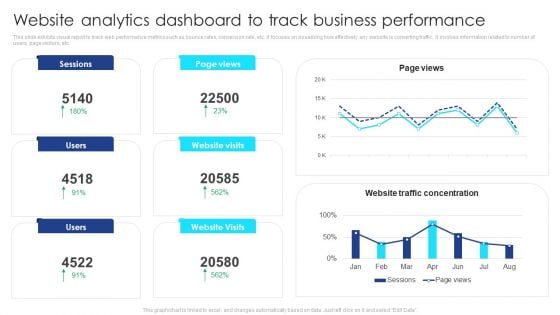
Website Analytics Dashboard To Track Business Performance Guidelines PDF
This slide exhibits visual report to track web performance metrics such as bounce rates, conversion rate, etc. It focuses on visualizing how effectively any website is converting traffic. It involves information related to number of users, page visitors, etc. Pitch your topic with ease and precision using this Website Analytics Dashboard To Track Business Performance Guidelines PDF. This layout presents information on Website Analytics, Dashboard To Track, Business Performance. It is also available for immediate download and adjustment. So, changes can be made in the color, design, graphics or any other component to create a unique layout.
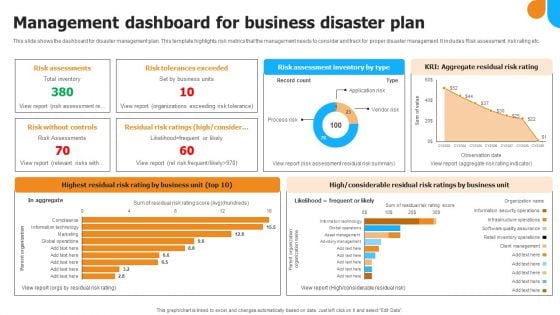
Management Dashboard For Business Disaster Plan Infographics PDF
This slide shows the dashboard for disaster management plan. This template highlights risk metrics that the management needs to consider and track for proper disaster management. It includes Risk assessment, risk rating etc. Showcasing this set of slides titled Management Dashboard For Business Disaster Plan Infographics PDF Graphics. The topics addressed in these templates are Risk Assessments, Risk Tolerances Exceeded, Risk Without Controls. All the content presented in this PPT design is completely editable. Download it and make adjustments in color, background, font etc. as per your unique business setting.
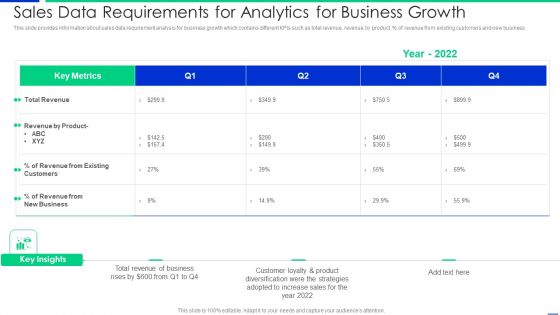
Sales Data Requirements For Analytics For Business Growth Information PDF
This slide provides information about sales data requirement analysis for business growth which contains different KPIs such as total revenue, revenue by product, percentage of revenue from existing customers and new business. Pitch your topic with ease and precision using this sales data requirements for analytics for business growth information pdf. This layout presents information on customers, revenue, business. It is also available for immediate download and adjustment. So, changes can be made in the color, design, graphics or any other component to create a unique layout.

Stock Photo Crumpled Paper With Business Word PowerPoint Slide
This image has been designed with crumpled paper and business text. This image helps to depict concept of business idea. Use this image to make interactive presentations.
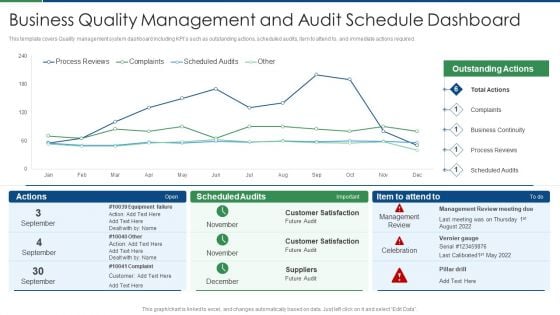
Business Quality Management And Audit Schedule Dashboard Themes PDF
This template covers Quality management system dashboard including KPIs such as outstanding actions, scheduled audits, item to attend to, and immediate actions required. Deliver an awe inspiring pitch with this creative business quality management and audit schedule dashboard themes pdf bundle. Topics like business continuity, scheduled audits, process reviews, complaints can be discussed with this completely editable template. It is available for immediate download depending on the needs and requirements of the user.
Technology Transformation Services Icon For Business Organizations Pictures PDF
Showcasing this set of slides titled Technology Transformation Services Icon For Business Organizations Pictures PDF. The topics addressed in these templates are Technology Transformation, Services Icon, Business Organizations. All the content presented in this PPT design is completely editable. Download it and make adjustments in color, background, font etc. as per your unique business setting.
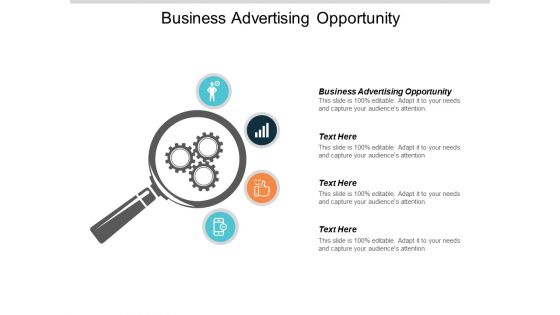
Business Advertising Opportunity Ppt PowerPoint Presentation Layouts Guide Cpb
This is a business advertising opportunity ppt powerpoint presentation layouts guide cpb. This is a four stage process. The stages in this process are business advertising opportunity.
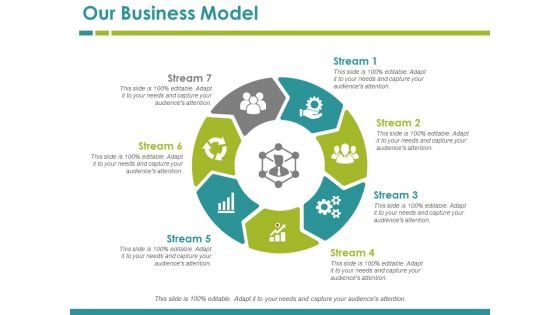
Our Business Model Template 5 Ppt PowerPoint Presentation Model Picture
This is a our business model template 5 ppt powerpoint presentation model picture. This is a seven stage process. The stages in this process are business, business model, icons, management, process.
Icons Slide For Business Synergies Ppt Pictures Design Ideas PDF
Help your business to create an attention-grabbing presentation using our icons slide for business synergies ppt pictures design ideas pdf set of slides. The slide contains innovative icons that can be flexibly edited. Choose this icons slide for business synergies ppt pictures design ideas pdf template to create a satisfactory experience for your customers. Go ahead and click the download button.
Business Operational Expenditure Monitoring Dashboard With Budget Analysis Icons PDF
This slide shows operating expenses OPEX monitoring dashboard with budget analysis assisting companies in evaluating funds useful until end of the year. It visually present the organizations operating expenses by time period and sector. Showcasing this set of slides titled Business Operational Expenditure Monitoring Dashboard With Budget Analysis Icons PDF. The topics addressed in these templates are Business Operational, Budget Analysis, Monitoring Dashboard. All the content presented in this PPT design is completely editable. Download it and make adjustments in color, background, font etc. as per your unique business setting.
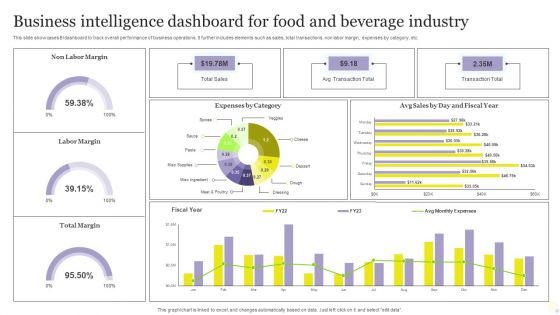
Business Intelligence Dashboard For Food And Beverage Industry Diagrams PDF
This slide showcases BI dashboard to track overall performance of business operations. It further includes elements such as sales, total transactions, non labor margin, expenses by category, etc. Pitch your topic with ease and precision using this Business Intelligence Dashboard For Food And Beverage Industry Diagrams PDF. This layout presents information on Expenses, Sales, Business Intelligence Dashboard. It is also available for immediate download and adjustment. So, changes can be made in the color, design, graphics or any other component to create a unique layout.
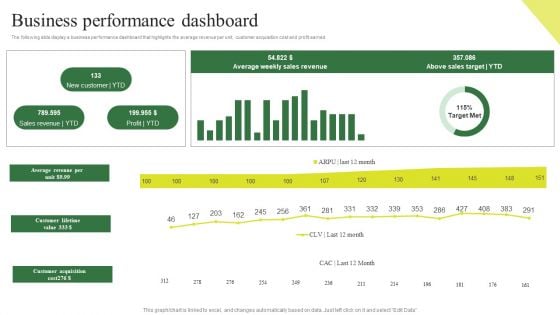
Consumption Based Pricing Model Business Performance Dashboard Demonstration PDF
The following slide display a business performance dashboard that highlights the average revenue per unit, customer acquisition cost and profit earned. Crafting an eye catching presentation has never been more straightforward. Let your presentation shine with this tasteful yet straightforward Consumption Based Pricing Model Business Performance Dashboard Demonstration PDF template. It offers a minimalistic and classy look that is great for making a statement. The colors have been employed intelligently to add a bit of playfulness while still remaining professional. Construct the ideal Consumption Based Pricing Model Business Performance Dashboard Demonstration PDF that effortlessly grabs the attention of your audience. Begin now and be certain to wow your customers.
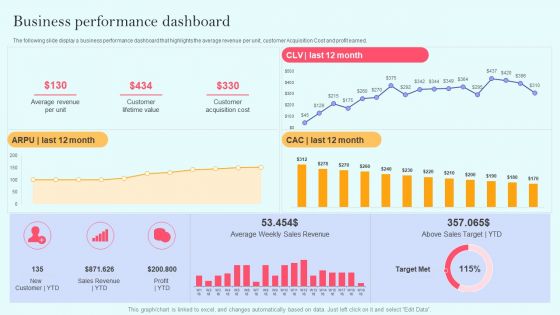
Recurring Income Generation Model Business Performance Dashboard Clipart PDF
The following slide display a business performance dashboard that highlights the average revenue per unit, customer Acquisition Cost and profit earned. Crafting an eye catching presentation has never been more straightforward. Let your presentation shine with this tasteful yet straightforward Recurring Income Generation Model Business Performance Dashboard Clipart PDF template. It offers a minimalistic and classy look that is great for making a statement. The colors have been employed intelligently to add a bit of playfulness while still remaining professional. Construct the ideal Recurring Income Generation Model Business Performance Dashboard Clipart PDF that effortlessly grabs the attention of your audience. Begin now and be certain to wow your customers.
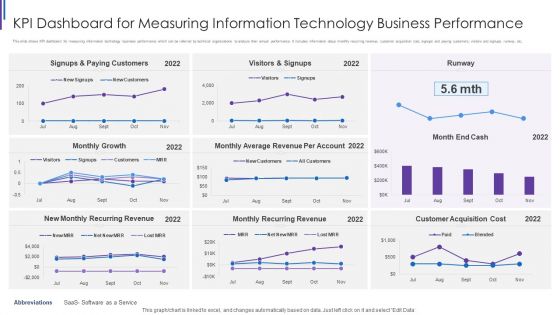
KPI Dashboard For Measuring Information Technology Business Performance Designs PDF
This slide shows KPI dashboard for measuring information technology business performance which can be referred by technical organizations to analyze their annual performance. It includes information about monthly recurring revenue, customer acquisition cost, signups and paying customers, visitors and signups, runway, etc. Showcasing this set of slides titled KPI Dashboard For Measuring Information Technology Business Performance Designs PDF. The topics addressed in these templates are Signups And Paying, Customers Monthly Growth, Visitors And Signups, Monthly Average Revenue. All the content presented in this PPT design is completely editable. Download it and make adjustments in color, background, font etc. as per your unique business setting.
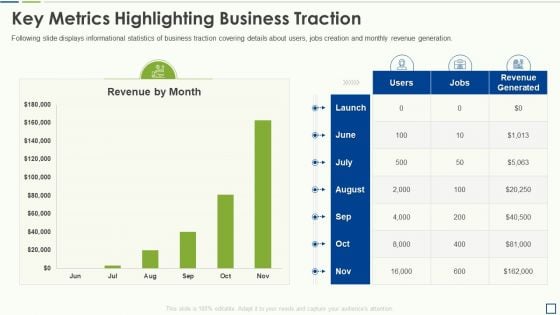
Accounting Pitch Deck Key Metrics Highlighting Business Traction Pictures PDF
Following slide displays informational statistics of business traction covering details about users, jobs creation and monthly revenue generation.Deliver and pitch your topic in the best possible manner with this accounting pitch deck key metrics highlighting business traction pictures pdf Use them to share invaluable insights on key metrics highlighting business traction and impress your audience. This template can be altered and modified as per your expectations. So, grab it now.
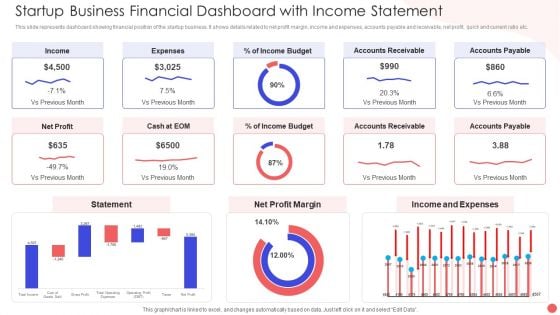
Startup Business Financial Dashboard With Income Statement Portrait PDF
This slide represents dashboard showing financial position of the startup business. It shows details related to net profit margin, income and expenses, accounts payable and receivable, net profit, quick and current ratio etc. Showcasing this set of slides titled Startup Business Financial Dashboard With Income Statement Portrait PDF. The topics addressed in these templates are Accounts Receivable Income, Income And Expenses, Net Profit Margin. All the content presented in this PPT design is completely editable. Download it and make adjustments in color, background, font etc. as per your unique business setting.
Marketing And Operations Dashboard For Ecommerce Business Icons PDF
This slide covers sales and operations dashboard for ecommerce business. It involves details such as total sales generated, number of brands, total revenue generated, number of units sold and gender and age range breakdown. Showcasing this set of slides titled Marketing And Operations Dashboard For Ecommerce Business Icons PDF. The topics addressed in these templates are Total Sales Generated, Total Revenue Generated, Returning Consumers. All the content presented in this PPT design is completely editable. Download it and make adjustments in color, background, font etc. as per your unique business setting.
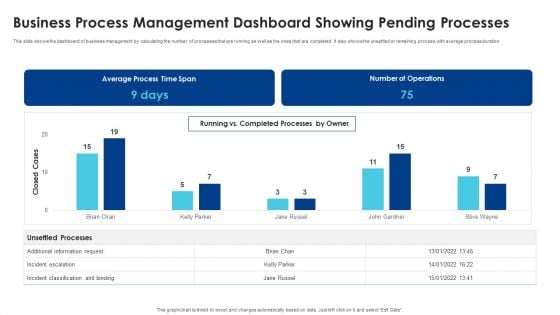
Business Process Management Dashboard Showing Pending Processes Graphics PDF
This slide shows the dashboard of business management by calculating the number of processes that are running as well as the ones that are completed. It also shows the unsettled or remaining process with average process duration. Showcasing this set of slides titled Business Process Management Dashboard Showing Pending Processes Graphics PDF. The topics addressed in these templates are Average Process, Time Span, Number Operations. All the content presented in this PPT design is completely editable. Download it and make adjustments in color, background, font etc. as per your unique business setting.
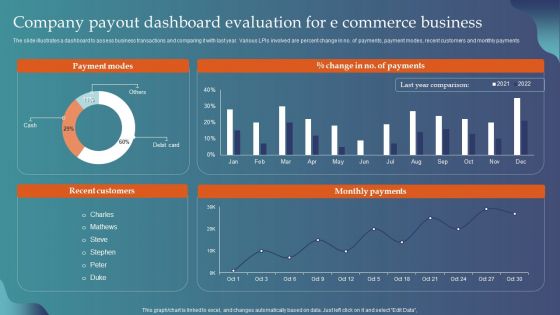
Company Payout Dashboard Evaluation For E Commerce Business Background PDF
The slide illustrates a dashboard to assess business transactions and comparing it with last year. Various LPIs involved are percent change in no. of payments, payment modes, recent customers and monthly payments. Showcasing this set of slides titled Company Payout Dashboard Evaluation For E Commerce Business Background PDF. The topics addressed in these templates are Payment Modes, Recent Customers, Monthly Payments. All the content presented in this PPT design is completely editable. Download it and make adjustments in color, background, font etc. as per your unique business setting.
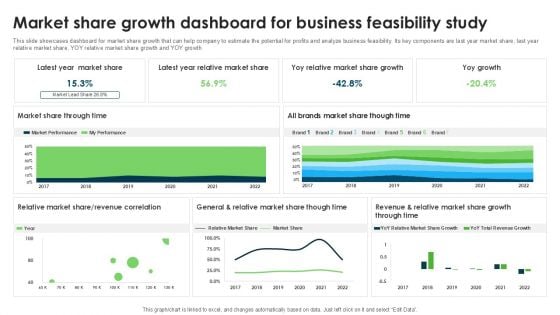
Market Share Growth Dashboard For Business Feasibility Study Demonstration PDF
Trading Business Ppt PowerPoint Presentation Pictures Slide Download Cpb
This is a trading business ppt powerpoint presentation pictures slide download cpb. This is a four stage process. The stages in this process are trading business.

Business Licenses Ppt PowerPoint Presentation Pictures Example File
This is a business licenses ppt powerpoint presentation pictures example file. This is a seven stage process. The stages in this process are business licenses.
Business Model Development Ppt PowerPoint Presentation Gallery Picture
This is a business model development ppt powerpoint presentation gallery picture. This is a five stage process. The stages in this process are business model development.
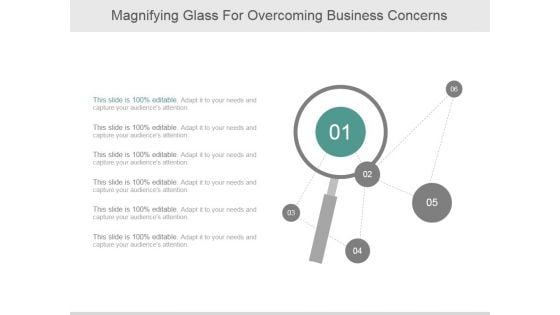
Magnifying Glass For Overcoming Business Concerns Ppt PowerPoint Presentation Ideas
This is a magnifying glass for overcoming business concerns ppt powerpoint presentation ideas. This is a six stage process. The stages in this process are business, marketing, magnify glass, strategy, search.
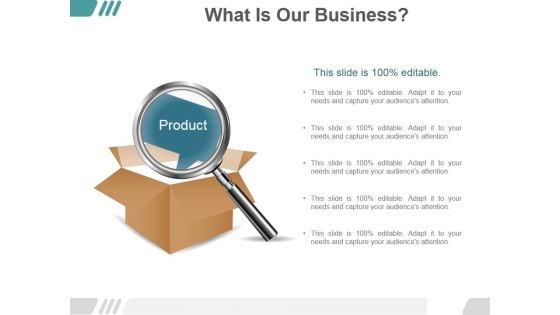
What Is Our Business Ppt PowerPoint Presentation Design Ideas
This is a what is our business ppt powerpoint presentation design ideas. This is a one stage process. The stages in this process are product, management, magnifying glass, business.
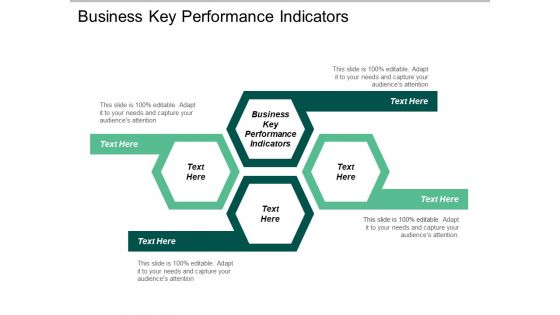
Business Key Performance Indicators Ppt PowerPoint Presentation File Rules Cpb
This is a business key performance indicators ppt powerpoint presentation file rules cpb. This is a four stage process. The stages in this process are business key performance indicators.
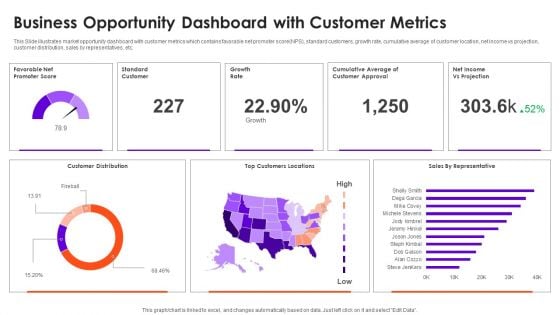
Business Opportunity Dashboard With Customer Metrics Information PDF
This Slide illustrates market opportunity dashboard with customer metrics which contains favorable net promoter score NPS, standard customers, growth rate, cumulative average of customer location, net income vs projection, customer distribution, sales by representatives, etc. Pitch your topic with ease and precision using this Business Opportunity Dashboard With Customer Metrics Information PDF. This layout presents information on Customer Distribution, Growth Rate, Top Customers Locations. It is also available for immediate download and adjustment. So, changes can be made in the color, design, graphics or any other component to create a unique layout.
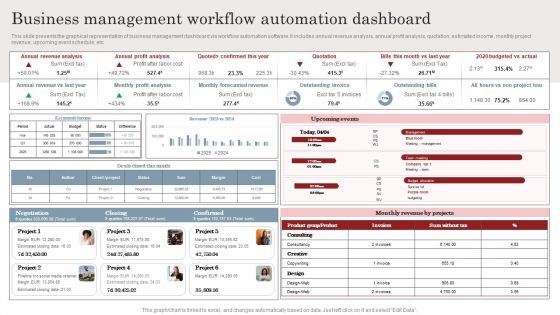
Business Management Workflow Automation Dashboard Ppt Styles Format Ideas PDF
This slide presents the graphical representation of business management dashboard via workflow automation software. It includes annual revenue analysis, annual profit analysis, quotation, estimated income, monthly project revenue, upcoming event schedule, etc. Presenting this PowerPoint presentation, titled Business Management Workflow Automation Dashboard Ppt Styles Format Ideas PDF, with topics curated by our researchers after extensive research. This editable presentation is available for immediate download and provides attractive features when used. Download now and captivate your audience. Presenting this Business Management Workflow Automation Dashboard Ppt Styles Format Ideas PDF. Our researchers have carefully researched and created these slides with all aspects taken into consideration. This is a completely customizable Business Management Workflow Automation Dashboard Ppt Styles Format Ideas PDF that is available for immediate downloading. Download now and make an impact on your audience. Highlight the attractive features available with our PPTs.
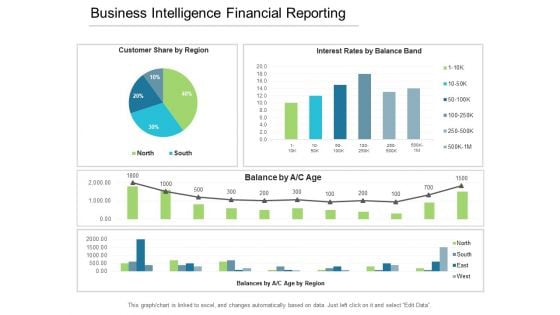
Business Intelligence Financial Reporting Ppt PowerPoint Presentation Layouts Model
This is a business intelligence financial reporting ppt powerpoint presentation layouts model. This is a four stage process. The stages in this process are business analytics, ba, organizations data.
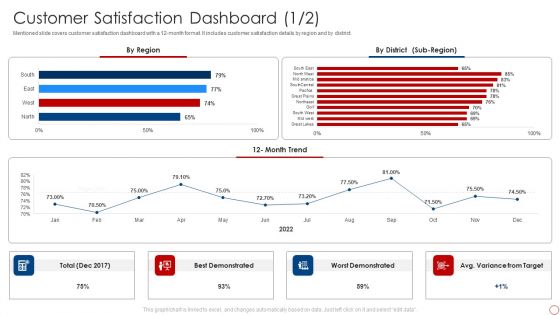
Kpis For Evaluating Business Sustainability Customer Satisfaction Dashboard Clipart PDF
Mentioned slide covers customer satisfaction dashboard with a 12-month format. It includes customer satisfaction details by region and by district. Deliver an awe inspiring pitch with this creative Kpis For Evaluating Business Sustainability Customer Satisfaction Dashboard Clipart PDF bundle. Topics like Best Demonstrated, Worst Demonstrated, 12 Month Trend can be discussed with this completely editable template. It is available for immediate download depending on the needs and requirements of the user.
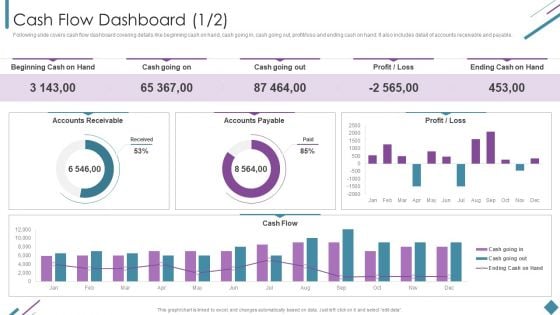
Metrics To Measure Business Performance Cash Flow Dashboard Rules PDF
Following slide covers cash flow dashboard covering details like beginning cash on hand, cash going in, cash going out, profit or loss and ending cash on hand. It also includes detail of accounts receivable and payable. Deliver an awe inspiring pitch with this creative Metrics To Measure Business Performance Cash Flow Dashboard Rules PDF bundle. Topics like Beginning Cash Hand, Cash Going Out, Accounts Payable, Accounts Receivable can be discussed with this completely editable template. It is available for immediate download depending on the needs and requirements of the user.
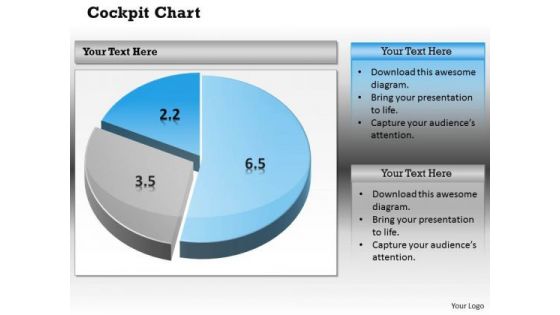
Business Cycle Diagram Pie Chart Dashborad Design Marketing Diagram
Document Your Views On Our Business Cycle Diagram Pie Chart Dashborad Design Marketing Diagram Powerpoint Templates. They Will Create A Strong Impression.
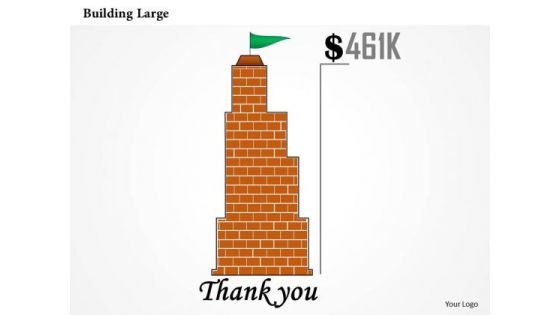
Strategy Diagram Design Of Red Large Building Business Diagram
Open Up Doors That Lead To Success. Our Strategy Diagram Design Of Red Large Building Business Diagram Powerpoint Templates Provide The Handles.
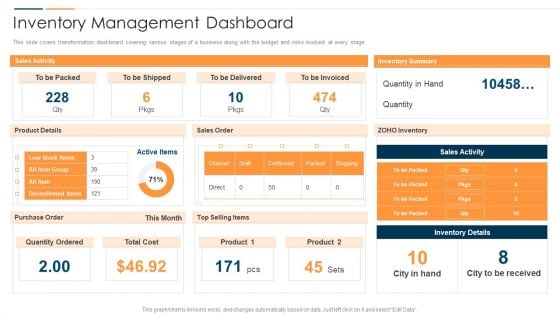
Revolution In Online Business Inventory Management Dashboard Ideas PDF
This slide covers transformation dashboard covering various stages of a business along with the budget and risks involved at every stage. Deliver and pitch your topic in the best possible manner with this Revolution In Online Business Inventory Management Dashboard Ideas PDF. Use them to share invaluable insights on Sales Activity Product, Top Selling Items, Quantity Ordered Active and impress your audience. This template can be altered and modified as per your expectations. So, grab it now.
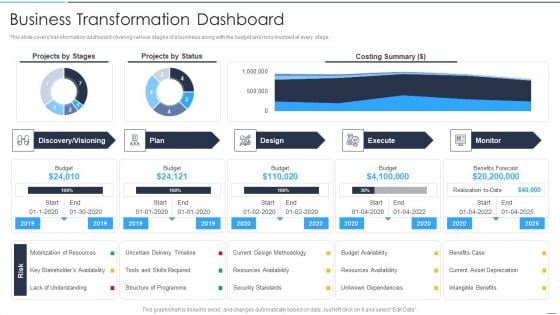
Accelerate Online Journey Now Business Transformation Dashboard Background PDF
This slide covers transformation dashboard covering various stages of a business along with the budget and risks involved at every stage.Deliver and pitch your topic in the best possible manner with this Accelerate Online Journey Now Business Transformation Dashboard Background PDF Use them to share invaluable insights on Mobilization Resources, Stakeholders Availability, Uncertain Timeline and impress your audience. This template can be altered and modified as per your expectations. So, grab it now.
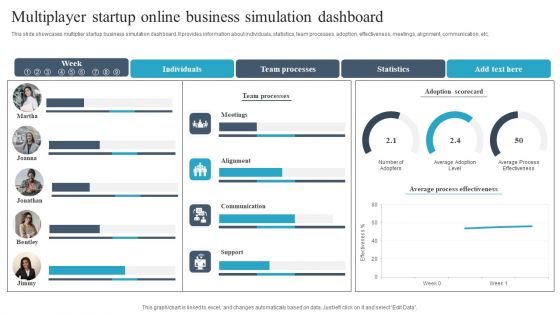
Multiplayer Startup Online Business Simulation Dashboard Demonstration PDF
This slide showcases multiplier startup business simulation dashboard. It provides information about individuals, statistics, team processes, adoption, effectiveness, meetings, alignment, communication, etc. Pitch your topic with ease and precision using this Multiplayer Startup Online Business Simulation Dashboard Demonstration PDF. This layout presents information on Individuals, Team Processes, Statistics. It is also available for immediate download and adjustment. So, changes can be made in the color, design, graphics or any other component to create a unique layout.
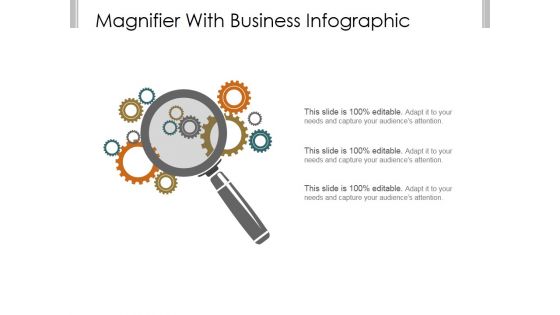
Magnifier With Business Infographic Ppt PowerPoint Presentation Outline
This is a magnifier with business infographic ppt powerpoint presentation outline. This is a three stage process. The stages in this process are business, strategy, marketing, analysis, magnifier, technology.


 Continue with Email

 Home
Home


