Business Snapshot
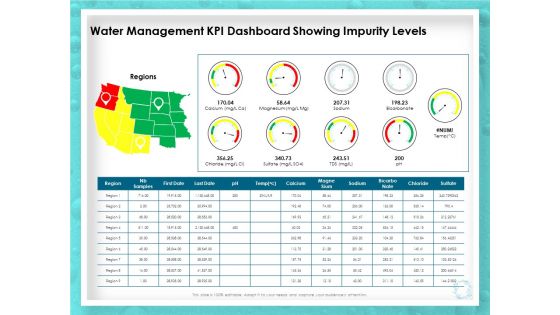
WQM System Water Management KPI Dashboard Showing Impurity Levels Ppt PowerPoint Presentation Pictures Deck PDF
Presenting this set of slides with name wqm system water management kpi dashboard showing impurity levels ppt powerpoint presentation pictures deck pdf. The topics discussed in these slides are region, ph, magne sium, sodium, chloride, bicarbo nate. This is a completely editable PowerPoint presentation and is available for immediate download. Download now and impress your audience.

Picture Of Call Center Office Ppt PowerPoint Presentation Infographic Template Portrait
Presenting this set of slides with name picture of call center office ppt powerpoint presentation infographic template portrait. The topics discussed in these slide is picture of call center office. This is a completely editable PowerPoint presentation and is available for immediate download. Download now and impress your audience.
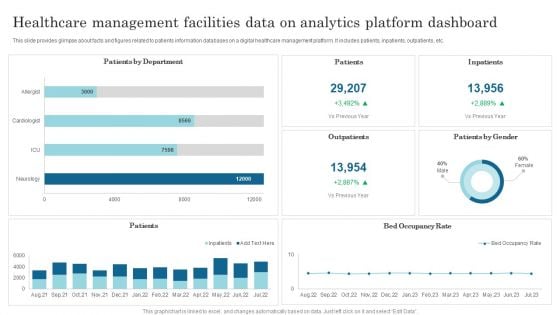
Healthcare Management Facilities Data On Analytics Platform Dashboard Slides PDF
This slide provides glimpse about facts and figures related to patients information databases on a digital healthcare management platform. It includes patients, inpatients, outpatients, etc. Showcasing this set of slides titled Healthcare Management Facilities Data On Analytics Platform Dashboard Slides PDF. The topics addressed in these templates are Patients By Department, Patients, Inpatients. All the content presented in this PPT design is completely editable. Download it and make adjustments in color, background, font etc. as per your unique business setting.
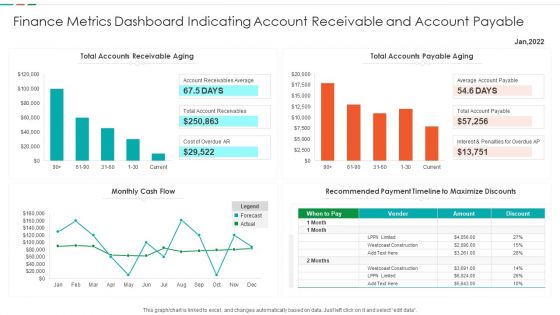
Finance Metrics Dashboard Indicating Account Receivable And Account Payable Demonstration PDF
This graph or chart is linked to excel, and changes automatically based on data. Just left click on it and select edit data. Showcasing this set of slides titled Finance Metrics Dashboard Indicating Account Receivable And Account Payable Demonstration PDF. The topics addressed in these templates are Total Accounts Receivable, Total Accounts Payable, Recommended Payment Timeline, Monthly Cash Flow. All the content presented in this PPT design is completely editable. Download it and make adjustments in color, background, font etc. as per your unique business setting.
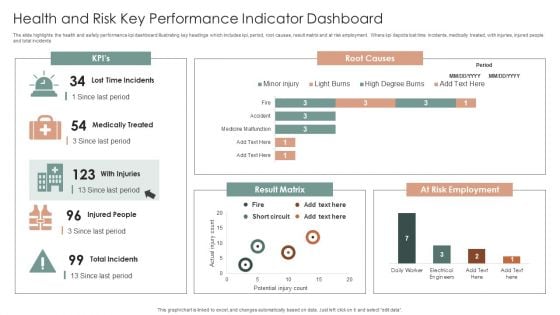
Health And Risk Key Performance Indicator Dashboard Ppt Layouts Graphics Design PDF
The slide highlights the health and safety performance kpi dashboard illustrating key headings which includes kpi, period, root causes, result matrix and at risk employment. Where kpi depicts lost time incidents, medically treated, with injuries, injured people and total incidents. Showcasing this set of slides titled Health And Risk Key Performance Indicator Dashboard Ppt Layouts Graphics Design PDF. The topics addressed in these templates are Root Causes, Result Matrix, At Risk Employment. All the content presented in this PPT design is completely editable. Download it and make adjustments in color, background, font etc. as per your unique business setting.
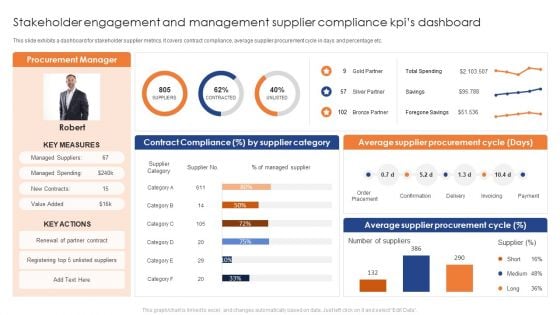
Stakeholder Engagement And Management Supplier Compliance Kpis Dashboard Pictures PDF
This slide exhibits a dashboard for stakeholder supplier metrics. It covers contract compliance, average supplier procurement cycle in days and percentage etc. Showcasing this set of slides titled Stakeholder Engagement And Management Supplier Compliance Kpis Dashboard Pictures PDF. The topics addressed in these templates are Average Supplier Procurement Cycle, Average Supplier Procurement Cycle . All the content presented in this PPT design is completely editable. Download it and make adjustments in color, background, font etc. as per your unique business setting.
Customer Service Metrics Dashboard With Customer Retention Rate Icons PDF
This slide showcases KPIs dashboard for customer service that can help organization to track the consumer satisfaction score and improve product or service by improving customer loyalty. Its key components are net promoter score, customer retention and support costs. Showcasing this set of slides titled Customer Service Metrics Dashboard With Customer Retention Rate Icons PDF. The topics addressed in these templates are Customer Retention, Net Promoter Score, Service Level. All the content presented in this PPT design is completely editable. Download it and make adjustments in color, background, font etc. as per your unique business setting.
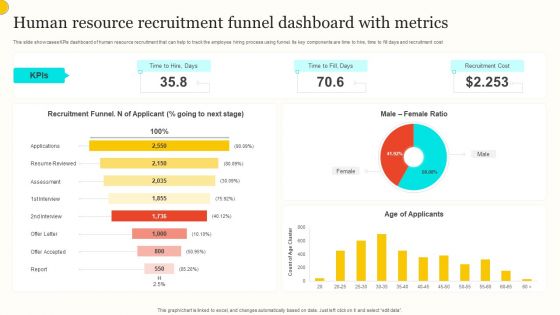
Human Resource Recruitment Funnel Dashboard With Metrics Summary PDF
This slide showcases KPIs dashboard of human resource recruitment that can help to track the employee hiring process using funnel. Its key components are time to hire, time to fill days and recruitment cost. Showcasing this set of slides titled Human Resource Recruitment Funnel Dashboard With Metrics Summary PDF. The topics addressed in these templates are Recruitment Funnel, Male Female Ratio, Age Applicants. All the content presented in this PPT design is completely editable. Download it and make adjustments in color, background, font etc. as per your unique business setting.
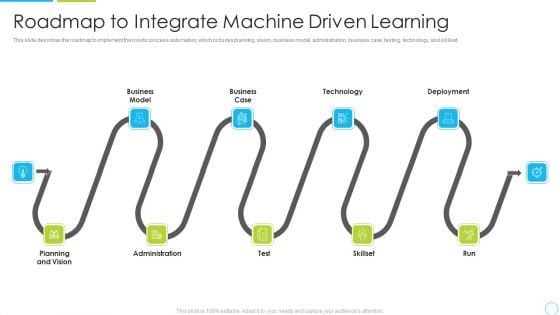
Roadmap To Integrate Machine Driven Learning Ppt Pictures Information PDF
This is a roadmap to integrate machine driven learning ppt pictures information pdf template with various stages. Focus and dispense information on eleven stages using this creative set, that comes with editable features. It contains large content boxes to add your information on topics like business model, business case, technology, deployment, planning. You can also showcase facts, figures, and other relevant content using this PPT layout. Grab it now.
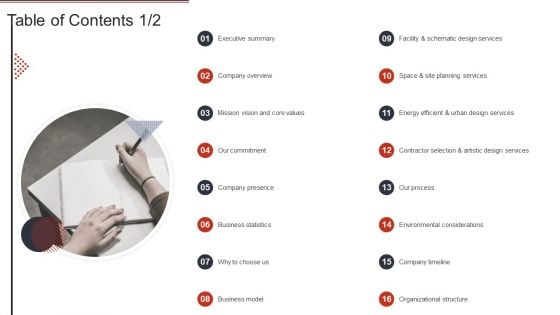
Building Design Firm Details Table Of Contents Ppt Visual Aids Pictures PDF
Presenting Building Design Firm Details Table Of Contents Ppt Visual Aids Pictures PDF to provide visual cues and insights. Share and navigate important information on one stages that need your due attention. This template can be used to pitch topics like Executive Summary, Company Presence, Business Statistics, Business Model. In addtion, this PPT design contains high resolution images, graphics, etc, that are easily editable and available for immediate download.
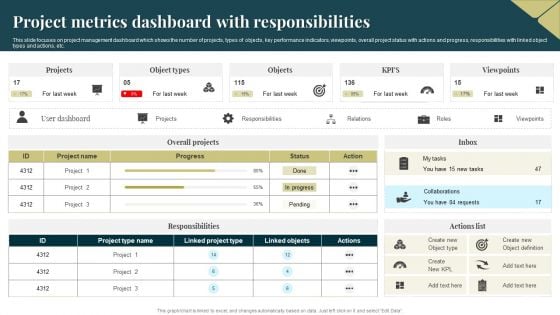
Project Metrics Dashboard With Responsibilities Graphics PDF
This slide focuses on project management dashboard which shows the number of projects, types of objects, key performance indicators, viewpoints, overall project status with actions and progress, responsibilities with linked object types and actions, etc. Pitch your topic with ease and precision using this Project Metrics Dashboard With Responsibilities Graphics PDF. This layout presents information on Project Metrics, Dashboard With Responsibilities. It is also available for immediate download and adjustment. So, changes can be made in the color, design, graphics or any other component to create a unique layout.
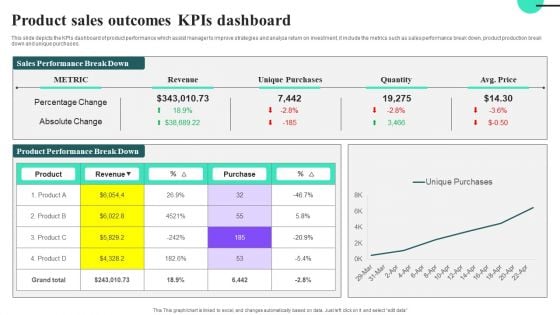
Product Sales Outcomes Kpis Dashboard Ideas PDF
This slide depicts the KPIs dashboard of product performance which assist manager to improve strategies and analyze return on investment, it include the metrics such as sales performance break down, product production break down and unique purchases.Showcasing this set of slides titled Product Sales Outcomes Kpis Dashboard Ideas PDF. The topics addressed in these templates are Percentage Change, Absolute Change. All the content presented in this PPT design is completely editable. Download it and make adjustments in color, background, font etc. as per your unique business setting.
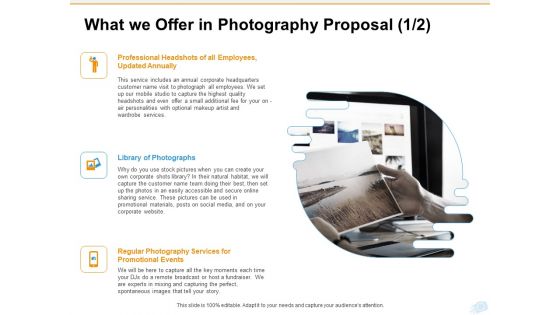
Corporate Occasion Videography Proposal What We Offer In Photography Proposal Annual Information PDF
Deliver an awe inspiring pitch with this creative corporate occasion videography proposal what we offer in photography proposal annual information pdf bundle. Topics like social media, service, promotional, materials can be discussed with this completely editable template. It is available for immediate download depending on the needs and requirements of the user.
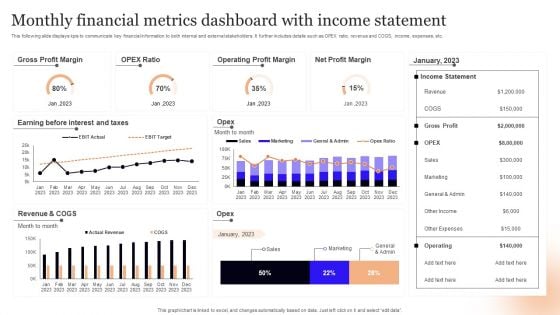
Monthly Financial Metrics Dashboard With Income Statement Infographics PDF
This following slide displays kpis to communicate key financial information to both internal and external stakeholders. It further includes details such as OPEX ratio, revenue and COGS, income, expenses, etc. Showcasing this set of slides titled Monthly Financial Metrics Dashboard With Income Statement Infographics PDF. The topics addressed in these templates are Gross Profit Margin, Taxes, Revenue. All the content presented in this PPT design is completely editable. Download it and make adjustments in color, background, font etc. as per your unique business setting.
Education Metrics Dashboard For Tracking Student Ethnicity And Specially Abled Characteristics Brochure PDF
This slide covers the education key performance indicator tracker. It include metrics such as total applications, conversion rate, offers year to date, applications by ethnicity and disabilities, etc. Showcasing this set of slides titled Education Metrics Dashboard For Tracking Student Ethnicity And Specially Abled Characteristics Brochure PDF. The topics addressed in these templates are Total Applications, Conversion Rate 2022, Ethnicity. All the content presented in this PPT design is completely editable. Download it and make adjustments in color, background, font etc. as per your unique business setting.
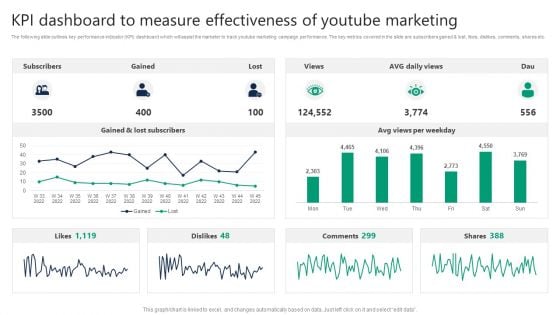
KPI Dashboard To Measure Effectiveness Of Youtube Marketing Formats PDF
The following slide outlines key performance indicator KPI dashboard which will assist the marketer to track youtube marketing campaign performance. The key metrics covered in the slide are subscribers gained and lost, likes, dislikes, comments, shares etc. Are you searching for a KPI Dashboard To Measure Effectiveness Of Youtube Marketing Formats PDF that is uncluttered, straightforward, and original Its easy to edit, and you can change the colors to suit your personal or business branding. For a presentation that expresses how much effort you have put in, this template is ideal With all of its features, including tables, diagrams, statistics, and lists, its perfect for a business plan presentation. Make your ideas more appealing with these professional slides. Download KPI Dashboard To Measure Effectiveness Of Youtube Marketing Formats PDF from Slidegeeks today.
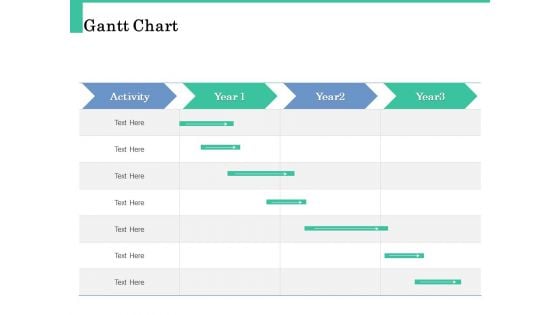
How A Corporate Life Coach Can Help Develop Your Company Gantt Chart Topics PDF
Make a highly optimized project management report using this content-ready Gantt Chart PPT Diagram. Effortless yet very clear, this layout proves a useful tool to present the professional details of a task or activity. Showcase the activities and allotted time to the business executives with this Gantt Chart PowerPoint theme. List down the column tasks in various timeframes and the activities associated with each of them here. Further, plot time allocation for various tasks, monitor their actual time and make comparisons to interpret the final progress with this well-structured Gantt Chart Excel Template. You can add all the significant details of a particular project in this chart and showcase it to all the project members so that they can participate in the overall development. Not only this but also our PPT template can help you showcase the work breakdown structure of your project.
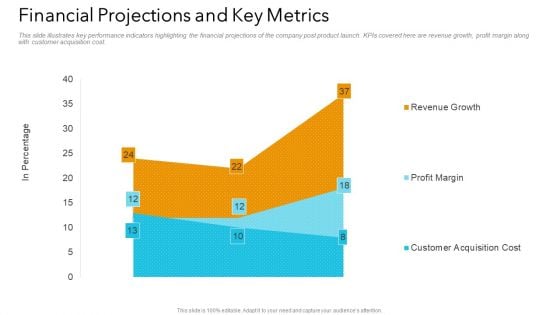
Guy Kawasaki 10 20 30 Rule Investor Financial Projections And Key Metrics Rules PDF
This slide illustrates key performance indicators highlighting the financial projections of the company post product launch. KPIs covered here are revenue growth, profit margin along with customer acquisition cost.Deliver an awe inspiring pitch with this creative guy kawasaki 10 20 30 rule investor financial projections and key metrics rules pdf bundle. Topics like financial projections and key metrics can be discussed with this completely editable template. It is available for immediate download depending on the needs and requirements of the user.
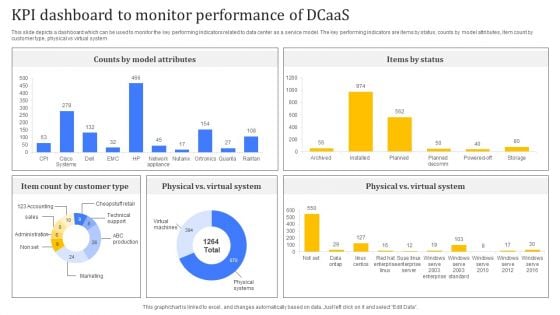
KPI Dashboard To Monitor Performance Of Dcaas Pictures PDF
Following slide highlights major benefits of applying data center as a service to business operations which can be used by businesses looking to modernize their IT infrastructure. Major benefits are in terms of scalability, flexibility, cost effectiveness, and security. Pitch your topic with ease and precision using this KPI Dashboard To Monitor Performance Of Dcaas Pictures PDF. This layout presents information on Customer Type, Counts By Model Attributes, Items By Status. It is also available for immediate download and adjustment. So, changes can be made in the color, design, graphics or any other component to create a unique layout.
Comprehensive Guide On Current Strategies Performance Tracking Dashboard For Food Product
The slide showcases dashboard representing food and beverage business performance tracking tool, which assist to evaluate monthly performance of employees, customer retention etc. Are you searching for a Comprehensive Guide On Current Strategies Performance Tracking Dashboard For Food Product that is uncluttered, straightforward, and original Its easy to edit, and you can change the colors to suit your personal or business branding. For a presentation that expresses how much effort you have put in, this template is ideal With all of its features, including tables, diagrams, statistics, and lists, its perfect for a business plan presentation. Make your ideas more appealing with these professional slides. Download Comprehensive Guide On Current Strategies Performance Tracking Dashboard For Food Product from Slidegeeks today. The slide showcases dashboard representing food and beverage business performance tracking tool, which assist to evaluate monthly performance of employees, customer retention etc.
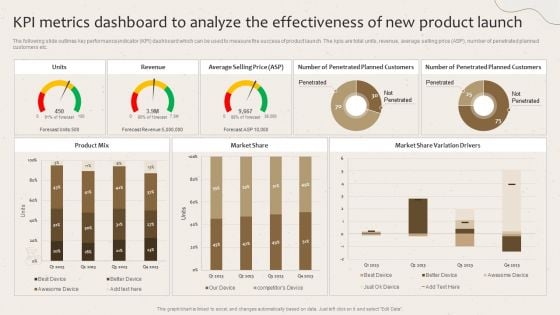
Kpi Metrics Dashboard To Analyze The Effectiveness Of New Product Launch Launching New Beverage Product Diagrams PDF
The following slide outlines key performance indicator KPI dashboard which can be used to measure the success of product launch. The kpis are total units, revenue, average selling price ASP, number of penetrated planned customers etc. Create an editable Kpi Metrics Dashboard To Analyze The Effectiveness Of New Product Launch Launching New Beverage Product Diagrams PDF that communicates your idea and engages your audience. Whether you are presenting a business or an educational presentation, pre-designed presentation templates help save time. Kpi Metrics Dashboard To Analyze The Effectiveness Of New Product Launch Launching New Beverage Product Diagrams PDF is highly customizable and very easy to edit, covering many different styles from creative to business presentations. Slidegeeks has creative team members who have crafted amazing templates. So, go and get them without any delay.
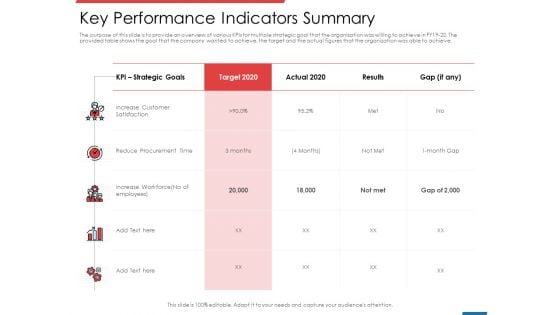
Financial PAR Key Performance Indicators Summary Ppt Summary Graphics PDF
Deliver an awe inspiring pitch with this creative financial par key performance indicators summary ppt summary graphics pdf bundle. Topics like procurement, strategic, goals, target, procurement can be discussed with this completely editable template. It is available for immediate download depending on the needs and requirements of the user.
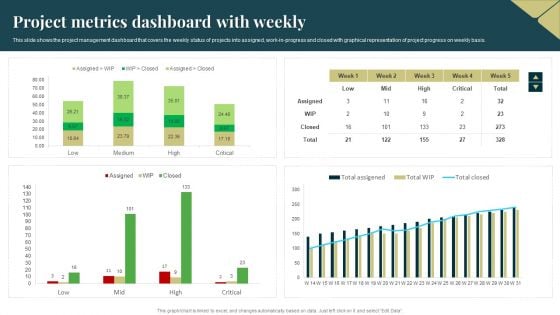
Project Metrics Dashboard With Weekly Formats PDF
This slide shows the project management dashboard that covers the weekly status of projects into assigned, work in progress and closed with graphical representation of project progress on weekly basis. Showcasing this set of slides titled Project Metrics Dashboard With Weekly Formats PDF. The topics addressed in these templates are Project Metrics, Dashboard With Weekly. All the content presented in this PPT design is completely editable. Download it and make adjustments in color, background, font etc. as per your unique business setting.
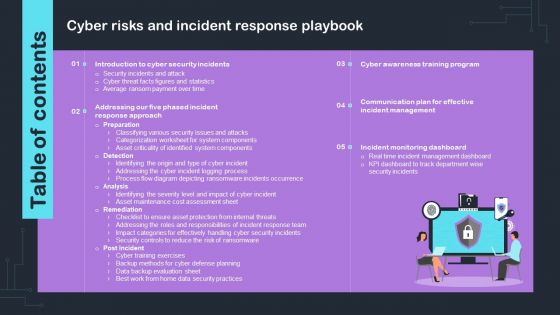
Table Of Content Cyber Risks And Incident Response Playbook Pictures PDF
Create an editable Table Of Content Cyber Risks And Incident Response Playbook Pictures PDF that communicates your idea and engages your audience. Whether youre presenting a business or an educational presentation, pre-designed presentation templates help save time. Table Of Content Cyber Risks And Incident Response Playbook Pictures PDF is highly customizable and very easy to edit, covering many different styles from creative to business presentations. Slidegeeks has creative team members who have crafted amazing templates. So, go and get them without any delay.

Seven Petals Showing Sources Of Information Ppt PowerPoint Presentation Pictures Smartart PDF
Persuade your audience using this seven petals showing sources of information ppt powerpoint presentation pictures smartart pdf. This PPT design covers seven stages, thus making it a great tool to use. It also caters to a variety of topics including get oriented, discover primary business objectives, define scope, formulate busines analysis plan, define requirements, business solution, assess value. Download this PPT design now to present a convincing pitch that not only emphasizes the topic but also showcases your presentation skills.
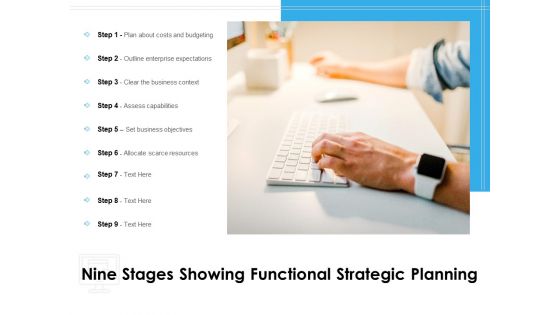
Nine Stages Showing Functional Strategic Planning Ppt PowerPoint Presentation Pictures Show PDF
Persuade your audience using this nine stages showing functional strategic planning ppt powerpoint presentation pictures show pdf. This PPT design covers nine stages, thus making it a great tool to use. It also caters to a variety of topics including plan about costs and budgeting, outline enterprise expectations, clear the business context, assess capabilities, set business objectives, allocate scarce resources. Download this PPT design now to present a convincing pitch that not only emphasizes the topic but also showcases your presentation skills.
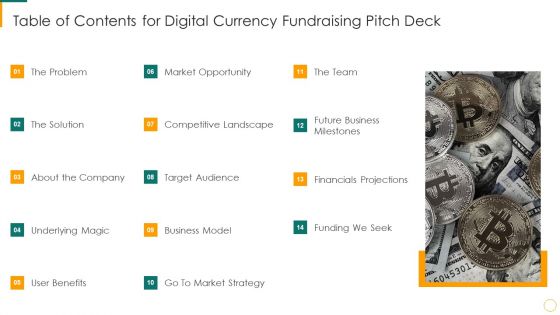
Table Of Contents For Digital Currency Fundraising Pitch Deck Ppt Pictures Graphics Tutorials PDF
This is a table of contents for digital currency fundraising pitch deck ppt pictures graphics tutorials pdf template with various stages. Focus and dispense information on one stages using this creative set, that comes with editable features. It contains large content boxes to add your information on topics like market opportunity, competitive landscape, business model, future business milestones. You can also showcase facts, figures, and other relevant content using this PPT layout. Grab it now.
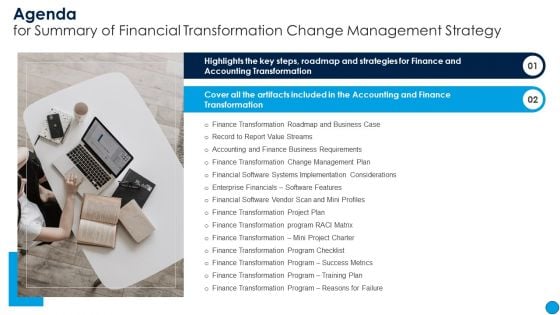
Agenda Forfor Summary of Financial Transformation Change Management Strategy Pictures PDF
Presenting Agenda Forfor Summary of Financial Transformation Change Management Strategy Pictures PDF to provide visual cues and insights. Share and navigate important information on two stages that need your due attention. This template can be used to pitch topics like Finance Transformation, Roadmap And Business Case, Accounting And Finance Business Requirements. In addtion, this PPT design contains high resolution images, graphics, etc, that are easily editable and available for immediate download.
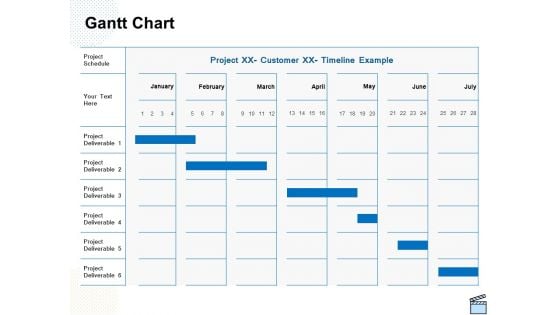
Professional Picture Proposal Gantt Chart Ppt Infographics Graphics Design PDF
Your complex projects can be managed and organized simultaneously using this detailed professional picture proposal gantt chart ppt infographics graphics design pdf template. Track the milestones, tasks, phases, activities, and subtasks to get an updated visual of your project. Share your planning horizon and release plan with this well crafted presentation template. This exemplary template can be used to plot various dependencies to distinguish the tasks in the pipeline and their impact on the schedules and deadlines of the project. Apart from this, you can also share this visual presentation with your team members and stakeholders. It a resourceful tool that can be incorporated into your business structure. Therefore, download and edit it conveniently to add the data and statistics as per your requirement.

Picture Individual Eyeglasses Ppt PowerPoint Presentation Complete Deck
Improve your presentation delivery using this picture individual eyeglasses ppt powerpoint presentation complete deck. Support your business vision and objectives using this well-structured PPT deck. This template offers a great starting point for delivering beautifully designed presentations on the topic of your choice. Comprising twelve slides this professionally designed template is all you need to host discussion and meetings with collaborators. Each slide is self-explanatory and equipped with high-quality graphics that can be adjusted to your needs. Therefore, you will face no difficulty in portraying your desired content using this PPT slideshow. This PowerPoint slideshow contains every important element that you need for a great pitch. It is not only editable but also available for immediate download and utilization. The color, font size, background, shapes everything can be modified to create your unique presentation layout. Therefore, download it now.

Squirrel Pictures Animal Ppt PowerPoint Presentation Complete Deck With Slides
If designing a presentation takes a lot of your time and resources and you are looking for a better alternative, then this Squirrel Pictures Animal Ppt PowerPoint Presentation Complete Deck With Slides is the right fit for you. This is a prefabricated set that can help you deliver a great presentation on the topic. All the seven slides included in this sample template can be used to present a birds-eye view of the topic. These slides are also fully editable, giving you enough freedom to add specific details to make this layout more suited to your business setting. Apart from the content, all other elements like color, design, theme are also replaceable and editable. This helps in designing a variety of presentations with a single layout. Not only this, you can use this PPT design in formats like PDF, PNG, and JPG once downloaded. Therefore, without any further ado, download and utilize this sample presentation as per your liking.

Hamster Picture Animal Ppt PowerPoint Presentation Complete Deck With Slides
If designing a presentation takes a lot of your time and resources and you are looking for a better alternative, then this Hamster Picture Animal Ppt PowerPoint Presentation Complete Deck With Slides is the right fit for you. This is a prefabricated set that can help you deliver a great presentation on the topic. All the seven slides included in this sample template can be used to present a birds-eye view of the topic. These slides are also fully editable, giving you enough freedom to add specific details to make this layout more suited to your business setting. Apart from the content, all other elements like color, design, theme are also replaceable and editable. This helps in designing a variety of presentations with a single layout. Not only this, you can use this PPT design in formats like PDF, PNG, and JPG once downloaded. Therefore, without any further ado, download and utilize this sample presentation as per your liking.
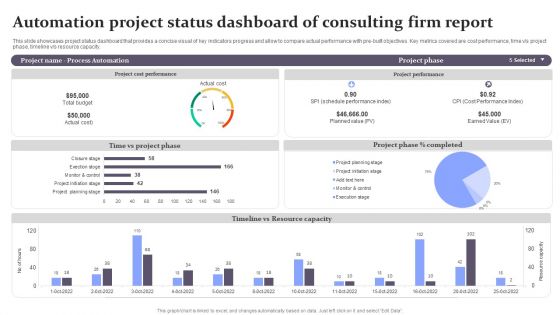
Automation Project Status Dashboard Of Consulting Firm Report Background PDF
This slide showcases project status dashboard that provides a concise visual of key indicators progress and allow to compare actual performance with pre-built objectives. Key metrics covered are cost performance, time v or s project phase, timeline v or s resource capacity. Showcasing this set of slides titled Automation Project Status Dashboard Of Consulting Firm Report Background PDF. The topics addressed in these templates are Project Phase, Planned Value, Cost Performance Index. All the content presented in this PPT design is completely editable. Download it and make adjustments in color, background, font etc. as per your unique business setting.
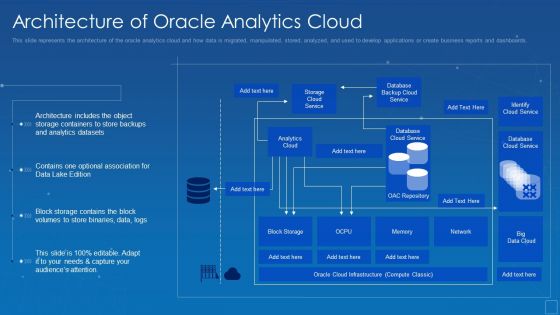
Oracle Cloud Data Analytics Administration IT Architecture Of Oracle Analytics Cloud Microsoft PDF
This slide represents the architecture of the oracle analytics cloud and how data is migrated, manipulated, stored, analyzed, and used to develop applications or create business reports and dashboards. Deliver an awe inspiring pitch with this creative oracle cloud data analytics administration it architecture of oracle analytics cloud microsoft pdf bundle. Topics like datasets, analytics, architecture, containers, association, optional can be discussed with this completely editable template. It is available for immediate download depending on the needs and requirements of the user.
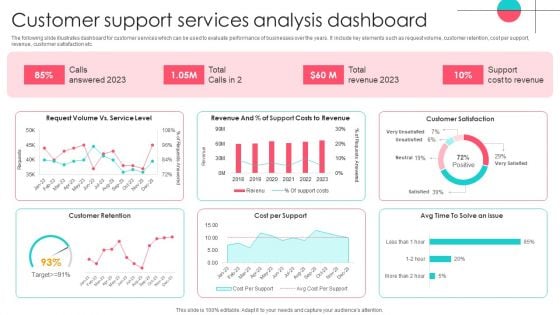
Customer Support Services Analysis Dashboard Template PDF
The following slide illustrates dashboard for customer services which can be used to evaluate performance of businesses over the years. It include key elements such as request volume, customer retention, cost per support, revenue, customer satisfaction etc. Showcasing this set of slides titled Customer Support Services Analysis Dashboard Template PDF. The topics addressed in these templates are Customer Support Services, Analysis Dashboard. All the content presented in this PPT design is completely editable. Download it and make adjustments in color, background, font etc. as per your unique business setting.
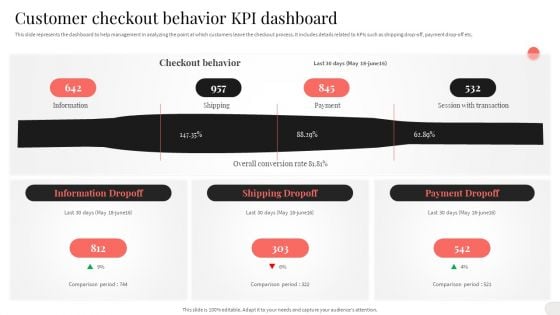
Analyzing And Implementing Effective CMS Customer Checkout Behavior KPI Dashboard Inspiration PDF
This slide represents the dashboard to help management in analyzing the point at which customers leave the checkout process. It includes details related to KPIs such as shipping drop off, payment drop off etc. Coming up with a presentation necessitates that the majority of the effort goes into the content and the message you intend to convey. The visuals of a PowerPoint presentation can only be effective if it supplements and supports the story that is being told. Keeping this in mind our experts created Analyzing And Implementing Effective CMS Customer Checkout Behavior KPI Dashboard Inspiration PDF to reduce the time that goes into designing the presentation. This way, you can concentrate on the message while our designers take care of providing you with the right template for the situation.
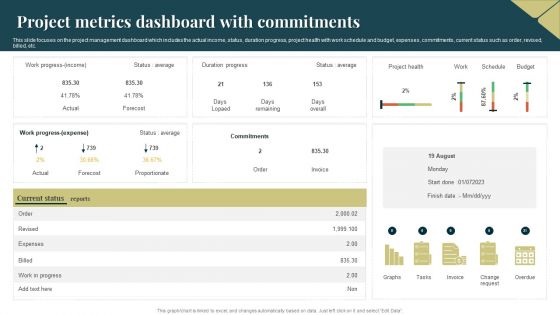
Project Metrics Dashboard With Commitments Mockup PDF
This slide focuses on the project management dashboard which includes the actual income, status, duration progress, project health with work schedule and budget, expenses, commitments, current status such as order, revised, billed, etc. Showcasing this set of slides titled Project Metrics Dashboard With Commitments Mockup PDF. The topics addressed in these templates are Expenses, Budget, Average. All the content presented in this PPT design is completely editable. Download it and make adjustments in color, background, font etc. as per your unique business setting.
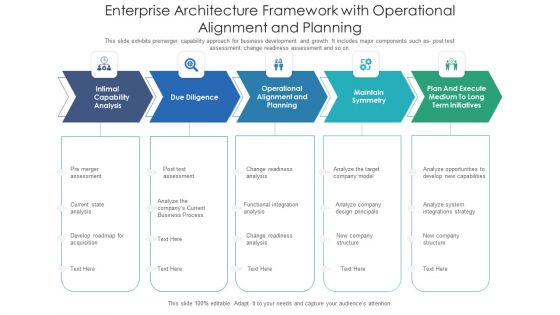
Enterprise Architecture Framework With Operational Alignment And Planning Ppt PowerPoint Presentation Gallery Portrait PDF
This slide business capability model with major segments such as- analyze collaboration model, develop understanding of business capability model, gather data in expert interviews. Pitch your topic with ease and precision using this enterprise architecture framework with operational alignment and planning ppt powerpoint presentation gallery portrait pdf. This layout presents information on motivation, workshop, process. It is also available for immediate download and adjustment. So, changes can be made in the color, design, graphics or any other component to create a unique layout.
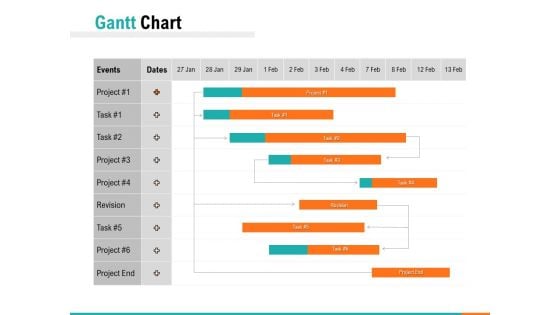
Gantt Chart Ppt PowerPoint Presentation Portfolio Clipart
Make a highly optimized project management report using this content-ready Gantt Chart PPT Diagram. Effortless yet very clear, this layout proves a useful tool to present the professional details of a task or activity. Showcase the activities and allotted time to the business executives with this Gantt Chart PowerPoint theme. List down the column tasks in various timeframes and the activities associated with each of them here. Further, plot time allocation for various tasks, monitor their actual time and make comparisons to interpret the final progress with this well-structured Gantt Chart Excel Template. You can add all the significant details of a particular project in this chart and showcase it to all the project members so that they can participate in the overall development. Not only this but also our PPT template can help you showcase the work breakdown structure of your project.
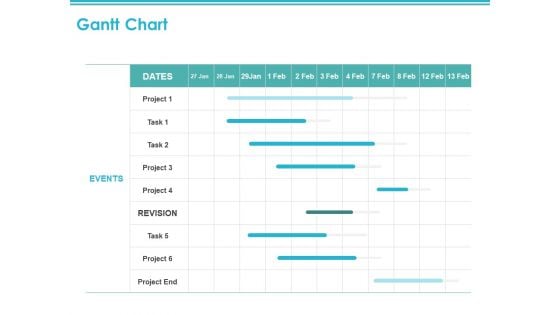
Gantt Chart Events Ppt PowerPoint Presentation Portfolio Graphics
Make a highly optimized project management report using this content-ready Gantt Chart PPT Diagram. Effortless yet very clear, this layout proves a useful tool to present the professional details of a task or activity. Showcase the activities and allotted time to the business executives with this Gantt Chart PowerPoint theme. List down the column tasks in various timeframes and the activities associated with each of them here. Further, plot time allocation for various tasks, monitor their actual time and make comparisons to interpret the final progress with this well-structured Gantt Chart Excel Template. You can add all the significant details of a particular project in this chart and showcase it to all the project members so that they can participate in the overall development. Not only this but also our PPT template can help you showcase the work breakdown structure of your project.
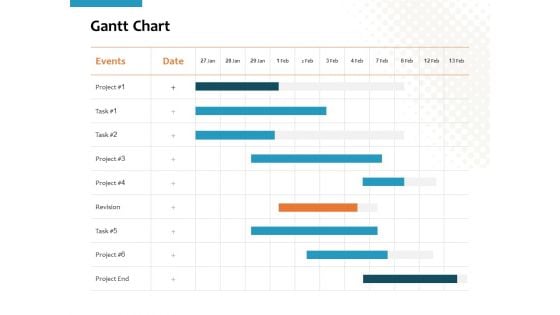
Gantt Chart Ppt PowerPoint Presentation Slides Themes
Make a highly optimized project management report using this content-ready Gantt Chart PPT Diagram. Effortless yet very clear, this layout proves a useful tool to present the professional details of a task or activity. Showcase the activities and allotted time to the business executives with this Gantt Chart PowerPoint theme. List down the column tasks in various timeframes and the activities associated with each of them here. Further, plot time allocation for various tasks, monitor their actual time and make comparisons to interpret the final progress with this well-structured Gantt Chart Excel Template. You can add all the significant details of a particular project in this chart and showcase it to all the project members so that they can participate in the overall development. Not only this but also our PPT template can help you showcase the work breakdown structure of your project.
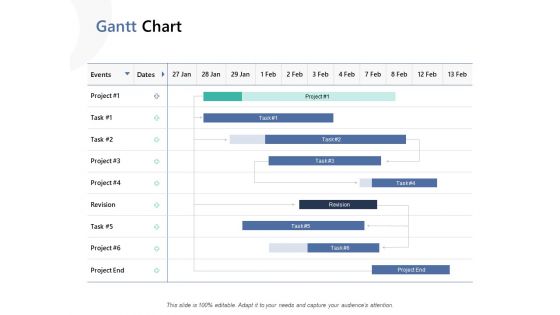
Gantt Chart Ppt PowerPoint Presentation Model Design Inspiration
Make a highly optimized project management report using this content-ready Gantt Chart PPT Diagram. Effortless yet very clear, this layout proves a useful tool to present the professional details of a task or activity. Showcase the activities and allotted time to the business executives with this Gantt Chart PowerPoint theme. List down the column tasks in various timeframes and the activities associated with each of them here. Further, plot time allocation for various tasks, monitor their actual time and make comparisons to interpret the final progress with this well-structured Gantt Chart Excel Template. You can add all the significant details of a particular project in this chart and showcase it to all the project members so that they can participate in the overall development. Not only this but also our PPT template can help you showcase the work breakdown structure of your project.
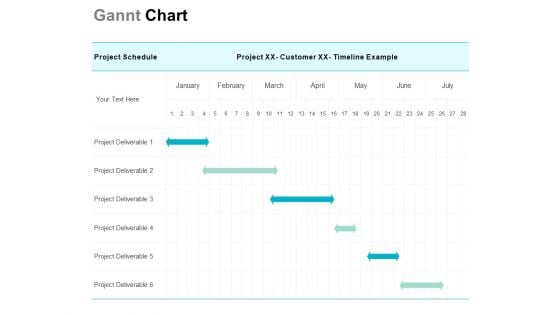
Gannt Chart Ppt PowerPoint Presentation Slides Outfit
Make a highly optimized project management report using this content-ready Gantt Chart PPT Diagram. Effortless yet very clear, this layout proves a useful tool to present the professional details of a task or activity. Showcase the activities and allotted time to the business executives with this Gantt Chart PowerPoint theme. List down the column tasks in various timeframes and the activities associated with each of them here. Further, plot time allocation for various tasks, monitor their actual time and make comparisons to interpret the final progress with this well-structured Gantt Chart Excel Template. You can add all the significant details of a particular project in this chart and showcase it to all the project members so that they can participate in the overall development. Not only this but also our PPT template can help you showcase the work breakdown structure of your project.
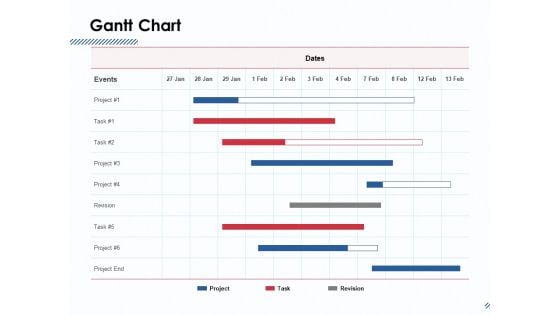
Gantt Chart Ppt PowerPoint Presentation Infographic Template Influencers
Make a highly optimized project management report using this content-ready Gantt Chart PPT Diagram. Effortless yet very clear, this layout proves a useful tool to present the professional details of a task or activity. Showcase the activities and allotted time to the business executives with this Gantt Chart PowerPoint theme. List down the column tasks in various timeframes and the activities associated with each of them here. Further, plot time allocation for various tasks, monitor their actual time and make comparisons to interpret the final progress with this well-structured Gantt Chart Excel Template. You can add all the significant details of a particular project in this chart and showcase it to all the project members so that they can participate in the overall development. Not only this but also our PPT template can help you showcase the work breakdown structure of your project.
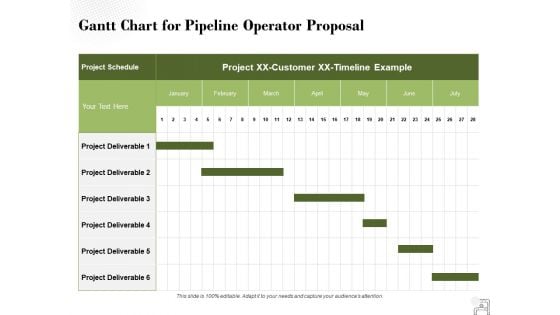
Gantt Chart For Pipeline Operator Proposal Ppt PowerPoint Presentation Styles Slide Portrait
Make a highly optimized project management report using this content-ready Gantt Chart PPT Diagram. Effortless yet very clear, this layout proves a useful tool to present the professional details of a task or activity. Showcase the activities and allotted time to the business executives with this Gantt Chart PowerPoint theme. List down the column tasks in various timeframes and the activities associated with each of them here. Further, plot time allocation for various tasks, monitor their actual time and make comparisons to interpret the final progress with this well-structured Gantt Chart Excel Template. You can add all the significant details of a particular project in this chart and showcase it to all the project members so that they can participate in the overall development. Not only this but also our PPT template can help you showcase the work breakdown structure of your project.
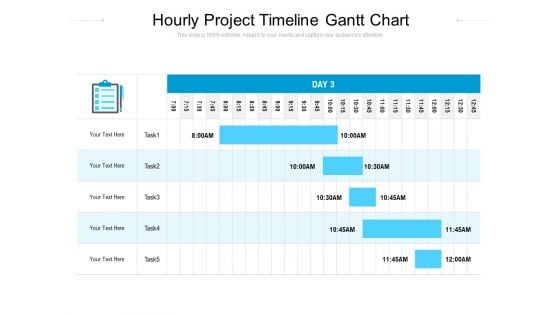
Task Hourly Schedule Gantt Chart Ppt PowerPoint Presentation Portfolio Examples PDF
Make a highly optimized project management report using this content-ready Gantt Chart PPT Diagram. Effortless yet very clear, this layout proves a useful tool to present the professional details of a task or activity. Showcase the activities and allotted time to the business executives with this Gantt Chart PowerPoint theme. List down the column tasks in various timeframes and the activities associated with each of them here. Further, plot time allocation for various tasks, monitor their actual time and make comparisons to interpret the final progress with this well-structured Gantt Chart Excel Template. You can add all the significant details of a particular project in this chart and showcase it to all the project members so that they can participate in the overall development. Not only this but also our PPT template can help you showcase the work breakdown structure of your project.
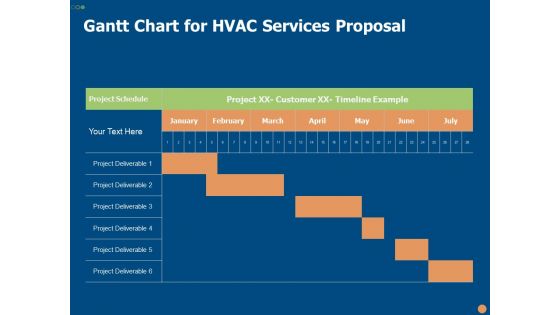
Gantt Chart For HVAC Services Proposal Ppt PowerPoint Presentation Layouts Structure PDF
Make a highly optimized project management report using this content-ready Gantt Chart PPT Diagram. Effortless yet very clear, this layout proves a useful tool to present the professional details of a task or activity. Showcase the activities and allotted time to the business executives with this Gantt Chart PowerPoint theme. List down the column tasks in various timeframes and the activities associated with each of them here. Further, plot time allocation for various tasks, monitor their actual time and make comparisons to interpret the final progress with this well-structured Gantt Chart Excel Template. You can add all the significant details of a particular project in this chart and showcase it to all the project members so that they can participate in the overall development. Not only this but also our PPT template can help you showcase the work breakdown structure of your project.
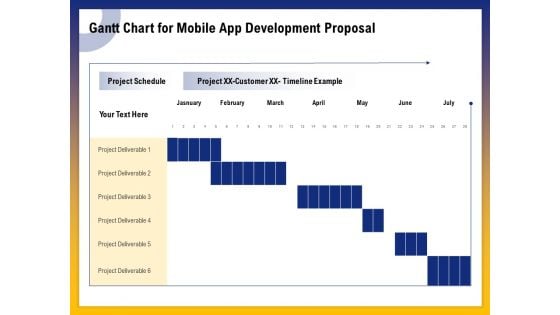
Phone Application Buildout Gantt Chart For Mobile App Development Proposal Ppt PowerPoint Presentation Gallery Vector PDF
Make a highly optimized project management report using this content-ready Gantt Chart PPT Diagram. Effortless yet very clear, this layout proves a useful tool to present the professional details of a task or activity. Showcase the activities and allotted time to the business executives with this Gantt Chart PowerPoint theme. List down the column tasks in various timeframes and the activities associated with each of them here. Further, plot time allocation for various tasks, monitor their actual time and make comparisons to interpret the final progress with this well-structured Gantt Chart Excel Template. You can add all the significant details of a particular project in this chart and showcase it to all the project members so that they can participate in the overall development. Not only this but also our PPT template can help you showcase the work breakdown structure of your project.
operating system application gantt chart for ios apps proposal ppt icon introduction pdf
Make a highly optimized project management report using this content-ready Gantt Chart PPT Diagram. Effortless yet very clear, this layout proves a useful tool to present the professional details of a task or activity. Showcase the activities and allotted time to the business executives with this Gantt Chart PowerPoint theme. List down the column tasks in various timeframes and the activities associated with each of them here. Further, plot time allocation for various tasks, monitor their actual time and make comparisons to interpret the final progress with this well-structured Gantt Chart Excel Template. You can add all the significant details of a particular project in this chart and showcase it to all the project members so that they can participate in the overall development. Not only this but also our PPT template can help you showcase the work breakdown structure of your project.
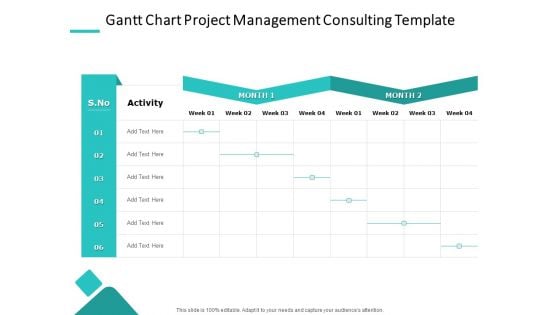
Gantt Chart Project Management Consulting Template Ppt PowerPoint Presentation Layouts Clipart Images PDF
Make a highly optimized project management report using this content-ready Gantt Chart PPT Diagram. Effortless yet very clear, this layout proves a useful tool to present the professional details of a task or activity. Showcase the activities and allotted time to the business executives with this Gantt Chart PowerPoint theme. List down the column tasks in various timeframes and the activities associated with each of them here. Further, plot time allocation for various tasks, monitor their actual time and make comparisons to interpret the final progress with this well-structured Gantt Chart Excel Template. You can add all the significant details of a particular project in this chart and showcase it to all the project members so that they can participate in the overall development. Not only this but also our PPT template can help you showcase the work breakdown structure of your project.
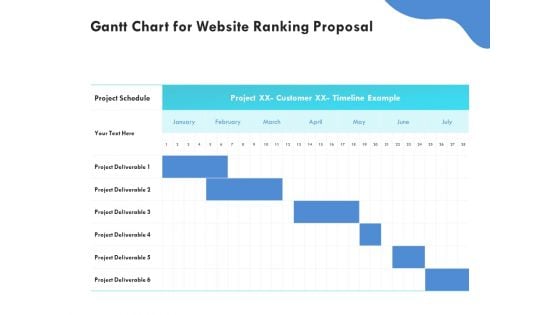
SEO Proposal Template Gantt Chart For Website Ranking Proposal Ppt PowerPoint Presentation File Layout PDF
Make a highly optimized project management report using this content-ready Gantt Chart PPT Diagram. Effortless yet very clear, this layout proves a useful tool to present the professional details of a task or activity. Showcase the activities and allotted time to the business executives with this Gantt Chart PowerPoint theme. List down the column tasks in various timeframes and the activities associated with each of them here. Further, plot time allocation for various tasks, monitor their actual time and make comparisons to interpret the final progress with this well-structured Gantt Chart Excel Template. You can add all the significant details of a particular project in this chart and showcase it to all the project members so that they can participate in the overall development. Not only this but also our PPT template can help you showcase the work breakdown structure of your project.
Heating Ventilation And Air Conditioning Installation Gantt Chart For HAVC Services Proposal Ppt Slides Icon PDF
Make a highly optimized project management report using this content-ready Gantt Chart PPT Diagram. Effortless yet very clear, this layout proves a useful tool to present the professional details of a task or activity. Showcase the activities and allotted time to the business executives with this Gantt Chart PowerPoint theme. List down the column tasks in various timeframes and the activities associated with each of them here. Further, plot time allocation for various tasks, monitor their actual time and make comparisons to interpret the final progress with this well-structured Gantt Chart Excel Template. You can add all the significant details of a particular project in this chart and showcase it to all the project members so that they can participate in the overall development. Not only this but also our PPT template can help you showcase the work breakdown structure of your project.
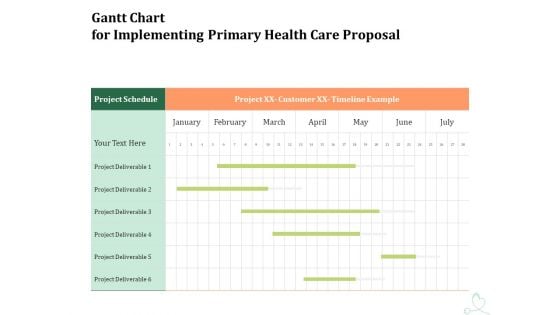
Primary Healthcare Implementation Service Gantt Chart For Implementing Primary Health Care Proposal Information PDF
Make a highly optimized project management report using this content-ready Gantt Chart PPT Diagram. Effortless yet very clear, this layout proves a useful tool to present the professional details of a task or activity. Showcase the activities and allotted time to the business executives with this Gantt Chart PowerPoint theme. List down the column tasks in various timeframes and the activities associated with each of them here. Further, plot time allocation for various tasks, monitor their actual time and make comparisons to interpret the final progress with this well-structured Gantt Chart Excel Template. You can add all the significant details of a particular project in this chart and showcase it to all the project members so that they can participate in the overall development. Not only this but also our PPT template can help you showcase the work breakdown structure of your project.
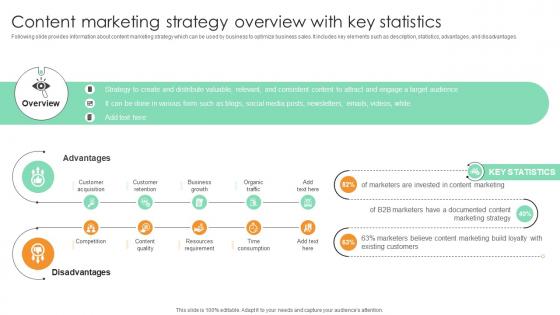
Content Marketing Strategy Overview With Key Statistics Comprehensive Guide For Marketing Technology
Following slide provides information about content marketing strategy which can be used by business to optimize business sales. It includes key elements such as description, statistics, advantages, and disadvantages.The Content Marketing Strategy Overview With Key Statistics Comprehensive Guide For Marketing Technology is a compilation of the most recent design trends as a series of slides. It is suitable for any subject or industry presentation, containing attractive visuals and photo spots for businesses to clearly express their messages. This template contains a variety of slides for the user to input data, such as structures to contrast two elements, bullet points, and slides for written information. Slidegeeks is prepared to create an impression. Following slide provides information about content marketing strategy which can be used by business to optimize business sales. It includes key elements such as description, statistics, advantages, and disadvantages.
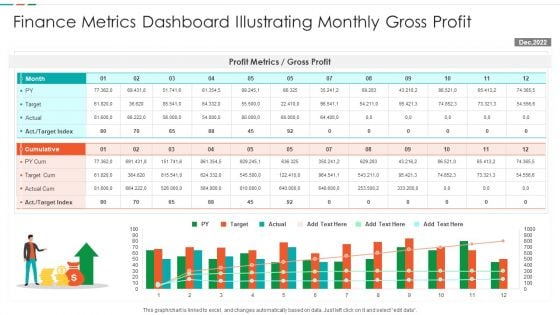
Finance Metrics Dashboard Illustrating Monthly Gross Profit Formats PDF
This graph or chart is linked to excel, and changes automatically based on data. Just left click on it and select edit data. Showcasing this set of slides titled Finance Metrics Dashboard Illustrating Monthly Gross Profit Formats PDF. The topics addressed in these templates are Profit Metrics Gross, Profit Target Cum, Actual Cum Target. All the content presented in this PPT design is completely editable. Download it and make adjustments in color, background, font etc. as per your unique business setting.
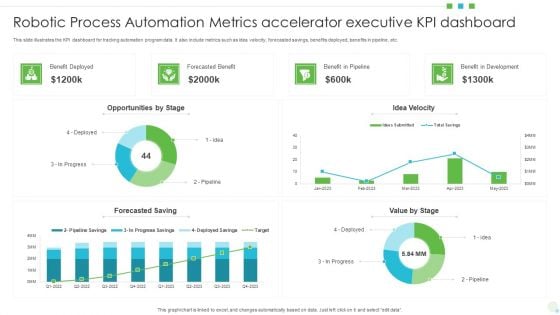
Robotic Process Automation Metrics Accelerator Executive KPI Dashboard Formats PDF
This slide illustrates the KPI dashboard for tracking automation program data. It also include metrics such as idea velocity, forecasted savings, benefits deployed, benefits in pipeline, etc. Showcasing this set of slides titled Robotic Process Automation Metrics Accelerator Executive KPI Dashboard Formats PDF. The topics addressed in these templates are Opportunities, Benefit In Development, Value. All the content presented in this PPT design is completely editable. Download it and make adjustments in color, background, font etc. as per your unique business setting.
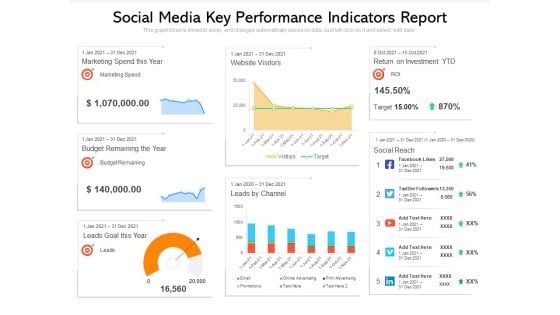
Social Media Key Performance Indicators Report Ppt PowerPoint Presentation Pictures Example File PDF
Pitch your topic with ease and precision using this social media key performance indicators report ppt powerpoint presentation pictures example file pdf. This layout presents information on social media key performance indicators report. It is also available for immediate download and adjustment. So, changes can be made in the color, design, graphics or any other component to create a unique layout.

Customer Support Center Call Center Action Plan Dashboard Highlighting Agent Diagrams PDF
This slide showcases dashboard for call center action plan which includes total calls, average answer speed, abandon rate, average calls per minute with agent performance and overall customer satisfaction score. Want to ace your presentation in front of a live audience Our Customer Support Center Call Center Action Plan Dashboard Highlighting Agent Diagrams PDF can help you do that by engaging all the users towards you.. Slidegeeks experts have put their efforts and expertise into creating these impeccable powerpoint presentations so that you can communicate your ideas clearly. Moreover, all the templates are customizable, and easy-to-edit and downloadable. Use these for both personal and commercial use.
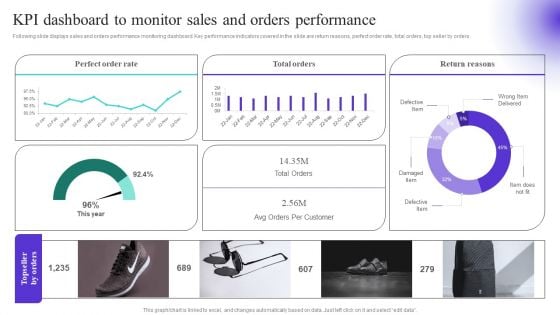
KPI Dashboard To Monitor Sales And Orders Performance Diagrams PDF
Following slide displays sales and orders performance monitoring dashboard. Key performance indicators covered in the slide are return reasons, perfect order rate, total orders, top seller by orders. Create an editable KPI Dashboard To Monitor Sales And Orders Performance Diagrams PDF that communicates your idea and engages your audience. Whether you are presenting a business or an educational presentation, pre designed presentation templates help save time. KPI Dashboard To Monitor Sales And Orders Performance Diagrams PDF is highly customizable and very easy to edit, covering many different styles from creative to business presentations. Slidegeeks has creative team members who have crafted amazing templates. So, go and get them without any delay.
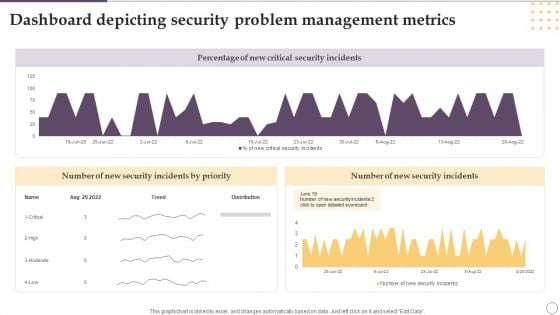
Dashboard Depicting Security Problem Management Metrics Ppt Gallery Designs PDF
This graph or chart is linked to excel, and changes automatically based on data. Just left click on it and select Edit Data. Showcasing this set of slides titled Dashboard Depicting Security Problem Management Metrics Ppt Gallery Designs PDF. The topics addressed in these templates are Percentage, New Critical, Security Incidents. All the content presented in this PPT design is completely editable. Download it and make adjustments in color, background, font etc. as per your unique business setting.


 Continue with Email

 Home
Home


