Business Snapshot
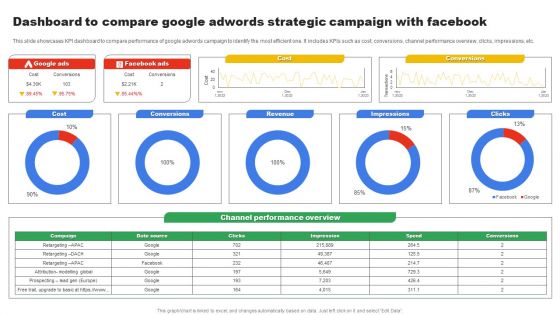
Dashboard To Compare Google Adwords Strategic Campaign With Facebook Microsoft PDF
This slide showcases KPI dashboard to compare performance of google adwords campaign to identify the most efficient one. It includes KPIs such as cost, conversions, channel performance overview, clicks, impressions, etc. Showcasing this set of slides titled Dashboard To Compare Google Adwords Strategic Campaign With Facebook Microsoft PDF. The topics addressed in these templates are Cost, Conversions, Revenue. All the content presented in this PPT design is completely editable. Download it and make adjustments in color, background, font etc. as per your unique business setting.
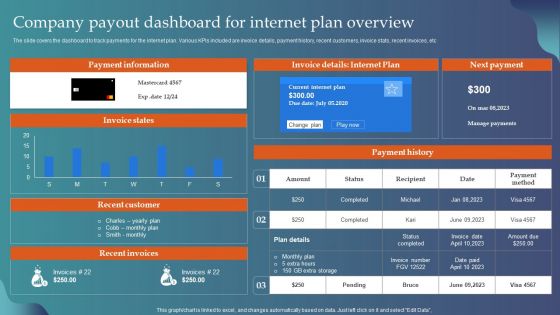
Company Payout Dashboard For Internet Plan Overview Ppt Layouts Templates PDF
The slide covers the dashboard to track payments for the internet plan. Various KPIs included are invoice details, payment history, recent customers, invoice stats, recent invoices, etc. Showcasing this set of slides titled Company Payout Dashboard For Internet Plan Overview Ppt Layouts Templates PDF. The topics addressed in these templates are Payment Information, Invoice Details, Internet Plan, Next Payment. All the content presented in this PPT design is completely editable. Download it and make adjustments in color, background, font etc. as per your unique business setting.
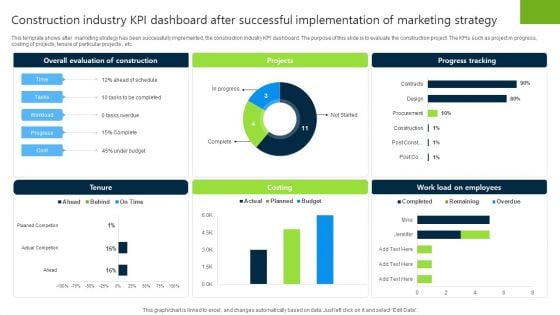
Construction Industry KPI Dashboard After Successful Implementation Of Marketing Strategy Sample PDF
This template shows after marketing strategy has been successfully implemented, the construction industry KPI dashboard. The purpose of this slide is to evaluate the construction project. The KPIs such as project in progress, costing of projects, tenure of particular projects , etc. Showcasing this set of slides titled Construction Industry KPI Dashboard After Successful Implementation Of Marketing Strategy Sample PDF. The topics addressed in these templates are Projetcs, Progress Tracking, Costing. All the content presented in this PPT design is completely editable. Download it and make adjustments in color, background, font etc. as per your unique business setting.
Planning Transnational Technique To Improve International Scope Dashboard Tracking Post Expansion Revenue Structure PDF
This slide covers the dashboard for analyzing fast food business sales by location. It includes KPIs such as the companys revenue by location, by type, top 5 expenses by account, top 5 expenses by department, cost of revenue year to date, etc. If your project calls for a presentation, then Slidegeeks is your go to partner because we have professionally designed, easy to edit templates that are perfect for any presentation. After downloading, you can easily edit Planning Transnational Technique To Improve International Scope Dashboard Tracking Post Expansion Revenue Structure PDF and make the changes accordingly. You can rearrange slides or fill them with different images. Check out all the handy templates
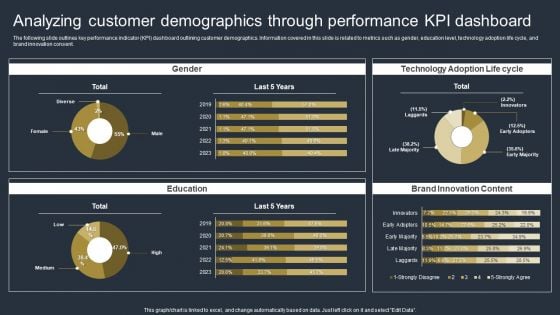
Comprehensive Market Research Guide Analyzing Customer Demographics Through Demonstration PDF
The following slide outlines key performance indicator KPI dashboard outlining customer demographics. Information covered in this slide is related to metrics such as gender, education level, technology adoption life cycle, and brand innovation consent. Create an editable Comprehensive Market Research Guide Analyzing Customer Demographics Through Demonstration PDF that communicates your idea and engages your audience. Whether youre presenting a business or an educational presentation, pre-designed presentation templates help save time. Comprehensive Market Research Guide Analyzing Customer Demographics Through Demonstration PDF is highly customizable and very easy to edit, covering many different styles from creative to business presentations. Slidegeeks has creative team members who have crafted amazing templates. So, go and get them without any delay.
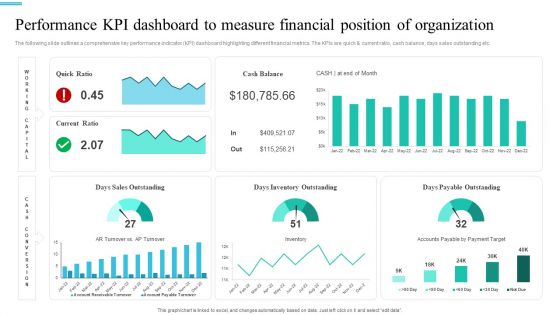
Monetary Planning And Evaluation Guide Performance KPI Dashboard To Measure Financial Position Of Organization Ppt File Slides PDF
The following slide outlines a comprehensive key performance indicator KPI dashboard highlighting different financial metrics. The KPIs are quick and current ratio, cash balance, days sales outstanding etc. The best PPT templates are a great way to save time, energy, and resources. Slidegeeks have 100 percent editable powerpoint slides making them incredibly versatile. With these quality presentation templates, you can create a captivating and memorable presentation by combining visually appealing slides and effectively communicating your message. Download Monetary Planning And Evaluation Guide Performance KPI Dashboard To Measure Financial Position Of Organization Ppt File Slides PDF from Slidegeeks and deliver a wonderful presentation.
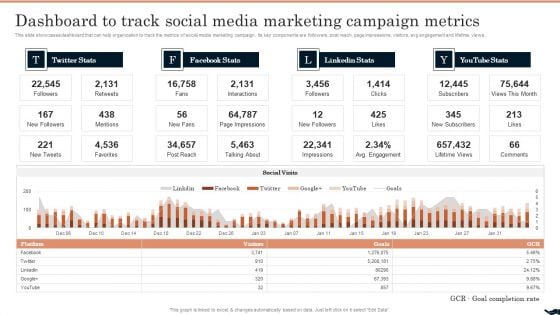
Generating Leads Through Dashboard To Track Social Media Marketing Campaign Metrics Pictures PDF
This slide showcases dashboard that can help organization to track the metrics of social media marketing campaign. Its key components are followers, post reach, page impressions, visitors, avg engagement and lifetime views. Present like a pro with Generating Leads Through Dashboard To Track Social Media Marketing Campaign Metrics Pictures PDF Create beautiful presentations together with your team, using our easy-to-use presentation slides. Share your ideas in real-time and make changes on the fly by downloading our templates. So whether youre in the office, on the go, or in a remote location, you can stay in sync with your team and present your ideas with confidence. With Slidegeeks presentation got a whole lot easier. Grab these presentations today.
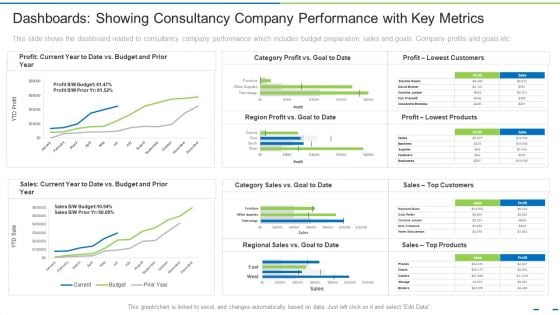
Dashboards Showing Consultancy Company Performance With Key Metrics Ppt Ideas Smartart PDF
This slide shows the dashboard related to consultancy company performance which includes budget preparation, sales and goals. Company profits and goals etc. Deliver an awe-inspiring pitch with this creative dashboards showing consultancy company performance with key metrics ppt ideas smartart pdf bundle. Topics like budget, products, customers can be discussed with this completely editable template. It is available for immediate download depending on the needs and requirements of the user.
Marketers Guide To Data Analysis Optimization KPI Dashboard For Tracking Email Marketing Campaign Infographics PDF
This slide covers the dashboard for analyzing email marketing metrics such as overall open rate, click-through rate, click-to-open ratio, unsubscribe rate, hard bounce rate, soft rate, monthly open rate, total monthly subscribers, etc. Presenting this PowerPoint presentation, titled Marketers Guide To Data Analysis Optimization KPI Dashboard For Tracking Email Marketing Campaign Infographics PDF, with topics curated by our researchers after extensive research. This editable presentation is available for immediate download and provides attractive features when used. Download now and captivate your audience. Presenting this Marketers Guide To Data Analysis Optimization KPI Dashboard For Tracking Email Marketing Campaign Infographics PDF. Our researchers have carefully researched and created these slides with all aspects taken into consideration. This is a completely customizable Marketers Guide To Data Analysis Optimization KPI Dashboard For Tracking Email Marketing Campaign Infographics PDF that is available for immediate downloading. Download now and make an impact on your audience. Highlight the attractive features available with our PPTs.
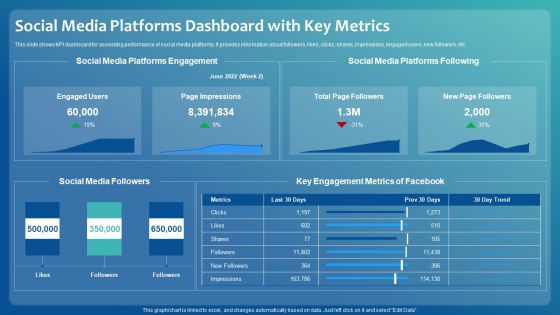
Improving Digital Community Engagement Strategy Social Media Platforms Dashboard With Key Metrics Professional PDF
This slide shows KPI dashboard for assessing performance of social media platforms. It provides information about followers, likes, clicks, shares, impressions, engaged users, new followers, etc. Deliver and pitch your topic in the best possible manner with this Improving Digital Community Engagement Strategy Social Media Platforms Dashboard With Key Metrics Professional PDF. Use them to share invaluable insights on Social Media Platforms Engagement, Key Engagement Metrics and impress your audience. This template can be altered and modified as per your expectations. So, grab it now.
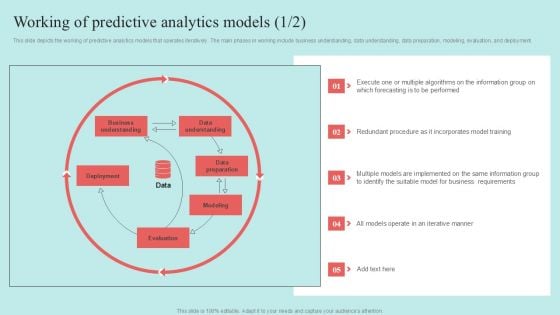
Predictive Data Model Working Of Predictive Analytics Models Pictures PDF
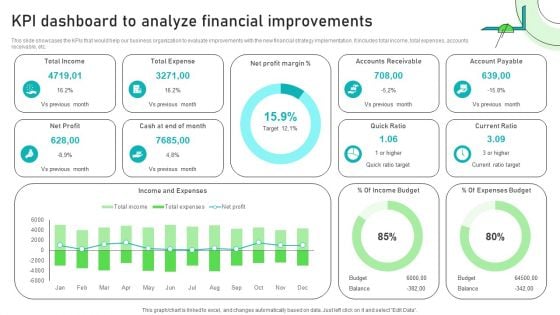
Adjusting Financial Strategies And Planning KPI Dashboard To Analyze Financial Improvements Inspiration PDF
This slide showcases the KPIs that would help our business organization to evaluate improvements with the new financial strategy implementation. It includes total income, total expenses, accounts receivable, etc. The best PPT templates are a great way to save time, energy, and resources. Slidegeeks have 100 percent editable powerpoint slides making them incredibly versatile. With these quality presentation templates, you can create a captivating and memorable presentation by combining visually appealing slides and effectively communicating your message. Download Adjusting Financial Strategies And Planning KPI Dashboard To Analyze Financial Improvements Inspiration PDF from Slidegeeks and deliver a wonderful presentation.
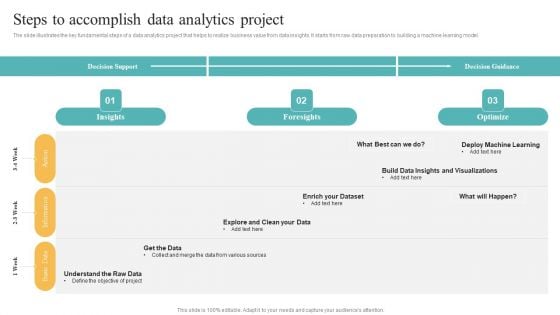
Transformation Toolkit Competitive Intelligence Information Analysis Steps To Accomplish Data Analytics Project Slides PDF
The slide illustrates the key fundamental steps of a data analytics project that helps to realize business value from data insights. It starts from raw data preparation to building a machine learning model. Do you know about Slidesgeeks Transformation Toolkit Competitive Intelligence Information Analysis Steps To Accomplish Data Analytics Project Slides PDF These are perfect for delivering any kind od presentation. Using it, create PowerPoint presentations that communicate your ideas and engage audiences. Save time and effort by using our pre designed presentation templates that are perfect for a wide range of topic. Our vast selection of designs covers a range of styles, from creative to business, and are all highly customizable and easy to edit. Download as a PowerPoint template or use them as Google Slides themes.
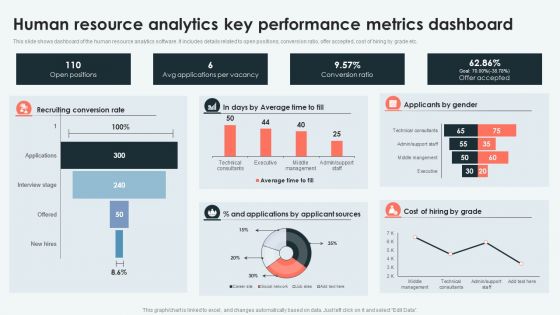
Analyzing And Deploying Human Resource Analytics Key Performance Metrics Dashboard Themes PDF
This slide shows dashboard of the human resource analytics software. It includes details related to open positions, conversion ratio, offer accepted, cost of hiring by grade etc. Do you have to make sure that everyone on your team knows about any specific topic I yes, then you should give Analyzing And Deploying Human Resource Analytics Key Performance Metrics Dashboard Themes PDF a try. Our experts have put a lot of knowledge and effort into creating this impeccable Analyzing And Deploying Human Resource Analytics Key Performance Metrics Dashboard Themes PDF. You can use this template for your upcoming presentations, as the slides are perfect to represent even the tiniest detail. You can download these templates from the Slidegeeks website and these are easy to edit. So grab these today.
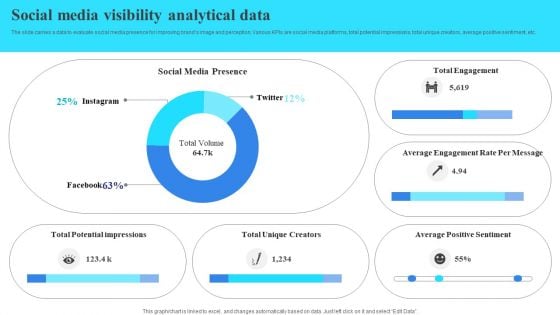
Social Media Visibility Analytical Data Inspiration PDF
The slide carries a data to evaluate social media presence for improving brands image and perception. Various KPIs are social media platforms, total potential impressions, total unique creators, average positive sentiment, etc. Showcasing this set of slides titled Social Media Visibility Analytical Data Inspiration PDF. The topics addressed in these templates are Presence, Creators, Total Engagement. All the content presented in this PPT design is completely editable. Download it and make adjustments in color, background, font etc. as per your unique business setting.
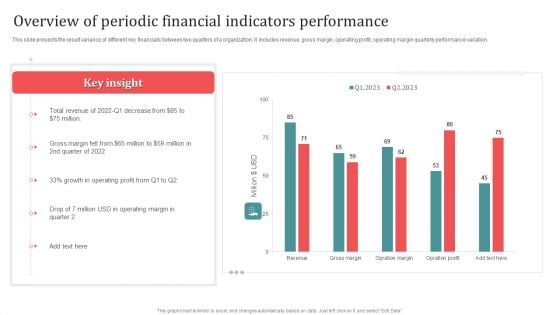
Overview Of Periodic Financial Indicators Performance Designs PDF
This slide presents the result variance of different key financials between two quarters of a organization. It includes revenue, gross margin, operating profit, operating margin quarterly performance variation. Showcasing this set of slides titled Overview Of Periodic Financial Indicators Performance Designs PDF. The topics addressed in these templates are Overview Of Periodic, Financial Indicators Performance. All the content presented in this PPT design is completely editable. Download it and make adjustments in color, background, font etc. as per your unique business setting.
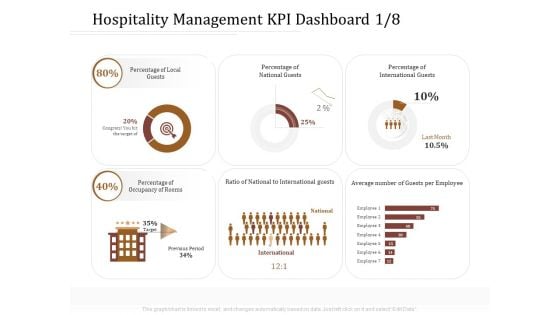
Key Metrics Hotel Administration Management Hospitality Management KPI Dashboard Average Graphics PDF
Presenting this set of slides with name key metrics hotel administration management hospitality management kpi dashboard average graphics pdf. The topics discussed in these slides are local guests, national guests, international guests, occupancy of rooms. This is a completely editable PowerPoint presentation and is available for immediate download. Download now and impress your audience.
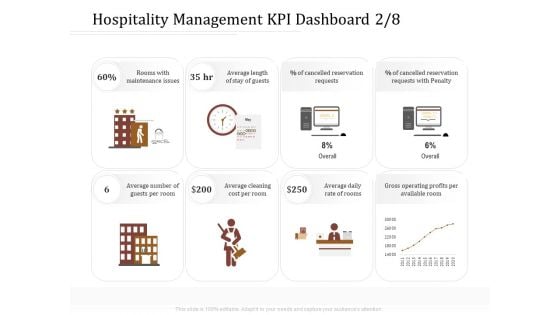
Key Metrics Hotel Administration Management Hospitality Management KPI Dashboard Cost Slides PDF
Presenting this set of slides with name key metrics hotel administration management hospitality management kpi dashboard cost slides pdf. The topics discussed in these slides are maintenance, average, reservation, penalty, cost. This is a completely editable PowerPoint presentation and is available for immediate download. Download now and impress your audience.
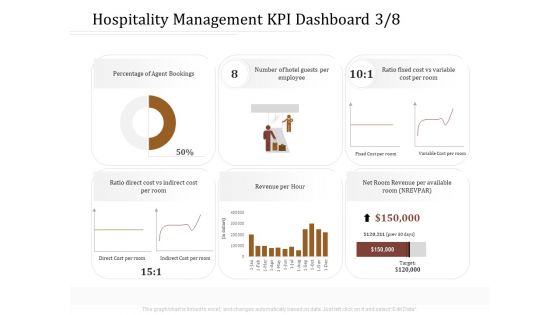
Key Metrics Hotel Administration Management Hospitality Management KPI Dashboard Direct Sample PDF
Presenting this set of slides with name key metrics hotel administration management hospitality management kpi dashboard direct sample pdf. The topics discussed in these slides are agent, employee, cost, revenue. This is a completely editable PowerPoint presentation and is available for immediate download. Download now and impress your audience.
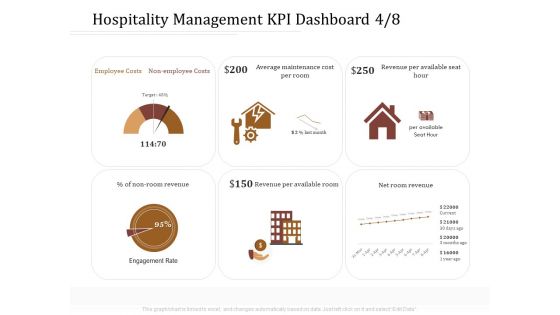
Key Metrics Hotel Administration Management Hospitality Management KPI Dashboard Employee Information PDF
Presenting this set of slides with name key metrics hotel administration management hospitality management kpi dashboard employee information pdf. The topics discussed in these slides are costs, maintenance, revenue, average. This is a completely editable PowerPoint presentation and is available for immediate download. Download now and impress your audience.
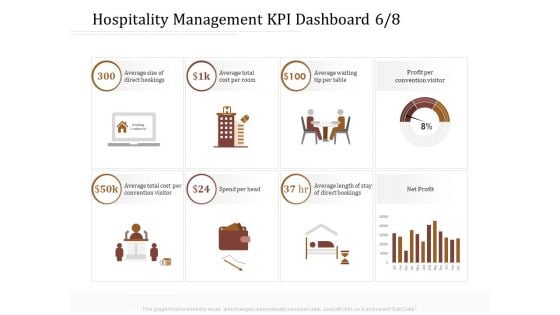
Key Metrics Hotel Administration Management Hospitality Management KPI Dashboard Head Information PDF
Presenting this set of slides with name key metrics hotel administration management hospitality management kpi dashboard head information pdf. The topics discussed in these slides are average, cost, convention visitor, net profit. This is a completely editable PowerPoint presentation and is available for immediate download. Download now and impress your audience.
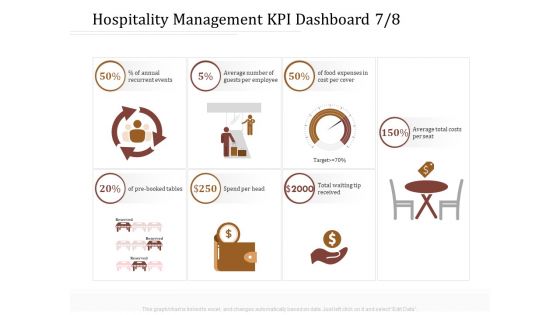
Key Metrics Hotel Administration Management Hospitality Management KPI Dashboard Number Structure PDF
Presenting this set of slides with name key metrics hotel administration management hospitality management kpi dashboard number structure pdf. The topics discussed in these slides are recurrent events, average, cost, target. This is a completely editable PowerPoint presentation and is available for immediate download. Download now and impress your audience.
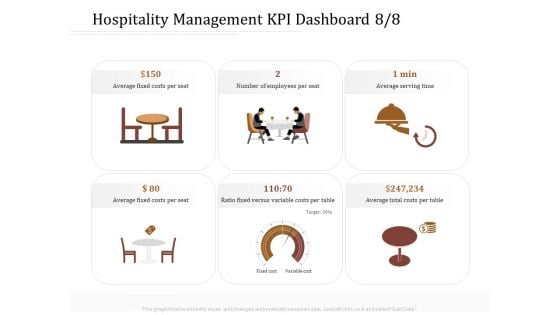
Key Metrics Hotel Administration Management Hospitality Management KPI Dashboard Per Download PDF
Presenting this set of slides with name key metrics hotel administration management hospitality management kpi dashboard per download pdf. The topics discussed in these slides are costs, average, target. This is a completely editable PowerPoint presentation and is available for immediate download. Download now and impress your audience.
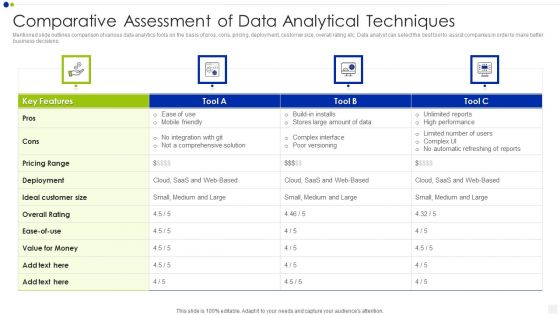
Comparative Assessment Of Data Analytical Techniques Download PDF
Mentioned slide outlines comparison of various data analytics tools on the basis of pros, cons, pricing, deployment, customer size, overall rating etc. Data analyst can select the best tool to assist companies in order to make better business decisions. Showcasing this set of slides titled comparative assessment of data analytical techniques download pdf. The topics addressed in these templates are customer, deployment, pricing range. All the content presented in this PPT design is completely editable. Download it and make adjustments in color, background, font etc. as per your unique business setting.
Tracking Performance Of Internet Marketing Using Key Performance Indicators Sample PDF
The following slide highlights key performance indicators for tracking digital advertising performance to improve website traffic and revenue. It includes KPIs such as click through rate, conversion rate, return on ad spend, clicks etc. Showcasing this set of slides titled Tracking Performance Of Internet Marketing Using Key Performance Indicators Sample PDF. The topics addressed in these templates are Key Performance Indicators, Video Completion Rate, Conversion Rate. All the content presented in this PPT design is completely editable. Download it and make adjustments in color, background, font etc. as per your unique business setting.
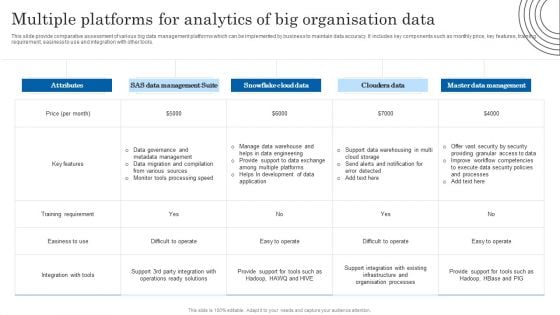
Multiple Platforms For Analytics Of Big Organisation Data Structure PDF
This slide provide comparative assessment of various big data management platforms which can be implemented by business to maintain data accuracy. It includes key components such as monthly price, key features, training requirement, easiness to use and integration with other tools. Showcasing this set of slides titled Multiple Platforms For Analytics Of Big Organisation Data Structure PDF. The topics addressed in these templates are Data Governance, Data Migration, Various Sources. All the content presented in this PPT design is completely editable. Download it and make adjustments in color, background, font etc. as per your unique business setting.
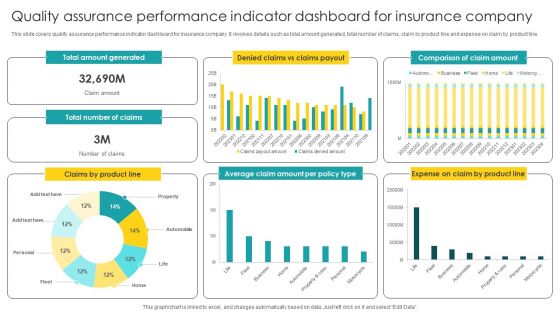
Quality Assurance Performance Indicator Dashboard For Insurance Company Brochure PDF
Pitch your topic with ease and precision using this Quality Assurance Performance Indicator Dashboard For Insurance Company Brochure PDF. This layout presents information on Performance Indicator, Dashboard For Insurance Company. It is also available for immediate download and adjustment. So, changes can be made in the color, design, graphics or any other component to create a unique layout.
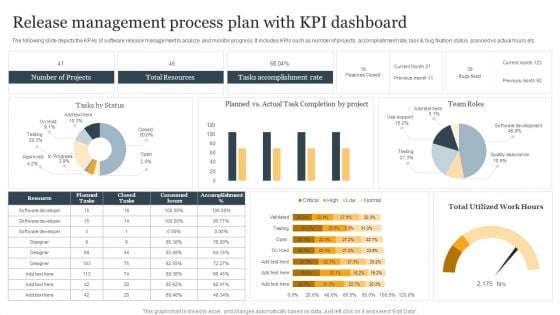
Release Management Process Plan With KPI Dashboard Ppt Infographic Template Structure PDF
The following slide depicts the KPAs of software release management to analyze and monitor progress. It includes KPIs such as number of projects, accomplishment rate, task and bug fixation status, planned vs actual hours etc. Showcasing this set of slides titled Release Management Process Plan With KPI Dashboard Ppt Infographic Template Structure PDF. The topics addressed in these templates are Number Of Projects, Total Resources, Tasks Accomplishment Rate. All the content presented in this PPT design is completely editable. Download it and make adjustments in color, background, font etc. as per your unique business setting.
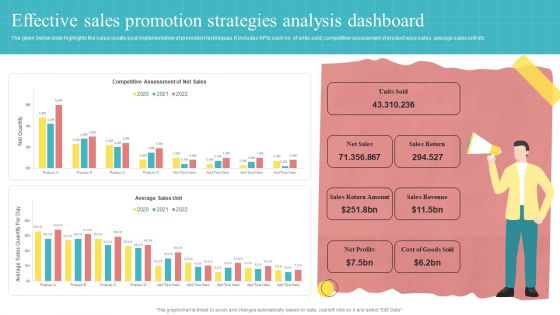
Effective Sales Promotion Strategies Analysis Dashboard Ppt PowerPoint Presentation Slides Background Designs PDF
The given below slide highlights the sales results post implementation of promotion techniques. It includes KPIs such no. of units sold, competitive assessment of product wise sales, average sales unit etc.Showcasing this set of slides titled Effective Sales Promotion Strategies Analysis Dashboard Ppt PowerPoint Presentation Slides Background Designs PDF. The topics addressed in these templates are Return Amount, Sales Return, Sales Revenue. All the content presented in this PPT design is completely editable. Download it and make adjustments in color, background, font etc. as per your unique business setting.
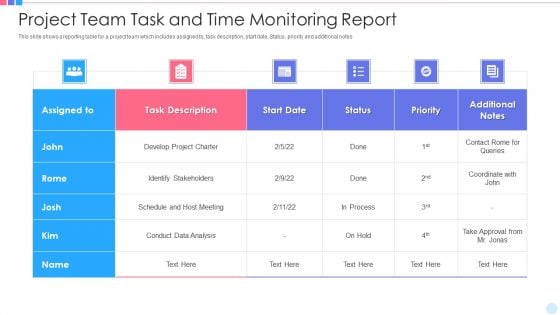
Project Team Task And Time Monitoring Report Topics PDF
This slide shows a reporting table for a project team which includes assigned to, task description, start date, Status, priority and additional notes Showcasing this set of slides titled project team task and time monitoring report topics pdf. The topics addressed in these templates are develop project charter, conduct data analysis. All the content presented in this PPT design is completely editable. Download it and make adjustments in color, background, font etc. as per your unique business setting.

Prevention Of Information KPI Dashboard To Monitor Cyber Security Performance Information PDF
The purpose of this slide is to highlight key performance indicator KPI dashboard which can be used to track the performance of organization cyber security. The KPI metrics covered in the slide are asset type control, control issues by standard AND regulation etc. This Prevention Of Information KPI Dashboard To Monitor Cyber Security Performance Information PDF is perfect for any presentation, be it in front of clients or colleagues. It is a versatile and stylish solution for organizing your meetings. The Prevention Of Information KPI Dashboard To Monitor Cyber Security Performance Information PDF features a modern design for your presentation meetings. The adjustable and customizable slides provide unlimited possibilities for acing up your presentation. Slidegeeks has done all the homework before launching the product for you. So, dont wait, grab the presentation templates today
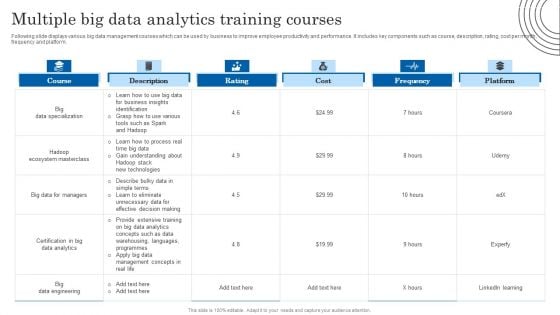
Multiple Big Data Analytics Training Courses Mockup PDF
Following slide displays various big data management courses which can be used by business to improve employee productivity and performance. It includes key components such as course, description, rating, cost per month, frequency and platform. Pitch your topic with ease and precision using this Multiple Big Data Analytics Training Courses Mockup PDF. This layout presents information on Data Specialization, Management Concepts, Business. It is also available for immediate download and adjustment. So, changes can be made in the color, design, graphics or any other component to create a unique layout.
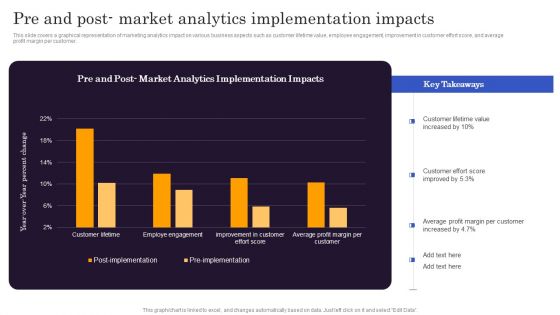
Marketers Guide To Data Analysis Optimization Pre And Post Market Analytics Implementation Impacts Formats PDF
This slide covers a graphical representation of marketing analytics impact on various business aspects such as customer lifetime value, employee engagement, improvement in customer effort score, and average profit margin per customer. Do you know about Slidesgeeks Marketers Guide To Data Analysis Optimization Pre And Post Market Analytics Implementation Impacts Formats PDF. These are perfect for delivering any kind od presentation. Using it, create PowerPoint presentations that communicate your ideas and engage audiences. Save time and effort by using our pre designed presentation templates that are perfect for a wide range of topic. Our vast selection of designs covers a range of styles, from creative to business, and are all highly customizable and easy to edit. Download as a PowerPoint template or use them as Google Slides themes.
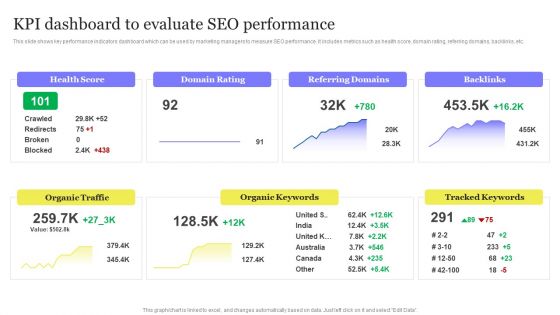
Enhancing Digital Visibility Using SEO Content Strategy KPI Dashboard To Evaluate SEO Performance Diagrams PDF
This slide shows key performance indicators dashboard which can be used by marketing managers to measure SEO performance. It includes metrics such as health score, domain rating, referring domains, backlinks, etc. This Enhancing Digital Visibility Using SEO Content Strategy KPI Dashboard To Evaluate SEO Performance Diagrams PDF is perfect for any presentation, be it in front of clients or colleagues. It is a versatile and stylish solution for organizing your meetings. The Enhancing Digital Visibility Using SEO Content Strategy KPI Dashboard To Evaluate SEO Performance Diagrams PDF features a modern design for your presentation meetings. The adjustable and customizable slides provide unlimited possibilities for acing up your presentation. Slidegeeks has done all the homework before launching the product for you. So, do not wait, grab the presentation templates today
Marketers Guide To Data Analysis Optimization KPI Dashboard For Tracking Paid Ad Campaign Performance Clipart PDF
This slide covers the dashboard for analyzing paid search metrics such as ad cost, clicks, impressions, click-through rate, cost per conversion, conversion rate, cost per click, etc. Here you can discover an assortment of the finest PowerPoint and Google Slides templates. With these templates, you can create presentations for a variety of purposes while simultaneously providing your audience with an eye catching visual experience. Download Marketers Guide To Data Analysis Optimization KPI Dashboard For Tracking Paid Ad Campaign Performance Clipart PDF to deliver an impeccable presentation. These templates will make your job of preparing presentations much quicker, yet still, maintain a high level of quality. Slidegeeks has experienced researchers who prepare these templates and write high quality content for you. Later on, you can personalize the content by editing the Marketers Guide To Data Analysis Optimization KPI Dashboard For Tracking Paid Ad Campaign Performance Clipart PDF.
Consumer Journey Mapping Techniques Dashboard For Tracking Customer Service Team Performance Summary PDF
This slide covers the KPI dashboard for analyzing the performance of client support department. It includes metrics such as first call resolution, unresolved calls, average response rate, the best day to call, average time to solve issues, etc. Pitch your topic with ease and precision using this Consumer Journey Mapping Techniques Dashboard For Tracking Customer Service Team Performance Summary PDF. This layout presents information on Dashboard For Tracking Customer, Service Team Performance. It is also available for immediate download and adjustment. So, changes can be made in the color, design, graphics or any other component to create a unique layout.
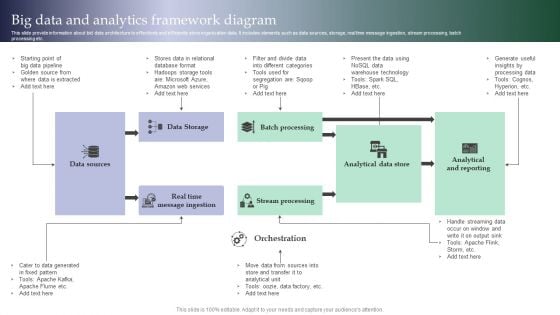
Big Data And Analytics Framework Diagram Introduction PDF
This slide provide information about bid data architecture to effectively and efficiently store organization data. It includes elements such as data sources, storage, real time message ingestion, stream processing, batch processing etc. Showcasing this set of slides titled Big Data And Analytics Framework Diagram Introduction PDF. The topics addressed in these templates are Data Sources, Data Storage, Batch Processing. All the content presented in this PPT design is completely editable. Download it and make adjustments in color, background, font etc. as per your unique business setting.
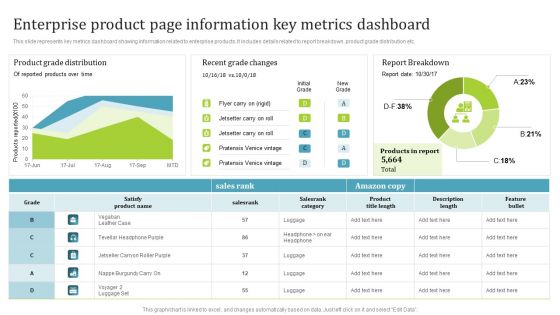
PIM Software Deployment To Enhance Conversion Rates Enterprise Product Page Information Key Metrics Dashboard Mockup PDF
This slide represents key metrics dashboard showing information related to enterprise products. It includes details related to report breakdown, product grade distribution etc. This PIM Software Deployment To Enhance Conversion Rates Enterprise Product Page Information Key Metrics Dashboard Mockup PDF from Slidegeeks makes it easy to present information on your topic with precision. It provides customization options, so you can make changes to the colors, design, graphics, or any other component to create a unique layout. It is also available for immediate download, so you can begin using it right away. Slidegeeks has done good research to ensure that you have everything you need to make your presentation stand out. Make a name out there for a brilliant performance.
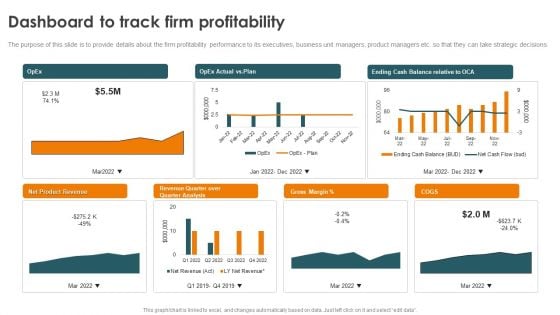
Profitability Modelling Framework Dashboard To Track Firm Profitability Topics PDF
The purpose of this slide is to provide details about the firm profitability performance to its executives, business unit managers, product managers etc. so that they can take strategic decisions. Find highly impressive Profitability Modelling Framework Dashboard To Track Firm Profitability Topics PDF on Slidegeeks to deliver a meaningful presentation. You can save an ample amount of time using these presentation templates. No need to worry to prepare everything from scratch because Slidegeeks experts have already done a huge research and work for you. You need to download Profitability Modelling Framework Dashboard To Track Firm Profitability Topics PDF for your upcoming presentation. All the presentation templates are 100 percent editable and you can change the color and personalize the content accordingly. Download now.
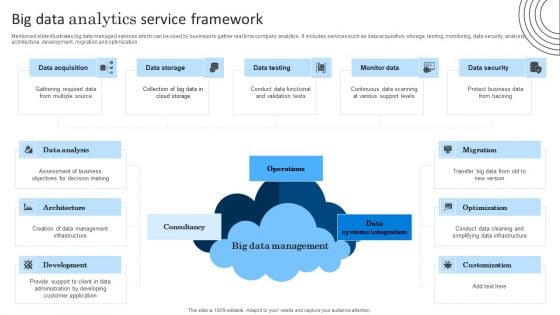
Big Data Analytics Service Framework Graphics PDF
Mentioned slide illustrates big data managed services which can be used by business to gather real time company analytics. It includes services such as data acquisition, storage, testing, monitoring, data security, analysis, architecture, development, migration and optimization. Persuade your audience using this Big Data Analytics Service Framework Graphics PDF. This PPT design covers one stages, thus making it a great tool to use. It also caters to a variety of topics including Data Analysis, Assessment Of Business, Management Infrastructure. Download this PPT design now to present a convincing pitch that not only emphasizes the topic but also showcases your presentation skills.
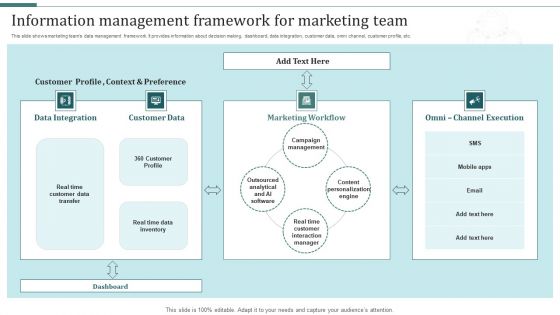
Information Management Framework For Marketing Team Summary PDF
This slide shows marketing teams data management framework. It provides information about decision making, dashboard, data integration, customer data, omni channel, customer profile, etc. Showcasing this set of slides titled Information Management Framework For Marketing Team Summary PDF. The topics addressed in these templates are Data Integration, Customer Data, Marketing Workflow. All the content presented in this PPT design is completely editable. Download it and make adjustments in color, background, font etc. as per your unique business setting.

Data Science Model For Healthcare Analytics Microsoft PDF
The following slide presents a framework showing key steps to execute healthcare analytics using data science. It includes key components such as data fusion, data integration, data driven models, knowledge driven models, data analytics, decision analytics, analytics outcome, etc. Showcasing this set of slides titled Data Science Model For Healthcare Analytics Microsoft PDF. The topics addressed in these templates are Analytics Methods, Analytics Models, Analytics Options. All the content presented in this PPT design is completely editable. Download it and make adjustments in color, background, font etc. as per your unique business setting.
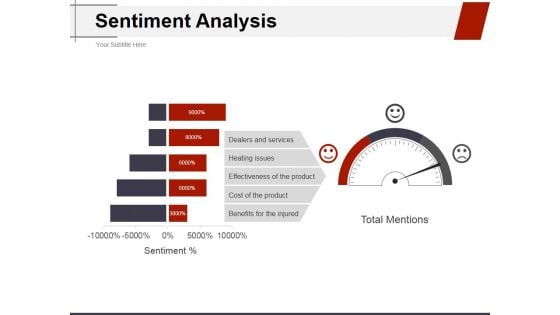
Sentiment Analysis Ppt PowerPoint Presentation Ideas Structure
This is a sentiment analysis ppt powerpoint presentation ideas structure. This is a three stage process. The stages in this process are dealers and services, heating issues, effectiveness of the product, cost of the product, benefits for the injured.
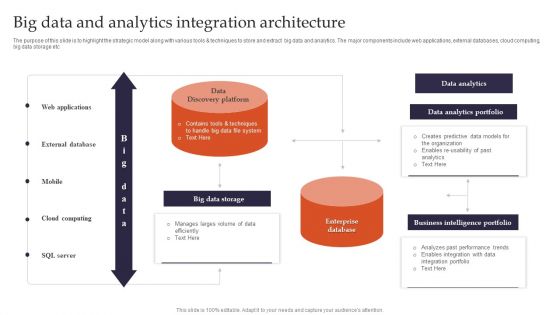
Big Data And Analytics Integration Architecture Themes PDF
The purpose of this slide is to highlight the strategic model along with various tools and techniques to store and extract big data and analytics. The major components include web applications, external databases, cloud computing, big data storage etc. Showcasing this set of slides titled Big Data And Analytics Integration Architecture Themes PDF. The topics addressed in these templates are Data Discovery Platform, Big Data Storage, Enterprise Database. All the content presented in this PPT design is completely editable. Download it and make adjustments in color, background, font etc. as per your unique business setting.
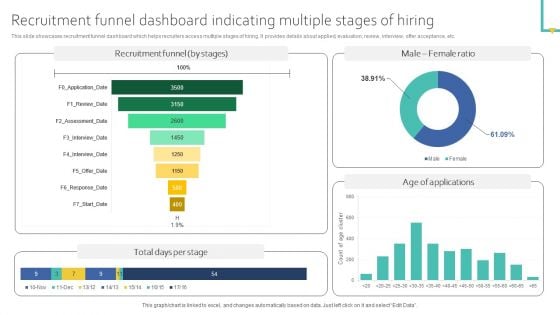
Recruitment Funnel Dashboard Indicating Multiple Stages Of Hiring Ideas PDF
This slide showcases recruitment funnel dashboard which helps recruiters access multiple stages of hiring. It provides details about applied, evaluation, review, interview, offer acceptance, etc. Get a simple yet stunning designed Recruitment Funnel Dashboard Indicating Multiple Stages Of Hiring Ideas PDF. It is the best one to establish the tone in your meetings. It is an excellent way to make your presentations highly effective. So, download this PPT today from Slidegeeks and see the positive impacts. Our easy to edit Recruitment Funnel Dashboard Indicating Multiple Stages Of Hiring Ideas PDF can be your go to option for all upcoming conferences and meetings. So, what are you waiting for Grab this template today.
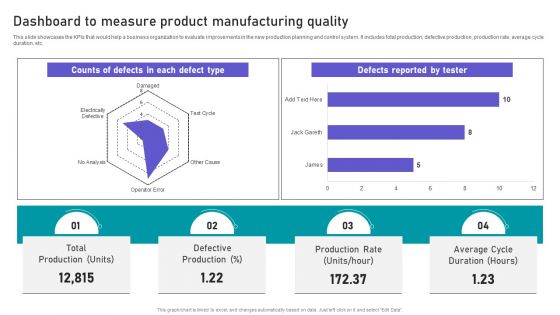
Effective Manufacturing Planning And Control Administration System Dashboard To Measure Product Pictures PDF
This slide showcases the KPIs that would help a business organization to evaluate improvements in the new production planning and control system. It includes total production, defective production, production rate, average cycle duration, etc. Here you can discover an assortment of the finest PowerPoint and Google Slides templates. With these templates, you can create presentations for a variety of purposes while simultaneously providing your audience with an eye-catching visual experience. Download Effective Manufacturing Planning And Control Administration System Dashboard To Measure Product Pictures PDF to deliver an impeccable presentation. These templates will make your job of preparing presentations much quicker, yet still, maintain a high level of quality. Slidegeeks has experienced researchers who prepare these templates and write high-quality content for you. Later on, you can personalize the content by editing the Effective Manufacturing Planning And Control Administration System Dashboard To Measure Product Pictures PDF.
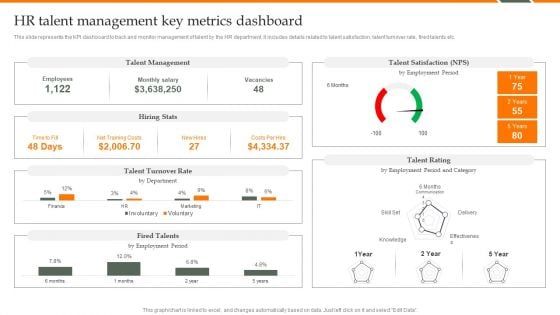
Human Resource Analytics HR Talent Management Key Metrics Dashboard Brochure PDF
This slide represents the KPI dashboard to track and monitor management of talent by the HR department. It includes details related to talent satisfaction, talent turnover rate, fired talents etc. Coming up with a presentation necessitates that the majority of the effort goes into the content and the message you intend to convey. The visuals of a PowerPoint presentation can only be effective if it supplements and supports the story that is being told. Keeping this in mind our experts created Human Resource Analytics HR Talent Management Key Metrics Dashboard Brochure PDF to reduce the time that goes into designing the presentation. This way, you can concentrate on the message while our designers take care of providing you with the right template for the situation.
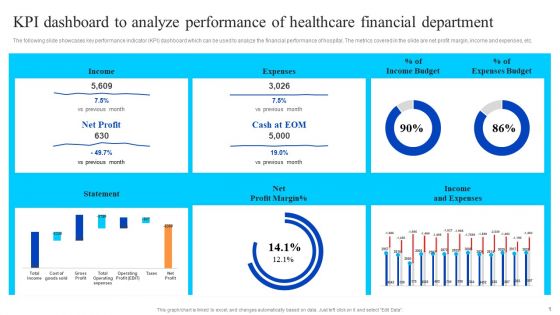
KPI Dashboard To Analyze Performance Of Healthcare Financial Department Summary PDF
The following slide showcases key performance indicator KPI dashboard which can be used to analyze the financial performance of hospital. The metrics covered in the slide are net profit margin, income and expenses, etc. Do you have an important presentation coming up Are you looking for something that will make your presentation stand out from the rest Look no further than KPI Dashboard To Analyze Performance Of Healthcare Financial Department Summary PDF. With our professional designs, you can trust that your presentation will pop and make delivering it a smooth process. And with Slidegeeks, you can trust that your presentation will be unique and memorable. So why wait Grab KPI Dashboard To Analyze Performance Of Healthcare Financial Department Summary PDF today and make your presentation stand out from the rest.
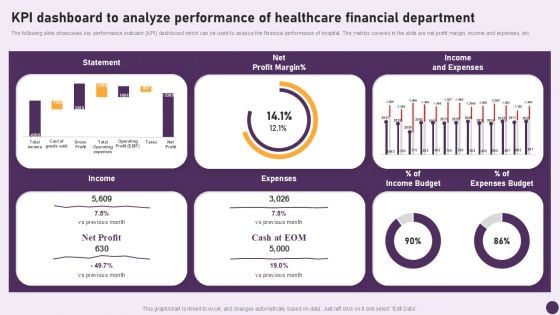
Guide To Healthcare Services Administration KPI Dashboard To Analyze Performance Healthcare Financial Demonstration PDF
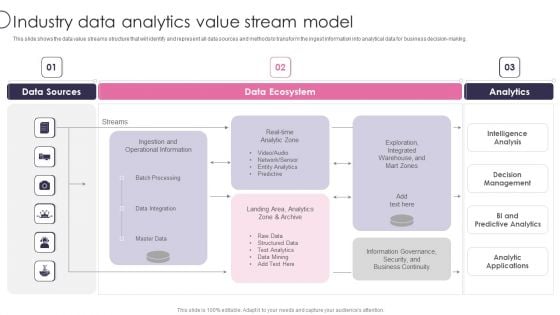
Information Transformation Process Toolkit Industry Data Analytics Value Stream Model Warehouse Template PDF
This slide shows the data value streams structure that will identify and represent all data sources and methods to transform the ingest information into analytical data for business decision making. Deliver an awe inspiring pitch with this creative Information Transformation Process Toolkit Industry Data Analytics Value Stream Model Warehouse Template PDF bundle. Topics like Data Sources, Data Ecosystem, Analytics can be discussed with this completely editable template. It is available for immediate download depending on the needs and requirements of the user.
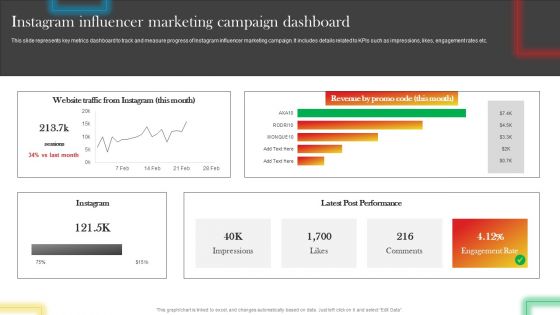
Instagram Influencer Marketing Campaign Dashboard Background PDF
This slide represents key metrics dashboard to track and measure progress of Instagram influencer marketing campaign. It includes details related to KPIs such as impressions, likes, engagement rates etc. Whether you have daily or monthly meetings, a brilliant presentation is necessary. Instagram Influencer Marketing Campaign Dashboard Background PDF can be your best option for delivering a presentation. Represent everything in detail using Instagram Influencer Marketing Campaign Dashboard Background PDF and make yourself stand out in meetings. The template is versatile and follows a structure that will cater to your requirements. All the templates prepared by Slidegeeks are easy to download and edit. Our research experts have taken care of the corporate themes as well. So, give it a try and see the results.
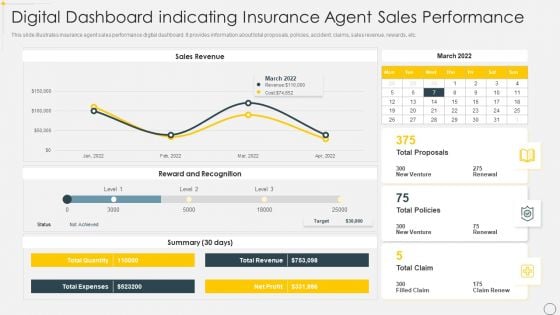
Digital Dashboard Indicating Insurance Agent Sales Performance Portrait PDF
This slide illustrates insurance agent sales performance digital dashboard. It provides information about total proposals, policies, accident, claims, sales revenue, rewards, etc. Pitch your topic with ease and precision using this Digital Dashboard Indicating Insurance Agent Sales Performance Portrait PDF. This layout presents information on Sales Revenue, Reward And Recognition. It is also available for immediate download and adjustment. So, changes can be made in the color, design, graphics or any other component to create a unique layout.
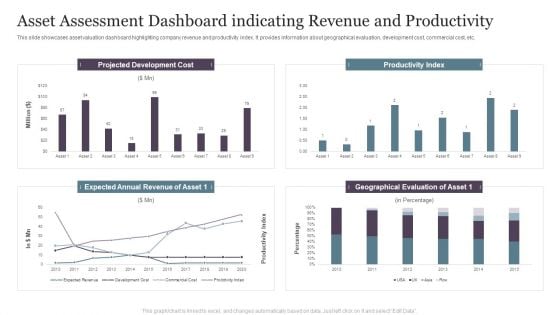
Asset Assessment Dashboard Indicating Revenue And Productivity Infographics PDF
This slide showcases asset valuation dashboard highlighting company revenue and productivity index. It provides information about geographical evaluation, development cost, commercial cost, etc.Pitch your topic with ease and precision using this Asset Assessment Dashboard Indicating Revenue And Productivity Infographics PDF. This layout presents information on Projected Development, Productivity Index, Geographical Evaluation. It is also available for immediate download and adjustment. So, changes can be made in the color, design, graphics or any other component to create a unique layout.
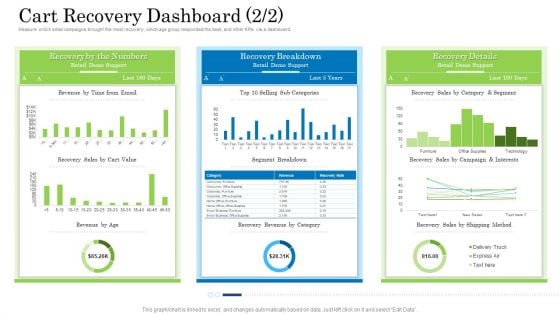
Customer Behavioral Data And Analytics Cart Recovery Dashboard Value Inspiration PDF
Measure which email campaigns brought the most recovery, which age group responded the best, and other KPIs via a dashboard. Deliver and pitch your topic in the best possible manner with this customer behavioral data and analytics cart recovery dashboard value inspiration pdf. Use them to share invaluable insights on cart recovery dashboard and impress your audience. This template can be altered and modified as per your expectations. So, grab it now.
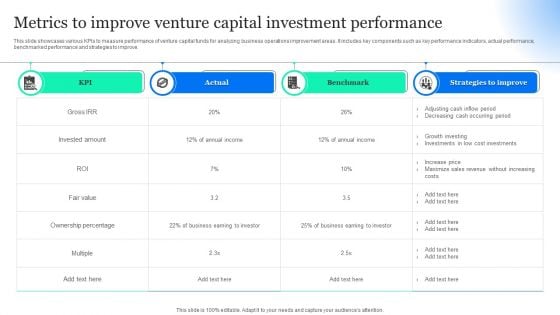
Metrics To Improve Venture Capital Investment Performance Information PDF
This slide showcases various KPIs to measure performance of venture capital funds for analyzing business operations improvement areas. It includes key components such as key performance indicators, actual performance, benchmarked performance and strategies to improve. Pitch your topic with ease and precision using this Metrics To Improve Venture Capital Investment Performance Information PDF. This layout presents information on Actual, Strategies Improve, Benchmark. It is also available for immediate download and adjustment. So, changes can be made in the color, design, graphics or any other component to create a unique layout.
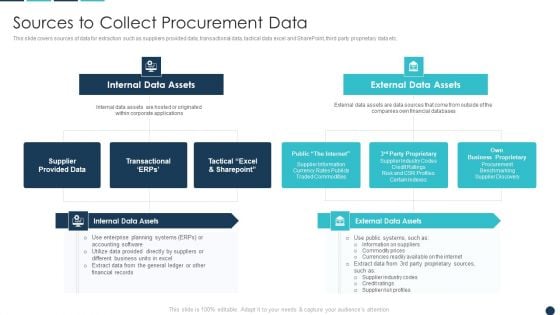
Procurement Analytics Tools And Strategies Sources To Collect Procurement Data Guidelines PDF
This slide covers sources of data for extraction such as suppliers provided data, transactional data, tactical data excel and SharePoint, third party proprietary data etc.Deliver and pitch your topic in the best possible manner with this Procurement Analytics Tools And Strategies Sources To Collect Procurement Data Guidelines PDF. Use them to share invaluable insights on Internal Data, External Data, Business Proprietary and impress your audience. This template can be altered and modified as per your expectations. So, grab it now.
Inbound Lead Performance Tracking Dashboard Improving Lead Generation Process Pictures PDF
This slide covers the KPI dashboard for evaluating inbound lead performance. It includes metrics such as lead to opportunity ratio, opportunity to win ratio, lead conversion ratio, inbound leads, and leads in the sales funnel. The Inbound Lead Performance Tracking Dashboard Improving Lead Generation Process Pictures PDF is a compilation of the most recent design trends as a series of slides. It is suitable for any subject or industry presentation, containing attractive visuals and photo spots for businesses to clearly express their messages. This template contains a variety of slides for the user to input data, such as structures to contrast two elements, bullet points, and slides for written information. Slidegeeks is prepared to create an impression.
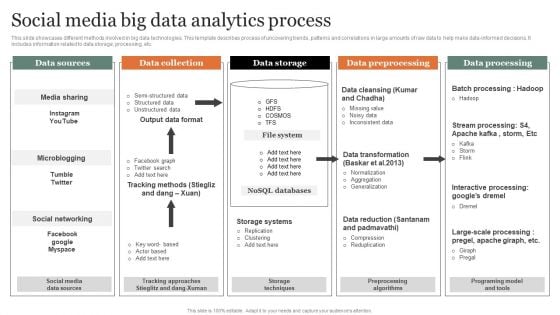
Social Media Big Data Analytics Process Diagrams PDF
This slide showcases different methods involved in big data technologies. This template describes process of uncovering trends, patterns and correlations in large amounts of raw data to help make data informed decisions. It includes information related to data storage, processing, etc. Showcasing this set of slides titled Social Media Big Data Analytics Process Diagrams PDF Microsoft. The topics addressed in these templates are Data Collection, Data Storage, Data Preprocessing. All the content presented in this PPT design is completely editable. Download it and make adjustments in color, background, font etc. as per your unique business setting.
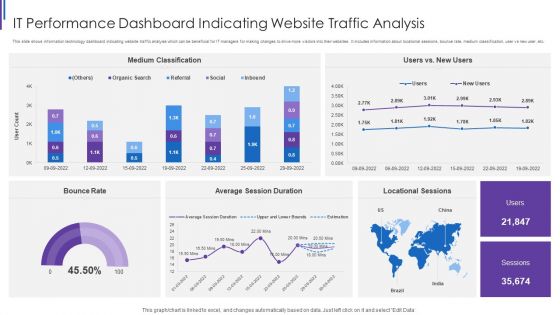
IT Performance Dashboard Indicating Website Traffic Analysis Background PDF
This slide shows information technology dashboard indicating website traffic analysis which can be beneficial for IT managers for making changes to drive more visitors into their websites. It includes information about locational sessions, bounce rate, medium classification, user vs new user, etc. Pitch your topic with ease and precision using this IT Performance Dashboard Indicating Website Traffic Analysis Background PDF. This layout presents information on Medium Classification Rate, Average Session Duration, Locational Sessions Bounce. It is also available for immediate download and adjustment. So, changes can be made in the color, design, graphics or any other component to create a unique layout.
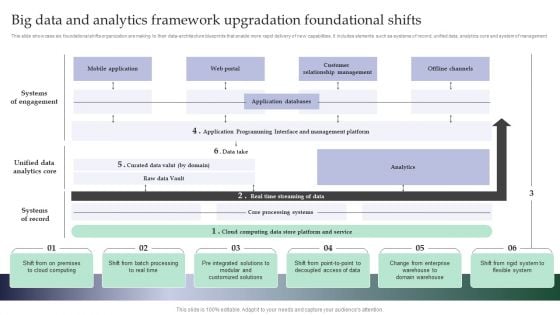
Big Data And Analytics Framework Upgradation Foundational Shifts Background PDF
This slide showcase six foundational shifts organization are making to their data-architecture blueprints that enable more rapid delivery of new capabilities. It includes elements such as systems of record, unified data, analytics core and system of management Showcasing this set of slides titled Big Data And Analytics Framework Upgradation Foundational Shifts Background PDF. The topics addressed in these templates are Mobile Application, Web Portal, Relationship. All the content presented in this PPT design is completely editable. Download it and make adjustments in color, background, font etc. as per your unique business setting.


 Continue with Email

 Home
Home


