Business Snapshot
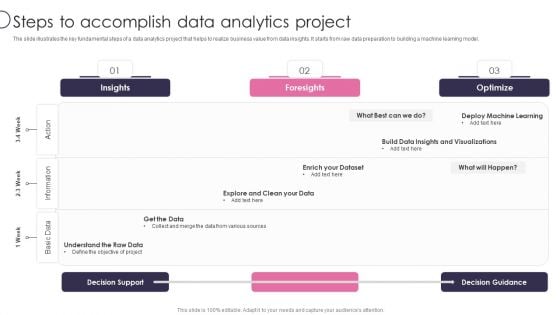
Information Transformation Process Toolkit Steps To Accomplish Data Analytics Project Introduction PDF
The slide illustrates the key fundamental steps of a data analytics project that helps to realize business value from data insights. It starts from raw data preparation to building a machine learning model. Deliver an awe inspiring pitch with this creative Information Transformation Process Toolkit Steps To Accomplish Data Analytics Project Introduction PDF bundle. Topics like Optimize, Foresights, Decision Guidance can be discussed with this completely editable template. It is available for immediate download depending on the needs and requirements of the user.
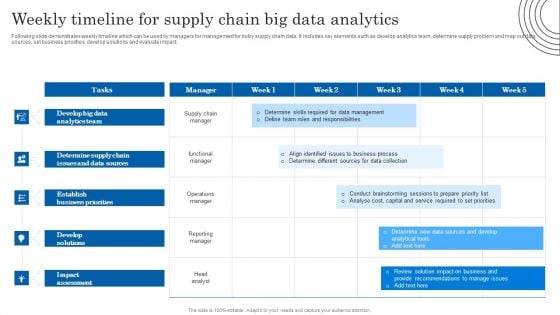
Weekly Timeline For Supply Chain Big Data Analytics Introduction PDF
Following slide demonstrates weekly timeline which can be used by managers for management for bulky supply chain data. It includes key elements such as develop analytics team, determine supply problem and map out data sources, set business priorities, develop solutions and evaluate impact. Pitch your topic with ease and precision using this Weekly Timeline For Supply Chain Big Data Analytics Introduction PDF. This layout presents information on Determine Supply Chain, Data Sources, Analytics Team. It is also available for immediate download and adjustment. So, changes can be made in the color, design, graphics or any other component to create a unique layout.
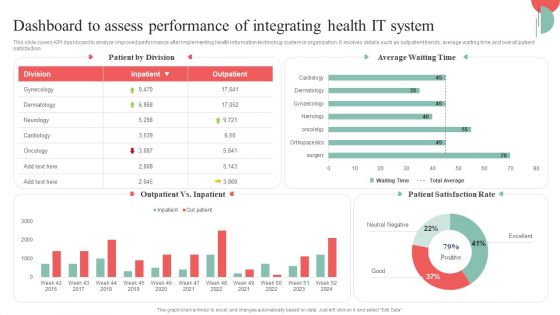
Incorporating HIS To Enhance Healthcare Services Dashboard To Assess Performance Of Integrating Health IT System Diagrams PDF
This slide covers KPI dashboard to analyze improved performance after implementing health information technology system in organization. It involves details such as outpatient trends, average waiting time and overall patient satisfaction. Create an editable Incorporating HIS To Enhance Healthcare Services Dashboard To Assess Performance Of Integrating Health IT System Diagrams PDF that communicates your idea and engages your audience. Whether youre presenting a business or an educational presentation, pre designed presentation templates help save time. Incorporating HIS To Enhance Healthcare Services Dashboard To Assess Performance Of Integrating Health IT System Diagrams PDF is highly customizable and very easy to edit, covering many different styles from creative to business presentations. Slidegeeks has creative team members who have crafted amazing templates. So, go and get them without any delay.
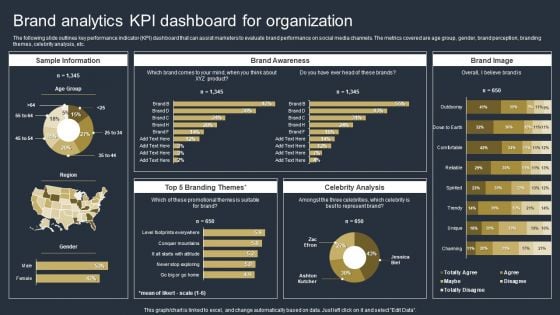
Comprehensive Market Research Guide Brand Analytics Kpi Dashboard For Organization Brochure PDF
The following slide outlines key performance indicator KPI dashboard that can assist marketers to evaluate brand performance on social media channels. The metrics covered are age group, gender, brand perception, branding themes, celebrity analysis, etc. From laying roadmaps to briefing everything in detail, our templates are perfect for you. You can set the stage with your presentation slides. All you have to do is download these easy-to-edit and customizable templates. Comprehensive Market Research Guide Brand Analytics Kpi Dashboard For Organization Brochure PDF will help you deliver an outstanding performance that everyone would remember and praise you for. Do download this presentation today.
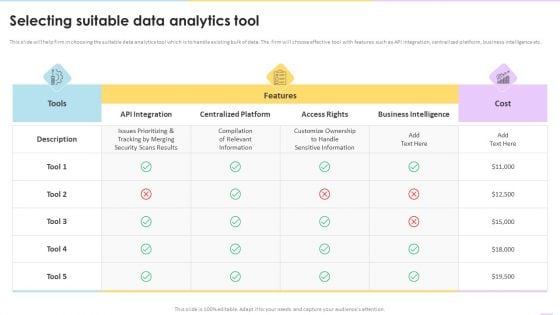
Data Valuation And Monetization Selecting Suitable Data Analytics Tool Download PDF
This slide will help firm in choosing the suitable data analytics tool which is to handle existing bulk of data. The firm will choose effective tool with features such as API integration, centralized platform, business intelligence etc. Deliver an awe inspiring pitch with this creative Data Valuation And Monetization Selecting Suitable Data Analytics Tool Download PDF bundle. Topics like Centralized Platform, Access Rights, Business Intelligence can be discussed with this completely editable template. It is available for immediate download depending on the needs and requirements of the user.
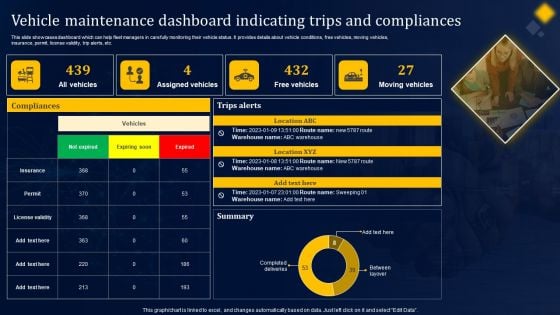
Vehicle Maintenance Dashboard Indicating Trips And Compliances Structure PDF
This slide showcases dashboard which can help fleet managers in carefully monitoring their vehicle status. It provides details about vehicle conditions, free vehicles, moving vehicles, insurance, permit, license validity, trip alerts, etc. Here you can discover an assortment of the finest PowerPoint and Google Slides templates. With these templates, you can create presentations for a variety of purposes while simultaneously providing your audience with an eye-catching visual experience. Download Vehicle Maintenance Dashboard Indicating Trips And Compliances Structure PDF to deliver an impeccable presentation. These templates will make your job of preparing presentations much quicker, yet still, maintain a high level of quality. Slidegeeks has experienced researchers who prepare these templates and write high-quality content for you. Later on, you can personalize the content by editing the Vehicle Maintenance Dashboard Indicating Trips And Compliances Structure PDF.
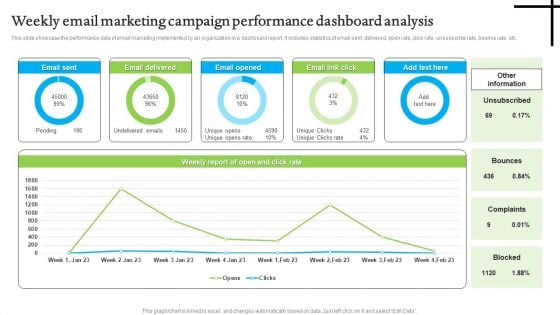
Weekly Email Marketing Campaign Performance Dashboard Analysis Structure PDF
This slide showcase the performance data of email marketing implemented by an organization in a dashboard report. It includes statistics of email sent, delivered, open rate, click rate, unsubscribe rate, bounce rate, etc. Pitch your topic with ease and precision using this Weekly Email Marketing Campaign Performance Dashboard Analysis Structure PDF. This layout presents information on Weekly Email Marketing, Campaign Performance Dashboard Analysis. It is also available for immediate download and adjustment. So, changes can be made in the color, design, graphics or any other component to create a unique layout.
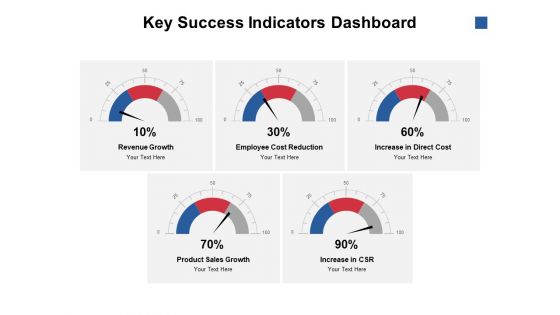
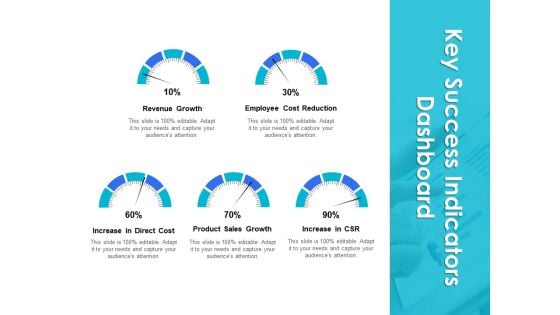
Key Success Indicators Dashboard Ppt PowerPoint Presentation Show Styles
Presenting this set of slides with name key success indicators dashboard ppt powerpoint presentation show styles. The topics discussed in these slides are revenue growth, employee cost reduction, increase in direct cost, product sales growth, increase in csr. This is a completely editable PowerPoint presentation and is available for immediate download. Download now and impress your audience.
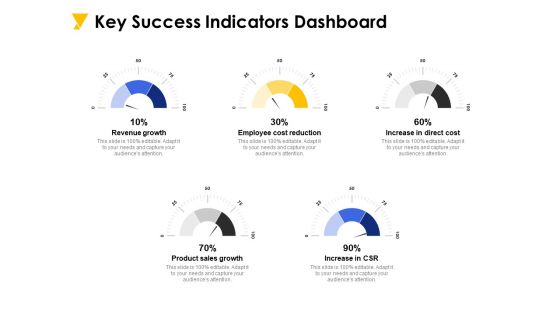
Key Success Indicators Dashboard Ppt PowerPoint Presentation Infographics Slide Portrait
Presenting this set of slides with name key success indicators dashboard ppt powerpoint presentation infographics slide portrait. The topics discussed in these slides are revenue growth, employee cost reduction, increase in direct cost, product sales growth, increase in csr. This is a completely editable PowerPoint presentation and is available for immediate download. Download now and impress your audience.
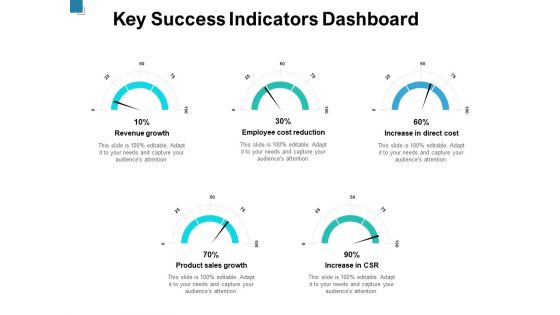
Key Success Indicators Dashboard Ppt PowerPoint Presentation Infographic Template Portfolio
Presenting this set of slides with name key success indicators dashboard ppt powerpoint presentation infographic template portfolio. The topics discussed in these slides are revenue growth, employee cost reduction, increase in direct cost, product sales growth, increase csr. This is a completely editable PowerPoint presentation and is available for immediate download. Download now and impress your audience.
Key Success Indicators Dashboard Ppt PowerPoint Presentation File Backgrounds
Presenting this set of slides with name key success indicators dashboard ppt powerpoint presentation file backgrounds. The topics discussed in these slides are revenue growth, employee cost reduction, increase in direct cost, product sales growth, increase csr. This is a completely editable PowerPoint presentation and is available for immediate download. Download now and impress your audience.

Online Payment Process Dashboard Ppt PowerPoint Presentation Complete Deck
Improve your presentation delivery using this online payment process dashboard ppt powerpoint presentation complete deck. Support your business vision and objectives using this well-structured PPT deck. This template offers a great starting point for delivering beautifully designed presentations on the topic of your choice. Comprising twelve slides this professionally designed template is all you need to host discussion and meetings with collaborators. Each slide is self-explanatory and equipped with high-quality graphics that can be adjusted to your needs. Therefore, you will face no difficulty in portraying your desired content using this PPT slideshow. This PowerPoint slideshow contains every important element that you need for a great pitch. It is not only editable but also available for immediate download and utilization. The color, font size, background, shapes everything can be modified to create your unique presentation layout. Therefore, download it now.
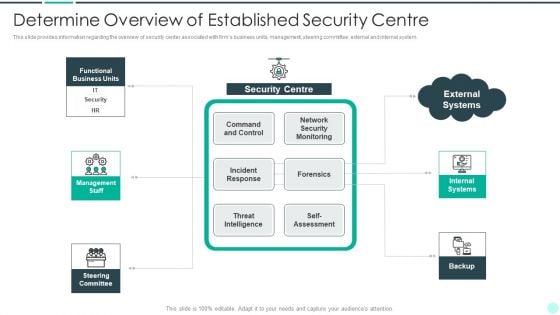
Executing Advance Data Analytics At Workspace Determine Overview Of Established Topics PDF
This slide provides information regarding the overview of security center associated with firms business units, management, steering committee, external and internal system. Deliver an awe inspiring pitch with this creative executing advance data analytics at workspace determine overview of established topics pdf bundle. Topics like determine overview of established security centre can be discussed with this completely editable template. It is available for immediate download depending on the needs and requirements of the user.
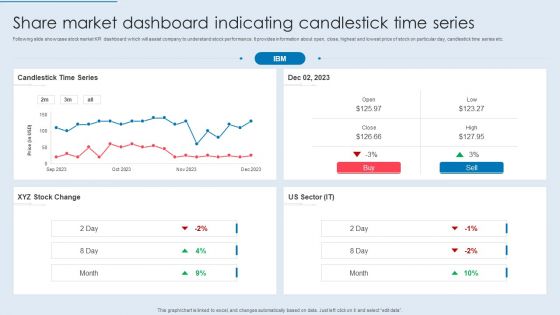
Share Market Dashboard Indicating Candlestick Time Series Formats PDF
Following slide showcase stock market KPI dashboard which will assist company to understand stock performance. It provides information about open, close, highest and lowest price of stock on particular day, candlestick time series etc. Pitch your topic with ease and precision using this Share Market Dashboard Indicating Candlestick Time Series Formats PDF. This layout presents information on Candlestick Time Series, Stock Change, US Sector. It is also available for immediate download and adjustment. So, changes can be made in the color, design, graphics or any other component to create a unique layout.
Ad Campaign Performance Indicators Tracking Dashboard Diagrams PDF
This slide covers dashboard to measure the performance of ad campaigns on LinkedIn platform. The purpose of this template is to provide the company an overview on the outcomes of running ad campaigns on LinkedIn. It includes performance based on impressions, CTR, engagement rates, CPC, CPM, etc. Find a pre designed and impeccable Ad Campaign Performance Indicators Tracking Dashboard Diagrams PDF. The templates can ace your presentation without additional effort. You can download these easy to edit presentation templates to make your presentation stand out from others. So, what are you waiting for Download the template from Slidegeeks today and give a unique touch to your presentation.
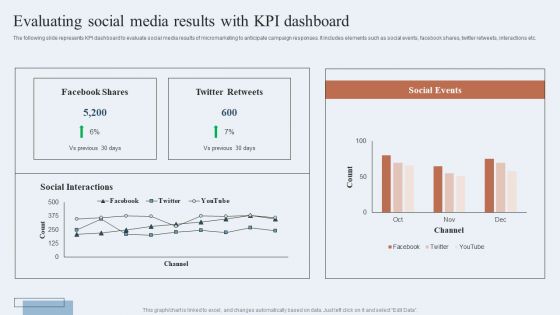
Niche Marketing Guide To Target Specific Customer Groups Evaluating Social Media Results With Kpi Dashboard Inspiration PDF
The following slide represents KPI dashboard to evaluate social media results of micromarketing to anticipate campaign responses. It includes elements such as social events, facebook shares, twitter retweets, interactions etc. Are you searching for a Niche Marketing Guide To Target Specific Customer Groups Evaluating Social Media Results With Kpi Dashboard Inspiration PDF that is uncluttered, straightforward, and original Its easy to edit, and you can change the colors to suit your personal or business branding. For a presentation that expresses how much effort you have put in, this template is ideal. With all of its features, including tables, diagrams, statistics, and lists, its perfect for a business plan presentation. Make your ideas more appealing with these professional slides. Download Niche Marketing Guide To Target Specific Customer Groups Evaluating Social Media Results With Kpi Dashboard Inspiration PDF from Slidegeeks today.
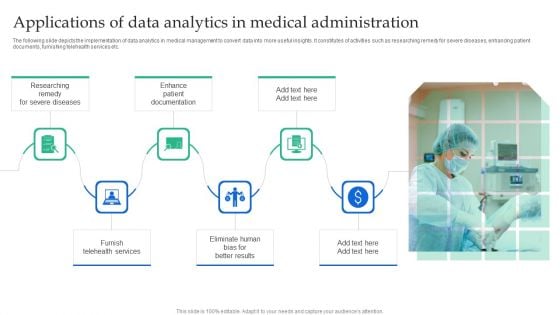
Applications Of Data Analytics In Medical Administration Diagrams PDF
The following slide depicts the implementation of data analytics in medical management to convert data into more useful insights. It constitutes of activities such as researching remedy for severe diseases, enhancing patient documents, furnishing telehealth services etc.Showcasing this set of slides titled Applications Of Data Analytics In Medical Administration Diagrams PDF. The topics addressed in these templates are Severe Diseases, Furnish Telehealth, Patient Documentation. All the content presented in this PPT design is completely editable. Download it and make adjustments in color, background, font etc. as per your unique business setting.
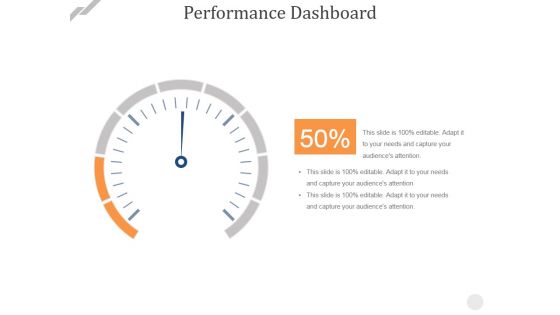
Performance Dashboard Template 2 Ppt PowerPoint Presentation Picture
This is a performance dashboard template 2 ppt powerpoint presentation picture. This is a one stage process. The stages in this dashboard, planning, management, strategy, marketing, business.
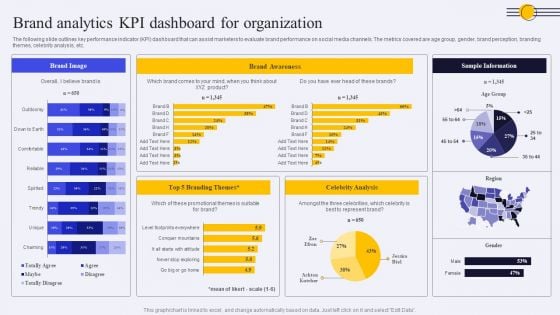
Brand Analytics KPI Dashboard For Organization Ppt PowerPoint Presentation Diagram PDF
The following slide outlines key performance indicator KPI dashboard that can assist marketers to evaluate brand performance on social media channels. The metrics covered are age group, gender, brand perception, branding themes, celebrity analysis, etc. Take your projects to the next level with our ultimate collection of Brand Analytics KPI Dashboard For Organization Ppt PowerPoint Presentation Diagram PDF. Slidegeeks has designed a range of layouts that are perfect for representing task or activity duration, keeping track of all your deadlines at a glance. Tailor these designs to your exact needs and give them a truly corporate look with your own brand colors they will make your projects stand out from the rest.
Pareto Analysis Shipping Tracking Metrics Dashboard Guidelines PDF
This slide showcases dashboard for analyzing on-time delivery trends. It also includes KPIs such as Pareto analysis and on-time deliveries by shipping organizations. Pitch your topic with ease and precision using this Pareto Analysis Shipping Tracking Metrics Dashboard Guidelines PDF. This layout presents information on Pareto Analysis, Deliveries Trends, Shipping Organization. It is also available for immediate download and adjustment. So, changes can be made in the color, design, graphics or any other component to create a unique layout.
Key Metrics To Increase Consumer Traffic Icon Themes PDF
Showcasing this set of slides titled Key Metrics To Increase Consumer Traffic Icon Themes PDF. The topics addressed in these templates are Key Metrics, Increase Consumer, Traffic . All the content presented in this PPT design is completely editable. Download it and make adjustments in color, background, font etc. as per your unique business setting.
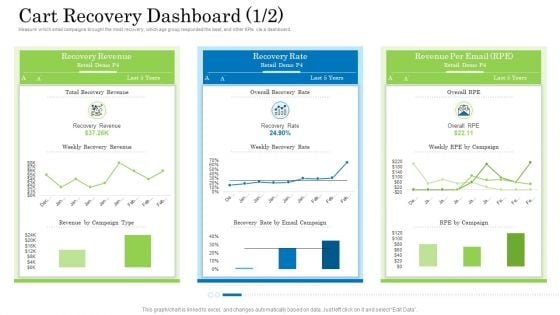
Customer Behavioral Data And Analytics Cart Recovery Dashboard Revenue Background PDF
Measure which email campaigns brought the most recovery, which age group responded the best, and other KPIs via a dashboard. Deliver an awe inspiring pitch with this creative customer behavioral data and analytics cart recovery dashboard revenue background pdf bundle. Topics like recovery revenue, recovery rate, revenue per email can be discussed with this completely editable template. It is available for immediate download depending on the needs and requirements of the user.
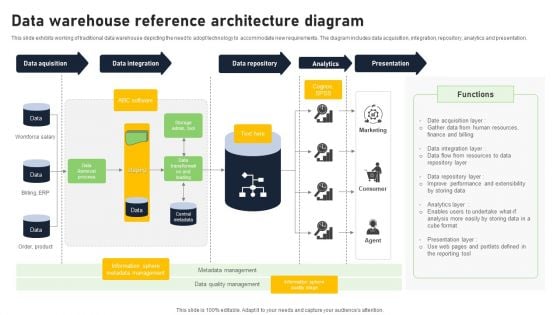
Data Warehouse Reference Architecture Diagram Summary PDF
This slide exhibits working of traditional data warehouse depicting the need to adopt technology to accommodate new requirements. The diagram includes data acquisition, integration, repository, analytics and presentation. Showcasing this set of slides titled Data Warehouse Reference Architecture Diagram Summary PDF. The topics addressed in these templates are Data Acquisition, Data Integration, Data Repository. All the content presented in this PPT design is completely editable. Download it and make adjustments in color, background, font etc. as per your unique business setting.

KPI Dashboard To Track Sales And Operations Process Of Manufacturing Enterprise Brochure PDF
This slide depicts a dashboard to track the key performance metrics in sales and operations process of a manufacturing enterprise to analyze deviations in the actual and planned output. The key performing indicators are percentage deviation, dollar deviation, inventory in hand etc.Pitch your topic with ease and precision using this KPI Dashboard To Track Sales And Operations Process Of Manufacturing Enterprise Brochure PDF. This layout presents information on Planned Output, Yearly Growth, Inventory Hand. It is also available for immediate download and adjustment. So, changes can be made in the color, design, graphics or any other component to create a unique layout.
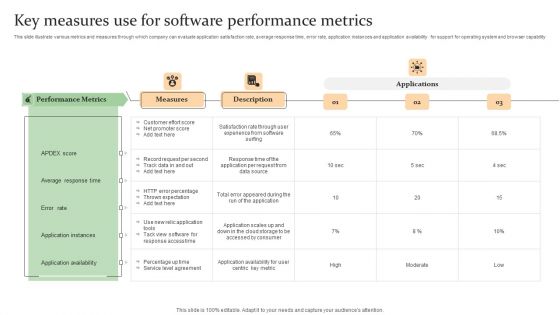
Key Measures Use For Software Performance Metrics Sample PDF
Showcasing this set of slides titled Key Measures Use For Software Performance Metrics Sample PDF. The topics addressed in these templates are Performance Metrics, Measures, Applications. All the content presented in this PPT design is completely editable. Download it and make adjustments in color, background, font etc. as per your unique business setting.
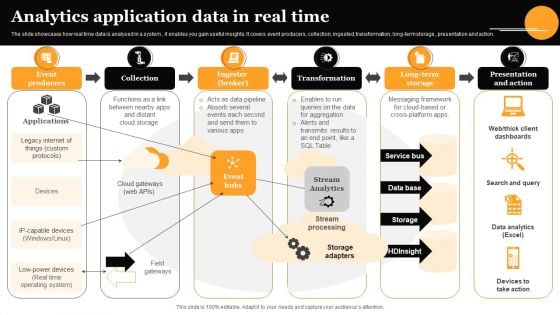
Analytics Application Data In Real Time Elements PDF
The slide showcases how real time data is analysed in a system, it enables you gain useful insights. It covers event producers, collection, ingested, transformation, long-term storage , presentation and action. Showcasing this set of slides titled Analytics Application Data In Real Time Elements PDF. The topics addressed in these templates are Event Producers, Collection, Transformation . All the content presented in this PPT design is completely editable. Download it and make adjustments in color, background, font etc. as per your unique business setting.
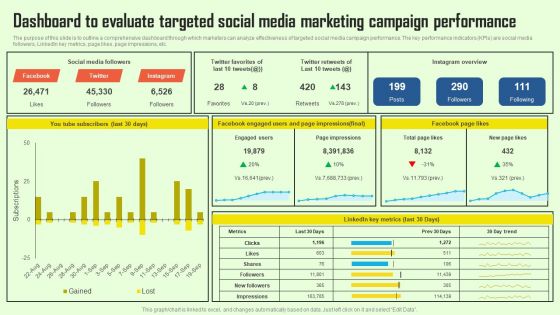
Increasing Consumer Engagement With Database Dashboard To Evaluate Targeted Social Media Portrait PDF
The purpose of this slide is to outline a comprehensive dashboard through which marketers can analyze effectiveness of targeted social media campaign performance. The key performance indicators KPIs are social media followers, LinkedIn key metrics, page likes, page impressions, etc. If you are looking for a format to display your unique thoughts, then the professionally designed Increasing Consumer Engagement With Database Dashboard To Evaluate Targeted Social Media Portrait PDF is the one for you. You can use it as a Google Slides template or a PowerPoint template. Incorporate impressive visuals, symbols, images, and other charts. Modify or reorganize the text boxes as you desire. Experiment with shade schemes and font pairings. Alter, share or cooperate with other people on your work. Download Increasing Consumer Engagement With Database Dashboard To Evaluate Targeted Social Media Portrait PDF and find out how to give a successful presentation. Present a perfect display to your team and make your presentation unforgettable.
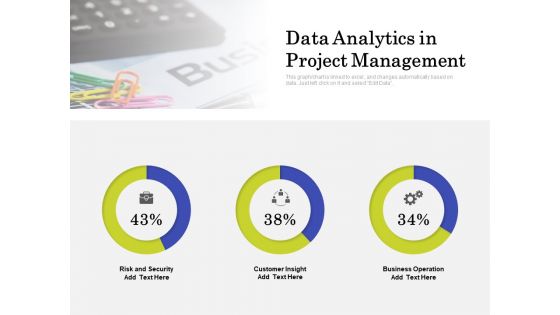
data analytics in project management ppt powerpoint presentation pictures guidelines pdf
Presenting this set of slides with name data analytics in project management ppt powerpoint presentation pictures guidelines pdf. The topics discussed in these slides are risk and security, customer insight, business operation. This is a completely editable PowerPoint presentation and is available for immediate download. Download now and impress your audience.
Marketing Mix Diagram For Data Analytics For Accounts Receivable Ppt Icon Pictures PDF
Showcasing this set of slides titled marketing mix diagram for data analytics for accounts receivable ppt icon pictures pdf. The topics addressed in these templates are product, place, price, promotion. All the content presented in this PPT design is completely editable. Download it and make adjustments in color, background, font etc. as per your unique business setting.
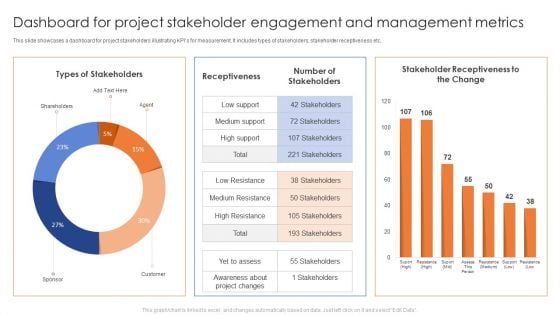
Dashboard For Project Stakeholder Engagement And Management Metrics Brochure PDF
This slide showcases a dashboard for project stakeholders illustrating KPIs for measurement. It includes types of stakeholders, stakeholder receptiveness etc. Pitch your topic with ease and precision using this Dashboard For Project Stakeholder Engagement And Management Metrics Brochure PDF. This layout presents information on Types Of Stakeholders, Receptiveness, Number Of Stakeholders. It is also available for immediate download and adjustment. So, changes can be made in the color, design, graphics or any other component to create a unique layout.
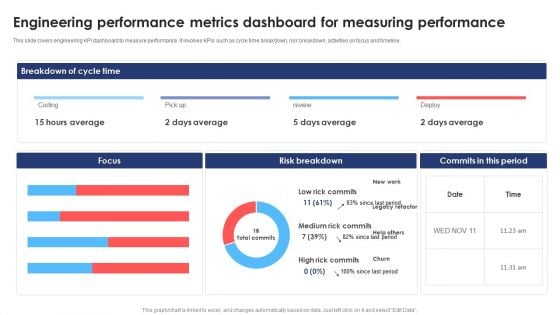
Engineering Performance Metrics Dashboard For Measuring Performance Download PDF
This slide covers engineering KPI dashboard to measure performance. It involves KPIs such as cycle time breakdown, risk breakdown, activities on focus and timeline. Pitch your topic with ease and precision using this Engineering Performance Metrics Dashboard For Measuring Performance Download PDF. This layout presents information on Average, Risk Breakdown, Measuring Performance. It is also available for immediate download and adjustment. So, changes can be made in the color, design, graphics or any other component to create a unique layout.
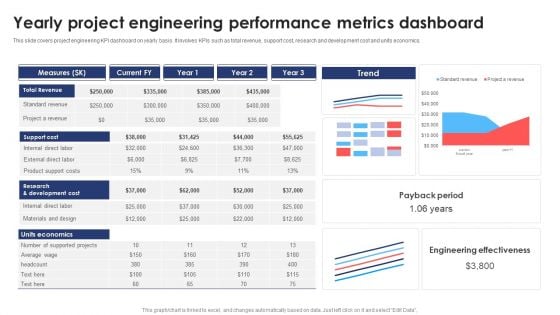
Yearly Project Engineering Performance Metrics Dashboard Information PDF
This slide covers project engineering KPI dashboard on yearly basis. It involves KPIs such as total revenue, support cost, research and development cost and units economics. Pitch your topic with ease and precision using this Yearly Project Engineering Performance Metrics Dashboard Information PDF. This layout presents information on Support Cost, Revenue, Measures. It is also available for immediate download and adjustment. So, changes can be made in the color, design, graphics or any other component to create a unique layout.
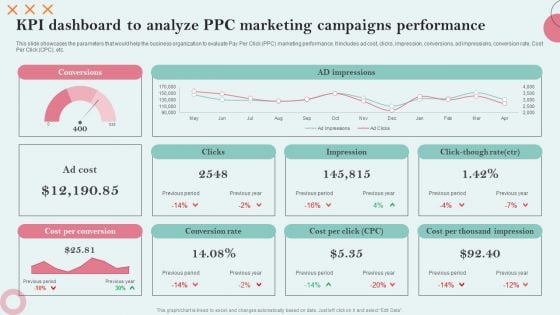
KPI Dashboard To Analyze PPC Marketing Campaigns Performance Information PDF
This slide showcases the parameters that would help the business organization to evaluate Pay Per Click PPC marketing performance. It includes ad cost, clicks, impression, conversions, ad impressions, conversion rate, Cost Per Click CPC, etc. Presenting this PowerPoint presentation, titled KPI Dashboard To Analyze PPC Marketing Campaigns Performance Information PDF, with topics curated by our researchers after extensive research. This editable presentation is available for immediate download and provides attractive features when used. Download now and captivate your audience. Presenting this KPI Dashboard To Analyze PPC Marketing Campaigns Performance Information PDF. Our researchers have carefully researched and created these slides with all aspects taken into consideration. This is a completely customizable KPI Dashboard To Analyze PPC Marketing Campaigns Performance Information PDF that is available for immediate downloading. Download now and make an impact on your audience. Highlight the attractive features available with our PPTs.
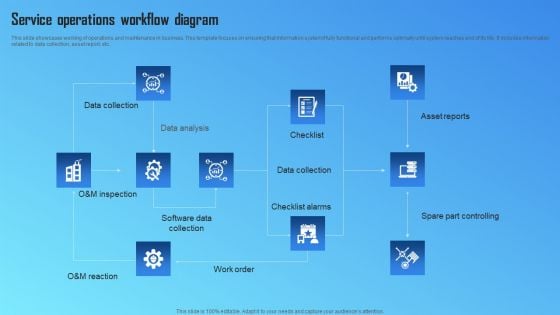
Service Operations Workflow Diagram Designs PDF
This slide showcases working of operations and maintenance in business. This template focuses on ensuring that information system if fully functional and performs optimally until system reaches end of its life. It includes information related to data collection, asset report, etc. Showcasing this set of slides titled Service Operations Workflow Diagram Designs PDF. The topics addressed in these templates are Data Collection, Data Analysis, Software Data Collection. All the content presented in this PPT design is completely editable. Download it and make adjustments in color, background, font etc. as per your unique business setting.
Customer Support Services Track Kpis To Evaluate Team Performance Icons PDF
The following slide depicts key metrics to evaluate support team performance. Major KPIs covered are customer satisfaction score, first contact resolution, employee engagement and negative response rate. Create an editable Customer Support Services Track Kpis To Evaluate Team Performance Icons PDF that communicates your idea and engages your audience. Whether youre presenting a business or an educational presentation, pre-designed presentation templates help save time. Customer Support Services Track Kpis To Evaluate Team Performance Icons PDF is highly customizable and very easy to edit, covering many different styles from creative to business presentations. Slidegeeks has creative team members who have crafted amazing templates. So, go and get them without any delay.

Health And Risk KPI Dashboard Ppt Pictures Designs Download PDF
The slide highlights the health and safety key performance indicator dashboard illustrating key headings which includes key objectives, inspections, total reports vs over due reports, injuries by body part and accident trends. Pitch your topic with ease and precision using this Health And Risk KPI Dashboard Ppt Pictures Designs Download PDF. This layout presents information on Key Objectives, Inspections, Accidents Trends. It is also available for immediate download and adjustment. So, changes can be made in the color, design, graphics or any other component to create a unique layout.
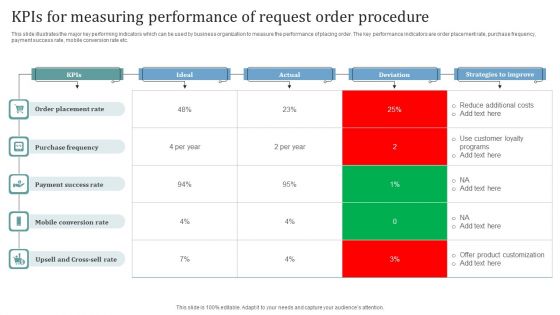
Kpis For Measuring Performance Of Request Order Procedure Slides PDF
This slide illustrates the major key performing indicators which can be used by business organization to measure the performance of placing order. The key performance indicators are order placement rate, purchase frequency, payment success rate, mobile conversion rate etc. Pitch your topic with ease and precision using this Kpis For Measuring Performance Of Request Order Procedure Slides PDF. This layout presents information on Kpis, Ideal, Actual. It is also available for immediate download and adjustment. So, changes can be made in the color, design, graphics or any other component to create a unique layout.
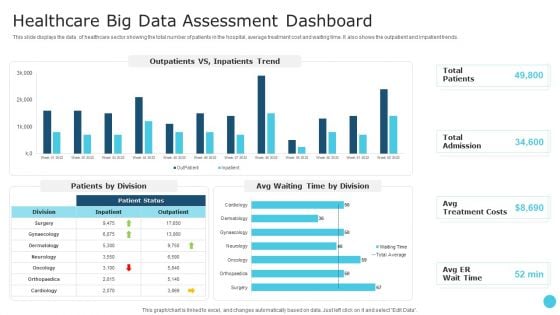
Healthcare Big Data Assessment Dashboard Portrait PDF
This slide displays the data of healthcare sector showing the total number of patients in the hospital, average treatment cost and waiting time. It also shows the outpatient and impatient trends. Pitch your topic with ease and precision using this Healthcare Big Data Assessment Dashboard Portrait PDF. This layout presents information on Patient Status, Treatment Costs. It is also available for immediate download and adjustment. So, changes can be made in the color, design, graphics or any other component to create a unique layout.

5 R2R Key Performance Indicators Ppt PowerPoint Presentation Model Topics PDF
Following slide outlines critical R2R KPIs. Time to close, number of entry corrections, voice of transactions per FTE, growth of CA and process costs are some of the KPIs, which will assist accounts department to measure its overall performance.Showcasing this set of slides titled 5 R2R Key Performance Indicators Ppt PowerPoint Presentation Model Topics PDF. The topics addressed in these templates are Volume Transactions, Process Cost, Entry Corrections. All the content presented in this PPT design is completely editable. Download it and make adjustments in color, background, font etc. as per your unique business setting.
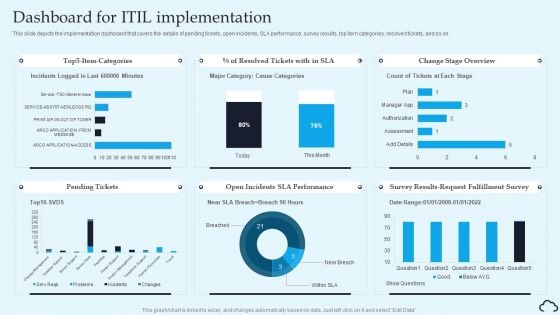
Dashboard For ITIL Implementation IT Service Management Framework Introduction PDF
This slide depicts the implementation dashboard that covers the details of pending tickets, open incidents, SLA performance, survey results, top item categories, resolved tickets, and so on.Retrieve professionally designed Dashboard For ITIL Implementation IT Service Management Framework Introduction PDF to effectively convey your message and captivate your listeners. Save time by selecting pre-made slideshows that are appropriate for various topics, from business to educational purposes. These themes come in many different styles, from creative to corporate, and all of them are easily adjustable and can be edited quickly. Access them as PowerPoint templates or as Google Slides themes. You do not have to go on a hunt for the perfect presentation because Slidegeeks got you covered from everywhere.
Telehealth Dashboard For Tele Biomarkers Tracking Sample PDF
This slide represents the dashboard for digital biomarkers tracking, and it covers details about coughing, talking, physical activity, respiration, cardiac activity, body orientation, and snoring, including the date and time of these activities. Retrieve professionally designed Telehealth Dashboard For Tele Biomarkers Tracking Sample PDF to effectively convey your message and captivate your listeners. Save time by selecting pre-made slideshows that are appropriate for various topics, from business to educational purposes. These themes come in many different styles, from creative to corporate, and all of them are easily adjustable and can be edited quickly. Access them as PowerPoint templates or as Google Slides themes. You do not have to go on a hunt for the perfect presentation because Slidegeeks got you covered from everywhere.
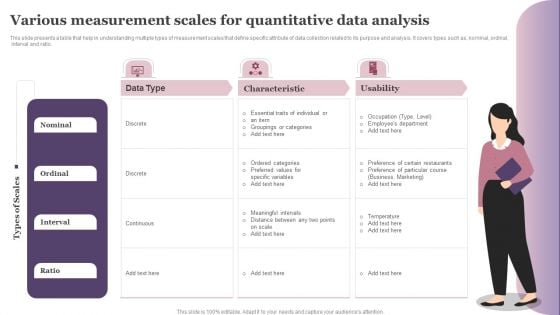
Various Measurement Scales For Quantitative Data Analysis Pictures PDF
Showcasing this set of slides titled Various Measurement Scales For Quantitative Data Analysis Pictures PDF. The topics addressed in these templates are Data Type, Characteristic, Usability. All the content presented in this PPT design is completely editable. Download it and make adjustments in color, background, font etc. as per your unique business setting.
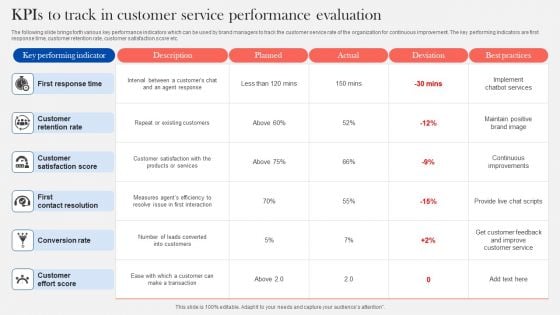
Kpis To Track In Customer Service Performance Evaluation Diagrams PDF
The following slide brings forth various key performance indicators which can be used by brand managers to track the customer service rate of the organization for continuous improvement. The key performing indicators are first response time, customer retention rate, customer satisfaction score etc. Showcasing this set of slides titled Kpis To Track In Customer Service Performance Evaluation Diagrams PDF. The topics addressed in these templates are First Response Time, Customer Retention Rate, Customer Satisfaction Score. All the content presented in this PPT design is completely editable. Download it and make adjustments in color, background, font etc. as per your unique business setting.
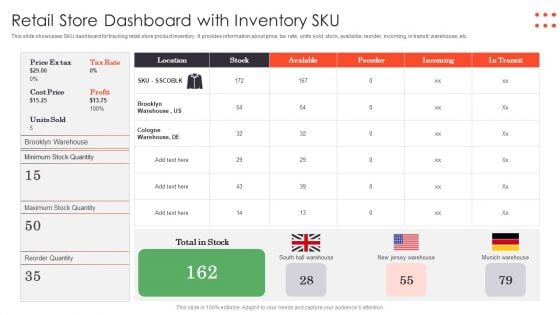
Retail Store Dashboard With Inventory SKU Ppt PowerPoint Presentation Gallery Graphics Template PDF
This slide showcases SKU dashboard for tracking retail store product inventory. It provides information about price, tax rate, units sold, stock, available, reorder, incoming, in transit, warehouse, etc. Showcasing this set of slides titled Retail Store Dashboard With Inventory SKU Ppt PowerPoint Presentation Gallery Graphics Template PDF. The topics addressed in these templates are South Hall Warehouse, New Jersey Warehouse, Munich Warehouse. All the content presented in this PPT design is completely editable. Download it and make adjustments in color, background, font etc. as per your unique business setting.
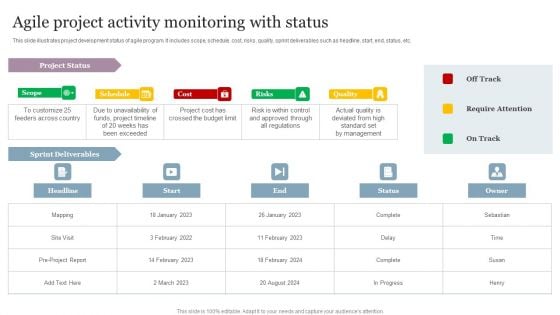
Agile Project Activity Monitoring With Status Information PDF
This slide illustrates project development status of agile program. It includes scope, schedule, cost, risks, quality, sprint deliverables such as headline, start, end, status, etc. Showcasing this set of slides titled Agile Project Activity Monitoring With Status Information PDF. The topics addressed in these templates are Agile Project, Activity Monitoring Status. All the content presented in this PPT design is completely editable. Download it and make adjustments in color, background, font etc. as per your unique business setting.
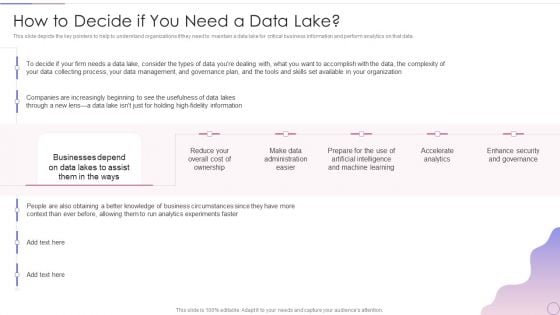
Data Lake Architecture Future Of Data Analysis How To Decide If You Need A Data Lake Designs PDF
This slide depicts the key pointers to help to understand organizations if they need to maintain a data lake for critical business information and perform analytics on that data.Deliver an awe inspiring pitch with this creative Data Lake Architecture Future Of Data Analysis How To Decide If You Need A Data Lake Designs PDF bundle. Topics like Businesses Depend, Fidelity Information, Artificial Intelligence can be discussed with this completely editable template. It is available for immediate download depending on the needs and requirements of the user.
Multi Cloud Complexity Management Cloud Performance Tracking Dashboard Clipart PDF
This slide covers the Key performance indicators for tracking performance of the cloud such as violations break down, sources, rules and severity. Deliver an awe inspiring pitch with this creative Multi Cloud Complexity Management Cloud Performance Tracking Dashboard Clipart PDF bundle. Topics like Violations Sources, Teams can be discussed with this completely editable template. It is available for immediate download depending on the needs and requirements of the user.
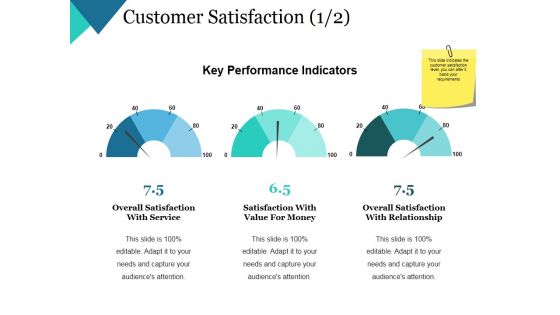
Customer Satisfaction Template 1 Ppt PowerPoint Presentation Pictures Gridlines
This is a customer satisfaction template 1 ppt powerpoint presentation pictures gridlines. This is a three stage process. The stages in this process are key performance indicators, business, management, strategy, dashboard.
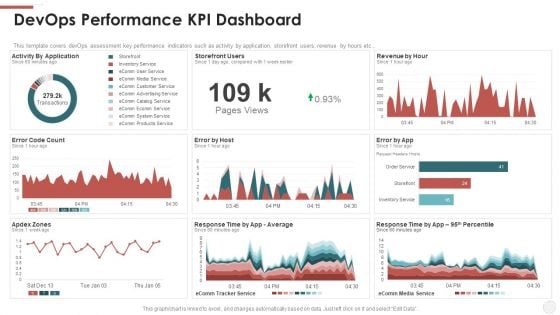
Devops Performance KPI Dashboard Ppt File Example Topics PDF
This template covers devOps assessment key performance indicators such as activity by application, storefront users, revenue by hours etc. Deliver and pitch your topic in the best possible manner with this devops performance kpi dashboard ppt file example topics pdf. Use them to share invaluable insights on revenue, application and impress your audience. This template can be altered and modified as per your expectations. So, grab it now.
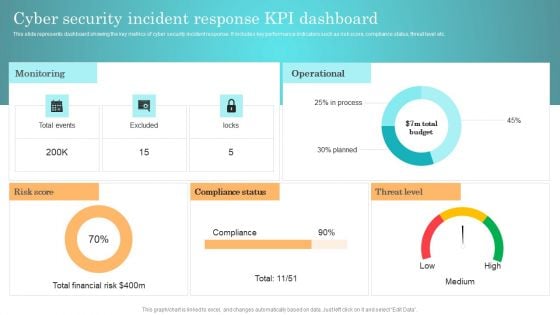
Incident Response Techniques Deployement Cyber Security Incident Response KPI Dashboard Background PDF
This slide represents dashboard showing the key metrics of cyber security incident response. It includes key performance indicators such as risk score, compliance status, threat level etc. From laying roadmaps to briefing everything in detail, our templates are perfect for you. You can set the stage with your presentation slides. All you have to do is download these easy to edit and customizable templates. Incident Response Techniques Deployement Cyber Security Incident Handler Contact Information Guidelines PDF will help you deliver an outstanding performance that everyone would remember and praise you for. Do download this presentation today.

Engineering Performance Metrics Dashboard To Track Pull Requests Background PDF
This slide covers engineering KPI dashboard to track pull request. It involves KPIs such as open time of average pull requests, average comment received, revision rounds, frequency of posting pull requests. Pitch your topic with ease and precision using this Engineering Performance Metrics Dashboard To Track Pull Requests Background PDF. This layout presents information on Dashboard Track Pull Requests, Engineering Performance Metrics. It is also available for immediate download and adjustment. So, changes can be made in the color, design, graphics or any other component to create a unique layout.
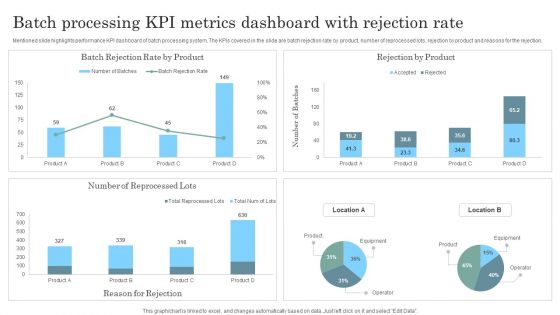
Batch Processing KPI Metrics Dashboard With Rejection Rate Topics PDF
Mentioned slide highlights performance KPI dashboard of batch processing system. The KPIs covered in the slide are batch rejection rate by product, number of reprocessed lots, rejection by product and reasons for the rejection. Pitch your topic with ease and precision using this Batch Processing KPI Metrics Dashboard With Rejection Rate Topics PDF. This layout presents information on Batch Processing KPI Metrics, Dashboard Rejection Rate. It is also available for immediate download and adjustment. So, changes can be made in the color, design, graphics or any other component to create a unique layout.
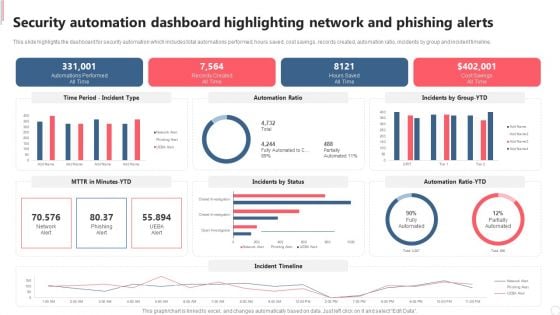
Security Automation Dashboard Highlighting Network And Phishing Alerts Demonstration PDF
This slide highlights the dashboard for security automation which includes total automations performed, hours saved, cost savings, records created, automation ratio, incidents by group and incident timeline. Welcome to our selection of the Security Automation Dashboard Highlighting Network And Phishing Alerts Demonstration PDF. These are designed to help you showcase your creativity and bring your sphere to life. Planning and Innovation are essential for any business that is just starting out. This collection contains the designs that you need for your everyday presentations. All of our PowerPoints are 100 percent editable, so you can customize them to suit your needs. This multi purpose template can be used in various situations. Grab these presentation templates today.
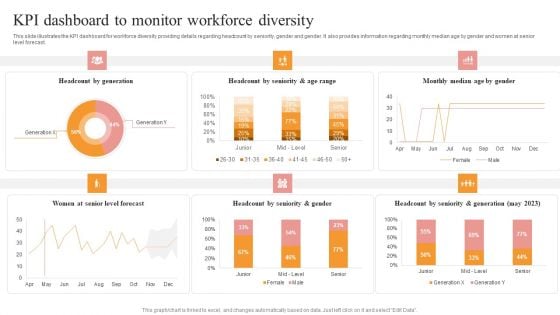
KPI Dashboard To Monitor Workforce Diversity Portrait PDF
This slide illustrates the KPI dashboard for workforce diversity providing details regarding headcount by seniority, gender and gender. It also provides information regarding monthly median age by gender and women at senior level forecast. Welcome to our selection of the KPI Dashboard To Monitor Workforce Diversity Portrait PDF. These are designed to help you showcase your creativity and bring your sphere to life. Planning and Innovation are essential for any business that is just starting out. This collection contains the designs that you need for your everyday presentations. All of our PowerPoints are 100 percent editable, so you can customize them to suit your needs. This multi purpose template can be used in various situations. Grab these presentation templates today.
Website Performance Tracking And Monitoring Dashboard Inspiration PDF
The following slide showcases a dashboard to track and measure website performance. It includes key elements such as visits, average session duration, bounce rate, page views, goal conversion, visits by week, traffic sources, top channels by conversions, etc. Welcome to our selection of the Website Performance Tracking And Monitoring Dashboard Inspiration PDF. These are designed to help you showcase your creativity and bring your sphere to life. Planning and Innovation are essential for any business that is just starting out. This collection contains the designs that you need for your everyday presentations. All of our PowerPoints are 100 percent editable, so you can customize them to suit your needs. This multi purpose template can be used in various situations. Grab these presentation templates today.
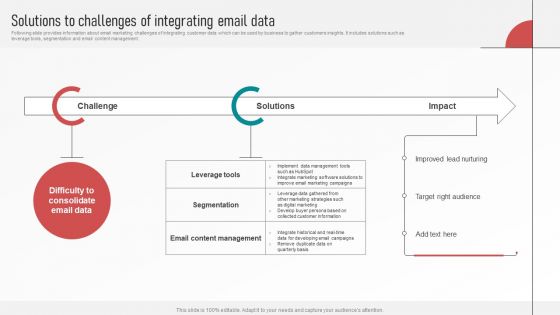
Customer Retention With Email Advertising Campaign Plan Solutions To Challenges Of Integrating Email Data Clipart PDF
Following slide provides information about email marketing challenges of integrating customer data which can be used by business to gather customers insights. It includes solutions such as leverage tools, segmentation and email content management. Are you searching for a Customer Retention With Email Advertising Campaign Plan Solutions To Challenges Of Integrating Email Data Clipart PDF that is uncluttered, straightforward, and original Its easy to edit, and you can change the colors to suit your personal or business branding. For a presentation that expresses how much effort you have put in, this template is ideal. With all of its features, including tables, diagrams, statistics, and lists, its perfect for a business plan presentation. Make your ideas more appealing with these professional slides. Download Customer Retention With Email Advertising Campaign Plan Solutions To Challenges Of Integrating Email Data Clipart PDF from Slidegeeks today.
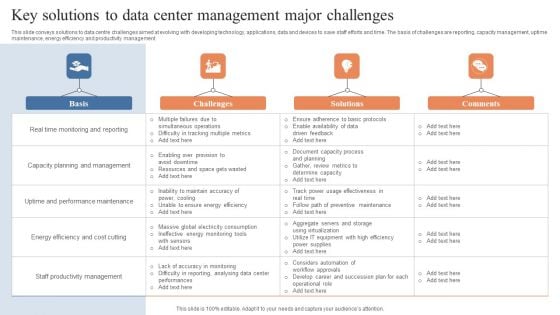
Key Solutions To Data Center Management Major Challenges Brochure PDF
This slide conveys solutions to data centre challenges aimed at evolving with developing technology, applications, data and devices to save staff efforts and time. The basis of challenges are reporting, capacity management, uptime maintenance, energy efficiency and productivity management. Showcasing this set of slides titled Key Solutions To Data Center Management Major Challenges Brochure PDF. The topics addressed in these templates are Multiple Failures, Simultaneous Operations, Difficulty Tracking, Multiple Metrics . All the content presented in this PPT design is completely editable. Download it and make adjustments in color, background, font etc. as per your unique business setting.
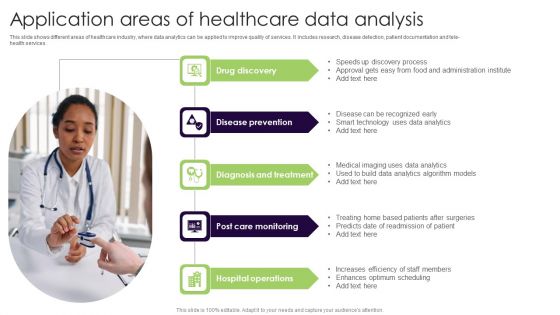
Application Areas Of Healthcare Data Analysis Slides PDF
This slide shows different areas of healthcare industry, where data analytics can be applied to improve quality of services. Showcasing this set of slides titled Application Areas Of Healthcare Data Analysis Slides PDF. The topics addressed in these templates are Disease Prevention, Diagnosis And Treatment, Post Care Monitoring. All the content presented in this PPT design is completely editable. Download it and make adjustments in color, background, font etc. as per your unique business setting.
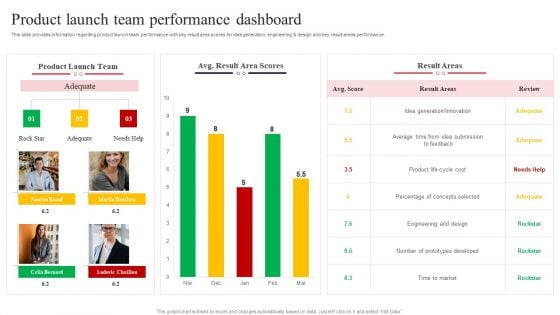
New Product Launch Product Launch Team Performance Dashboard Portrait PDF
This slide provides information regarding product launch team performance with key result area scores for idea generation, engineering AND design and key result areas performance. Retrieve professionally designed New Product Launch Product Launch Team Performance Dashboard Portrait PDF to effectively convey your message and captivate your listeners. Save time by selecting pre-made slideshows that are appropriate for various topics, from business to educational purposes. These themes come in many different styles, from creative to corporate, and all of them are easily adjustable and can be edited quickly. Access them as PowerPoint templates or as Google Slides themes. You dont have to go on a hunt for the perfect presentation because Slidegeeks got you covered from everywhere.
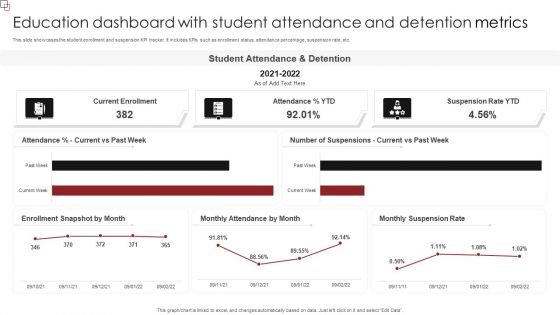
Education Dashboard With Student Attendance And Detention Metrics Inspiration PDF
This slide showcases the student enrollment and suspension KPI tracker. It includes KPIs such as enrollment status, attendance percentage, suspension rate, etc. Pitch your topic with ease and precision using this Education Dashboard With Student Attendance And Detention Metrics Inspiration PDF. This layout presents information on Student Attendance, Suspension Rate YTD, Current Enrollment. It is also available for immediate download and adjustment. So, changes can be made in the color, design, graphics or any other component to create a unique layout.


 Continue with Email

 Home
Home


