Business Snapshot
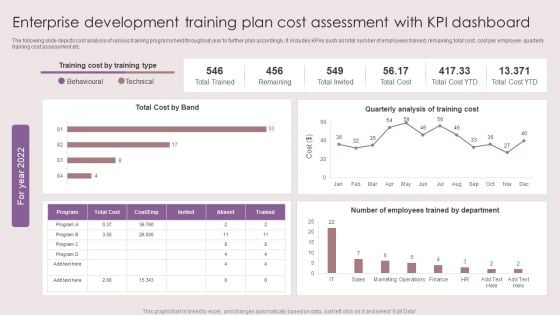
Enterprise Development Training Plan Cost Assessment With KPI Dashboard Mockup PDF
The following slide depicts cost analysis of various training programs held throughout year to further plan accordingly. It includes KPAs such as total number of employees trained, remaining, total cost, cost per employee, quarterly training cost assessment etc. Showcasing this set of slides titled Enterprise Development Training Plan Cost Assessment With KPI Dashboard Mockup PDF. The topics addressed in these templates are Total Cost Band, Quarterly Analysis, Training Cost. All the content presented in this PPT design is completely editable. Download it and make adjustments in color, background, font etc. as per your unique business setting.
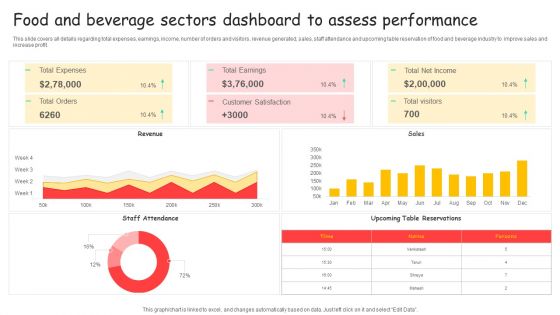
Food And Beverage Sectors Dashboard To Assess Performance Ppt Styles Elements PDF
This slide covers all details regarding total expenses, earnings, income, number of orders and visitors, revenue generated, sales, staff attendance and upcoming table reservation of food and beverage industry to improve sales and increase profit. Showcasing this set of slides titled Food And Beverage Sectors Dashboard To Assess Performance Ppt Styles Elements PDF. The topics addressed in these templates are Total Expenses, Total Earnings, Total Net Income. All the content presented in this PPT design is completely editable. Download it and make adjustments in color, background, font etc. as per your unique business setting.
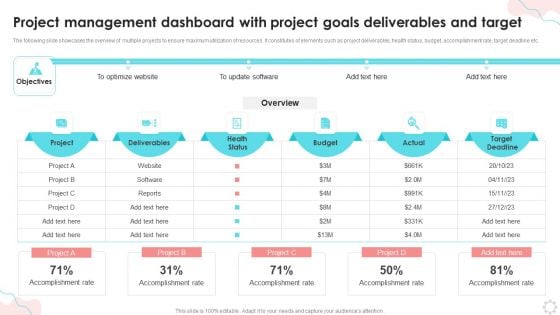
Project Management Dashboard With Project Goals Deliverables And Target Ppt PowerPoint Presentation Summary Demonstration PDF
The following slide showcases the overview of multiple projects to ensure maximum utilization of resources. It constitutes of elements such as project deliverables, health status, budget, accomplishment rate, target deadline etc.Showcasing this set of slides titled Project Management Dashboard With Project Goals Deliverables And Target Ppt PowerPoint Presentation Summary Demonstration PDF. The topics addressed in these templates are Accomplishment Rate, Optimize Website, Deliverables. All the content presented in this PPT design is completely editable. Download it and make adjustments in color, background, font etc. as per your unique business setting.
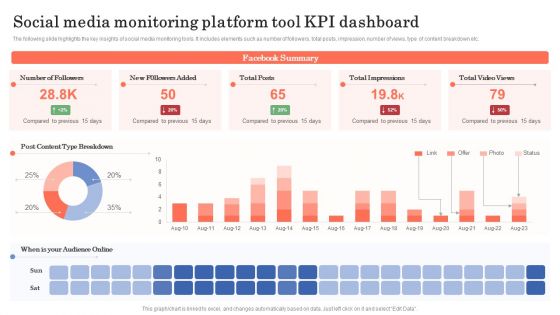
Social Media Monitoring Platform Tool KPI Dashboard Ppt Gallery Show PDF
The following slide highlights the key insights of social media monitoring tools. It includes elements such as number of followers, total posts, impression, number of views, type of content breakdown etc. Showcasing this set of slides titled Social Media Monitoring Platform Tool KPI Dashboard Ppt Gallery Show PDF. The topics addressed in these templates are Number Followers, New Followers Added, Total Impressions. All the content presented in this PPT design is completely editable. Download it and make adjustments in color, background, font etc. as per your unique business setting.
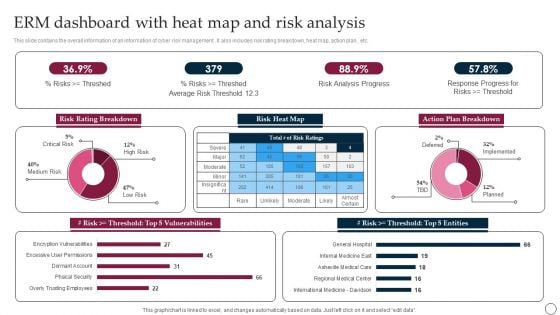
ERM Dashboard With Heat Map And Risk Analysis Ppt PowerPoint Presentation File Backgrounds PDF
This slide contains the overall information of an information of cyber risk management . It also includes risk rating breakdown, heat map, action plan , etc. Showcasing this set of slides titled ERM Dashboard With Heat Map And Risk Analysis Ppt PowerPoint Presentation File Backgrounds PDF. The topics addressed in these templates are Risk Rating Breakdown, Average Risk, Risk Analysis Progress. All the content presented in this PPT design is completely editable. Download it and make adjustments in color, background, font etc. as per your unique business setting.
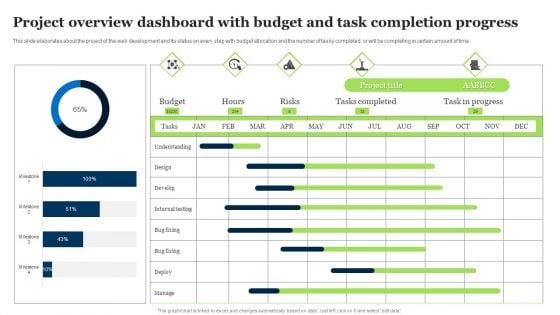
Project Overview Dashboard With Budget And Task Completion Progress Slides PDF
This slide elaborates about the project of the web development and its status on every step with budget allocation and the number of tasks completed or will be completing in certain amount of time. Showcasing this set of slides titled Project Overview Dashboard With Budget And Task Completion Progress Slides PDF. The topics addressed in these templates are Project Title, Budget, Risks. All the content presented in this PPT design is completely editable. Download it and make adjustments in color, background, font etc. as per your unique business setting.
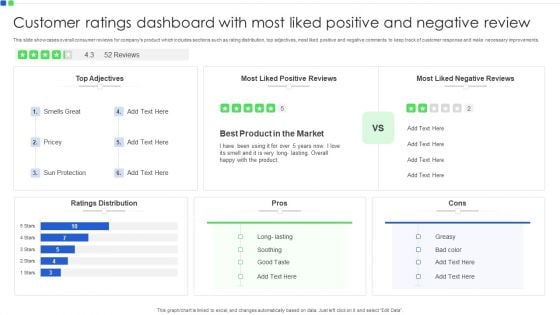
Customer Ratings Dashboard With Most Liked Positive And Negative Review Formats PDF
This slide showcases overall consumer reviews for companys product which includes sections such as rating distribution, top adjectives, most liked positive and negative comments to keep track of customer response and make necessary improvements. Showcasing this set of slides titled Customer Ratings Dashboard With Most Liked Positive And Negative Review Formats PDF. The topics addressed in these templates are Smells Great, Sun Protection, Soothing. All the content presented in this PPT design is completely editable. Download it and make adjustments in color, background, font etc. as per your unique business setting.
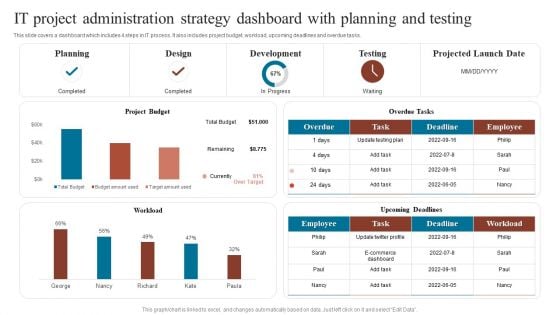
It Project Administration Strategy Dashboard With Planning And Testing Download PDF
This slide helps in enclosing the detailed plan of allocated resources of individual project by the project managers. It also illustrates task and interdependencies with respect of their roles. Showcasing this set of slides titled It Project Administration Strategy Dashboard With Planning And Testing Download PDF. The topics addressed in these templates are Overdue Tasks, Development, Projected Launch. All the content presented in this PPT design is completely editable. Download it and make adjustments in color, background, font etc. as per your unique business setting.
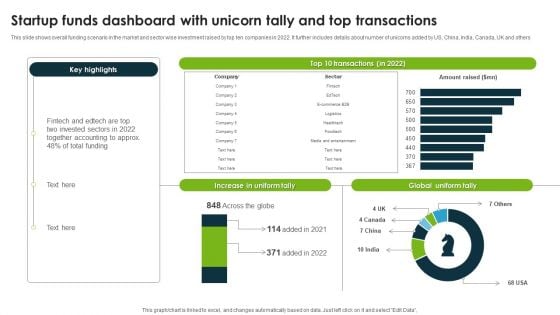
Startup Funds Dashboard With Unicorn Tally And Top Transactions Graphics PDF
This slide shows overall funding scenario in the market and sector wise investment raised by top ten companies in 2022. It further includes details about number of unicorns added by US, China, India, Canada, UK and others. Showcasing this set of slides titled Startup Funds Dashboard With Unicorn Tally And Top Transactions Graphics PDF. The topics addressed in these templates are Invested Sectors, Global Uniform Tally, Increase In Uniform Tally. All the content presented in this PPT design is completely editable. Download it and make adjustments in color, background, font etc. as per your unique business setting.
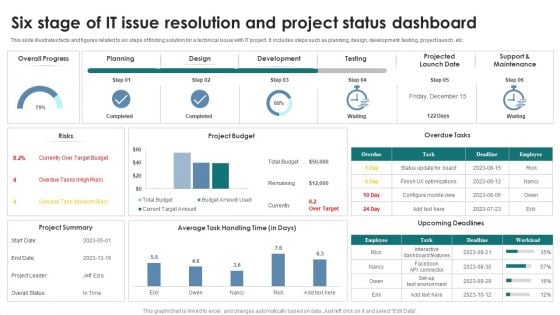
Six Stage Of IT Issue Resolution And Project Status Dashboard Topics PDF
This slide illustrates facts and figures related to six steps of finding solution for a technical issue with IT project. It includes steps such as planning, design, development, testing, project launch, etc. Showcasing this set of slides titled Six Stage Of IT Issue Resolution And Project Status Dashboard Topics PDF. The topics addressed in these templates are Planning, Design, Development. All the content presented in this PPT design is completely editable. Download it and make adjustments in color, background, font etc. as per your unique business setting.
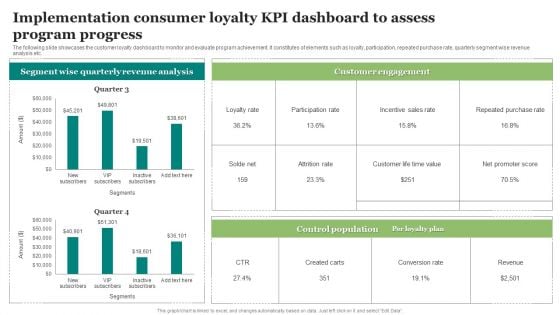
Implementation Consumer Loyalty KPI Dashboard To Assess Program Progress Guidelines PDF
The following slide illustrates the impact of executing artificial technology and machine learning in customer loyalty program. It includes elements such as predictive insights, prescriptive analytics, fraud prevention, intelligent interference etc. Showcasing this set of slides titled Implementation Consumer Loyalty KPI Dashboard To Assess Program Progress Guidelines PDF. The topics addressed in these templates are Implementation Consumer, Assess Program. All the content presented in this PPT design is completely editable. Download it and make adjustments in color, background, font etc. as per your unique business setting.
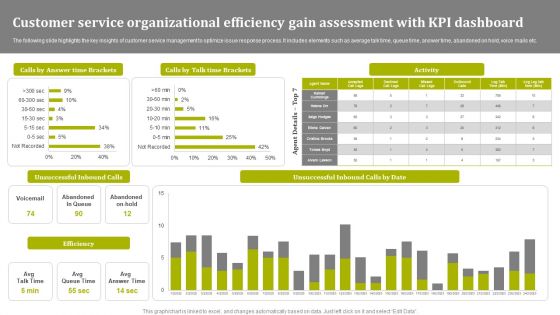
Customer Service Organizational Efficiency Gain Assessment With KPI Dashboard Slides PDF
The following slide highlights the key insights of customer service management to optimize issue response process. It includes elements such as average talk time, queue time, answer time, abandoned on hold, voice mails etc. Showcasing this set of slides titled Customer Service Organizational Efficiency Gain Assessment With KPI Dashboard Slides PDF. The topics addressed in these templates are Activity, Unsuccessful Inbound Calls, Efficiency. All the content presented in this PPT design is completely editable. Download it and make adjustments in color, background, font etc. as per your unique business setting.
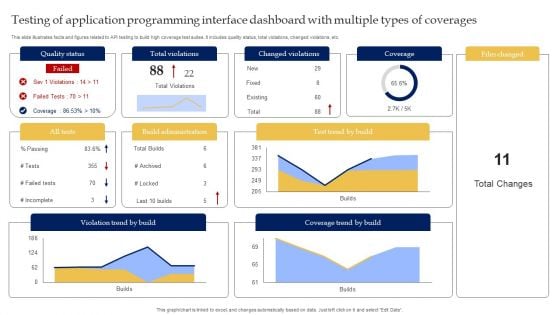
Testing Of Application Programming Interface Dashboard With Multiple Types Of Coverages Demonstration PDF
This slide illustrates facts and figures related to API testing to build high coverage test suites. It includes quality status, total violations, changed violations, etc. Showcasing this set of slides titled Testing Of Application Programming Interface Dashboard With Multiple Types Of Coverages Demonstration PDF. The topics addressed in these templates are Quality Status, Total Violations, Changed Violations. All the content presented in this PPT design is completely editable. Download it and make adjustments in color, background, font etc. as per your unique business setting.
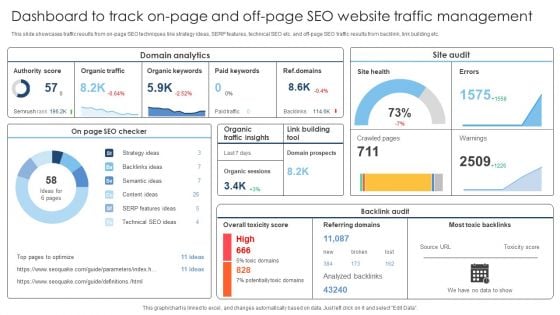
Dashboard To Track On Page And Off Page SEO Website Traffic Management Information PDF
This slide showcases traffic results from on-page SEO techniques like strategy ideas, SERP features, technical SEO etc. and off-page SEO traffic results from backlink, link building etc. Showcasing this set of slides titled Dashboard To Track On Page And Off Page SEO Website Traffic Management Information PDF. The topics addressed in these templates are Domain Analytics, Site Audit, Backlink Audit. All the content presented in this PPT design is completely editable. Download it and make adjustments in color, background, font etc. as per your unique business setting.
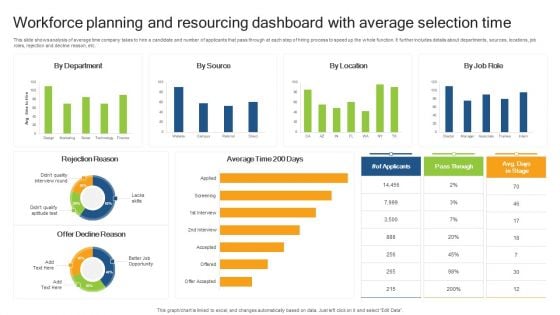
Workforce Planning And Resourcing Dashboard With Average Selection Time Demonstration PDF
This slide shows analysis of average time company takes to hire a candidate and number of applicants that pass through at each step of hiring process to speed up the whole function. It further includes details about departments, sources, locations, job roles, rejection and decline reason, etc. Showcasing this set of slides titled Workforce Planning And Resourcing Dashboard With Average Selection Time Demonstration PDF. The topics addressed in these templates are Rejection Reason, Offer Decline Reason, Average Time. All the content presented in this PPT design is completely editable. Download it and make adjustments in color, background, font etc. as per your unique business setting.
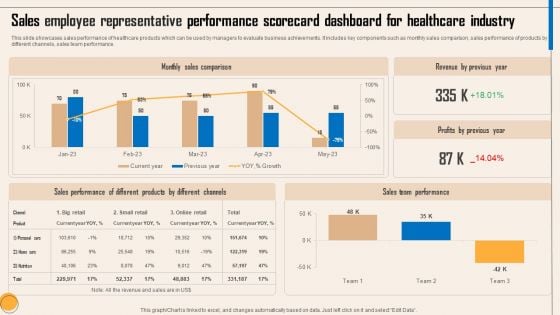
Sales Employee Representative Performance Scorecard Dashboard For Healthcare Industry Clipart PDF
This slide showcases sales performance of healthcare products which can be used by managers to evaluate business achievements. It includes key components such as monthly sales comparison, sales performance of products by different channels, sales team performance. Pitch your topic with ease and precision using this Sales Employee Representative Performance Scorecard Dashboard For Healthcare Industry Clipart PDF. This layout presents information on Monthly Sales Comparison, Revenue By Previous Year, Sales Performance, Different Products, Different Channels, Sales Team Performance . It is also available for immediate download and adjustment. So, changes can be made in the color, design, graphics or any other component to create a unique layout.
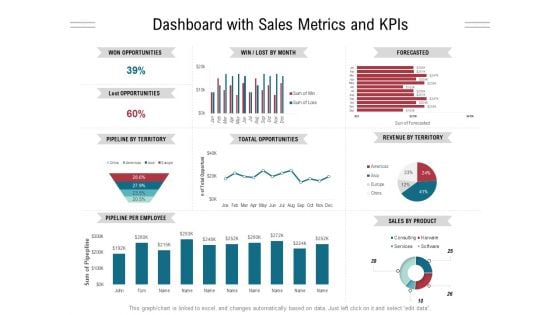
Dashboard With Sales Metrics And Kpis Ppt PowerPoint Presentation Gallery Styles PDF
Presenting this set of slides with name dashboard with sales metrics and kpis ppt powerpoint presentation gallery styles pdf. The topics discussed in these slides are won opportunities, lost opportunities, pipeline by territory, pipeline per employee, forecasted, revenue territory, sales product. This is a completely editable PowerPoint presentation and is available for immediate download. Download now and impress your audience.
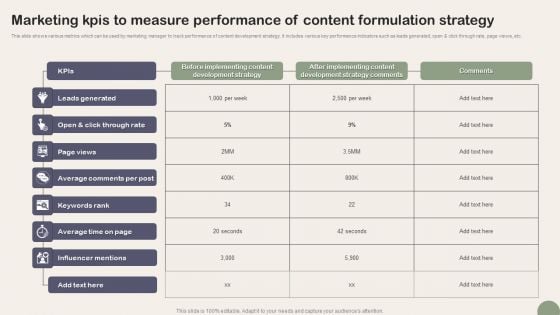
Marketing Kpis To Measure Performance Of Content Formulation Strategy Download PDF
This slide shows various metrics which can be used by marketing manager to track performance of content development strategy. It includes various key performance indicators such as leads generated, open and click through rate, page views, etc. Showcasing this set of slides titled Marketing Kpis To Measure Performance Of Content Formulation Strategy Download PDF. The topics addressed in these templates are Leads Generated, Page Views, Average Comments Per Post. All the content presented in this PPT design is completely editable. Download it and make adjustments in color, background, font etc. as per your unique business setting.
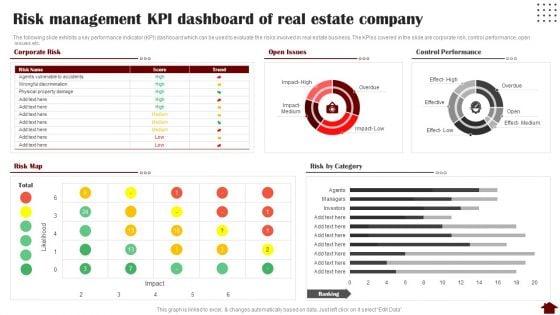
Risk Management KPI Dashboard Of Real Estate Company Rules PDF
The following slide exhibits a key performance indicator KPI dashboard which can be used to evaluate the risks involved in real estate business. The KPIss covered in the slide are corporate risk, control performance, open issues etc. Deliver and pitch your topic in the best possible manner with this Risk Management KPI Dashboard Of Real Estate Company Rules PDF. Use them to share invaluable insights on Risk Management KPI Dashboard, Real Estate Company and impress your audience. This template can be altered and modified as per your expectations. So, grab it now.
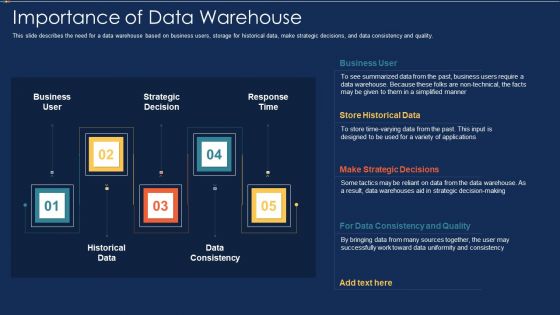
Data Warehousing IT Importance Of Data Warehouse Ppt Gallery Microsoft PDF
This slide describes the need for a data warehouse based on business users, storage for historical data, make strategic decisions, and data consistency and quality. Presenting data warehousing it importance of data warehouse ppt gallery microsoft pdf to provide visual cues and insights. Share and navigate important information on five stages that need your due attention. This template can be used to pitch topics like business user, historical data, strategic decision, data consistency, response time. In addtion, this PPT design contains high resolution images, graphics, etc, that are easily editable and available for immediate download.
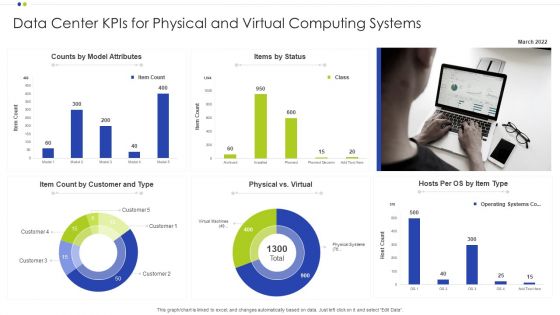
Data Center Kpis For Physical And Virtual Computing Systems Ppt Infographic Template Pictures PDF
Showcasing this set of slides titled Data Center Kpis For Physical And Virtual Computing Systems Ppt Infographic Template Pictures PDF. The topics addressed in these templates are Operating Systems, Computing Systems, Data Center. All the content presented in this PPT design is completely editable. Download it and make adjustments in color, background, font etc. as per your unique business setting.
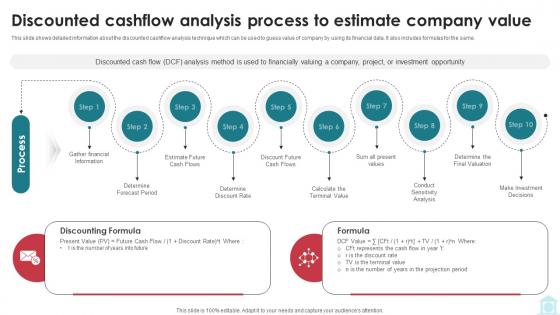
Discounted Cashflow Analysis Process To Estimate Mastering Investment Banking Fin SS V
This slide shows detailed information about the discounted cashflow analysis technique which can be used to guess value of company by using its financial data. It also includes formulas for the same. Make sure to capture your audiences attention in your business displays with our gratis customizable Discounted Cashflow Analysis Process To Estimate Mastering Investment Banking Fin SS V These are great for business strategies, office conferences, capital raising or task suggestions. If you desire to acquire more customers for your tech business and ensure they stay satisfied, create your own sales presentation with these plain slides. This slide shows detailed information about the discounted cashflow analysis technique which can be used to guess value of company by using its financial data. It also includes formulas for the same.
Data Architecture And Software Algorithm Icon Pictures PDF
Showcasing this set of slides titled Data Architecture And Software Algorithm Icon Pictures PDF. The topics addressed in these templates are Data Architecture, Software Algorithm Icon . All the content presented in this PPT design is completely editable. Download it and make adjustments in color, background, font etc. as per your unique business setting.
Secondary Data Acquisition For Research Icon Pictures PDF
Showcasing this set of slides titled Secondary Data Acquisition For Research Icon Pictures PDF. The topics addressed in these templates are Secondary Data, Acquisition Research Icon. All the content presented in this PPT design is completely editable. Download it and make adjustments in color, background, font etc. as per your unique business setting.
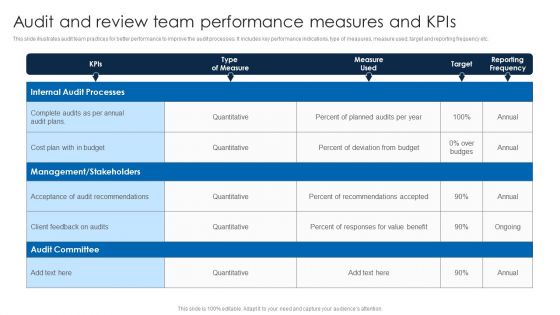
Audit And Review Team Performance Measures And Kpis Portrait PDF
This slide illustrates audit team practices for better performance to improve the audit processes. It includes key performance indications, type of measures, measure used, target and reporting frequency etc.Pitch your topic with ease and precision using this Audit And Review Team Performance Measures And Kpis Portrait PDF. This layout presents information on Business Operations, Financial Management, Environment Changes. It is also available for immediate download and adjustment. So, changes can be made in the color, design, graphics or any other component to create a unique layout.
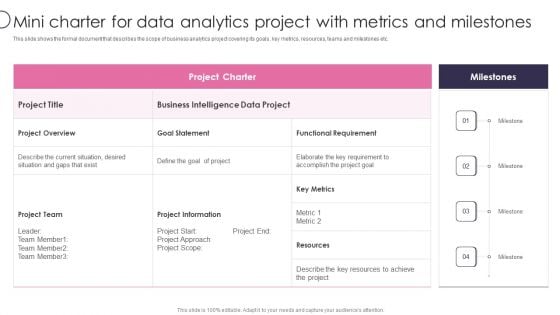
Information Transformation Process Toolkit Mini Charter For Data Analytics Project With Metrics And Milestones Themes PDF
This slide shows the formal document that describes the scope of business analytics project covering its goals, key metrics, resources, teams and milestones etc. Deliver and pitch your topic in the best possible manner with this Information Transformation Process Toolkit Mini Charter For Data Analytics Project With Metrics And Milestones Themes PDF. Use them to share invaluable insights on Project Team, Project Information, Key Metrics and impress your audience. This template can be altered and modified as per your expectations. So, grab it now.
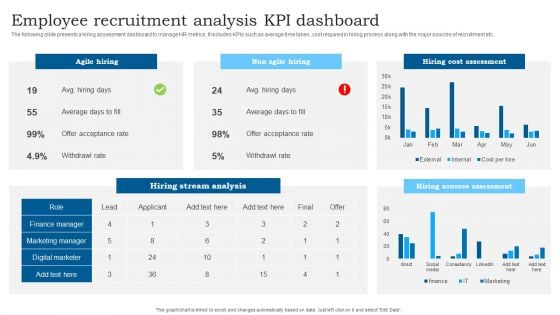
Employee Recruitment Analysis KPI Dashboard Slides PDF
The following slide presents a hiring assessment dashboard to manage HR metrics. It includes KPIs such as average time taken, cost required in hiring process along with the major sources of recruitment etc. Pitch your topic with ease and precision using this Employee Recruitment Analysis KPI Dashboard Slides PDF. This layout presents information on Agile Hiring, Non Agile Hiring, Hiring Cost Assessment. It is also available for immediate download and adjustment. So, changes can be made in the color, design, graphics or any other component to create a unique layout.
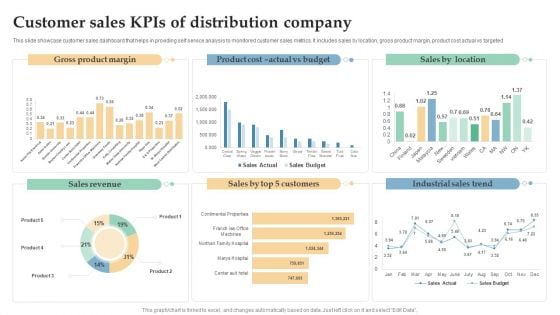
Customer Sales Kpis Of Distribution Company Ppt Infographic Template Templates PDF
This slide showcase customer sales dashboard that helps in providing self service analysis to monitored customer sales metrics. It includes sales by location, gross product margin, product cost actual vs targeted. Showcasing this set of slides titled Customer Sales Kpis Of Distribution Company Ppt Infographic Template Templates PDF. The topics addressed in these templates are Gross Product Margin, Sales Revenue, Industrial Sales Trend. All the content presented in this PPT design is completely editable. Download it and make adjustments in color, background, font etc. as per your unique business setting.
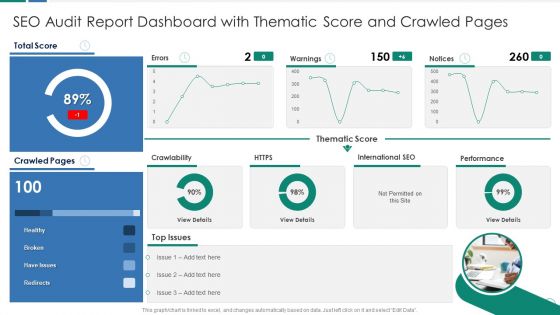
SEO Audit Report Dashboard With Thematic Score And Crawled Pages Download PDF
This graph or chart is linked to excel, and changes automatically based on data. Just left click on it and select Edit Data. Deliver and pitch your topic in the best possible manner with this SEO Audit Report Dashboard With Thematic Score And Crawled Pages Download PDF. Use them to share invaluable insights on Thematic Score Warnings, International SEO Performance, Total Score Healthy and impress your audience. This template can be altered and modified as per your expectations. So, grab it now.
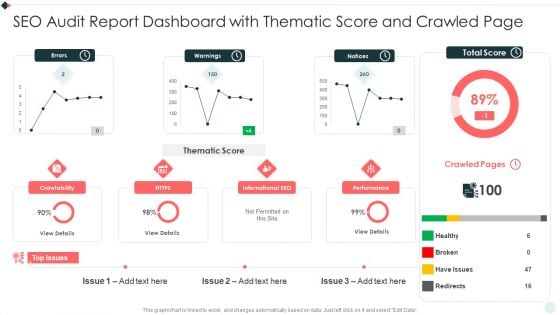
SEO Audit Summary To Increase SEO Audit Report Dashboard With Thematic Score Download PDF
This graph or chart is linked to excel, and changes automatically based on data. Just left click on it and select Edit Data. Deliver an awe inspiring pitch with this creative SEO Audit Summary To Increase SEO Audit Report Dashboard With Thematic Score Download PDF bundle. Topics like Total Score, Crawled Pages, Top Issues can be discussed with this completely editable template. It is available for immediate download depending on the needs and requirements of the user.
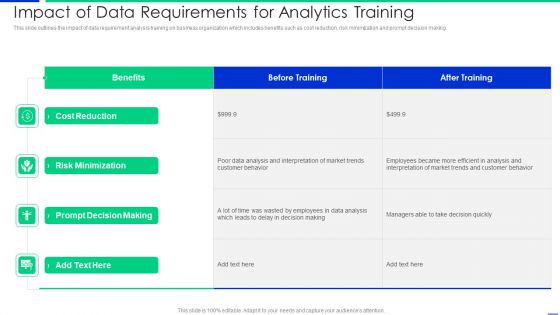
Impact Of Data Requirements For Analytics Training Background PDF
This slide outlines the impact of data requirement analysis training on business organization which includes benefits such as cost reduction, risk minimization and prompt decision making. Pitch your topic with ease and precision using this impact of data requirements for analytics training background pdf. This layout presents information on risk minimization, prompt decision making, cost reduction. It is also available for immediate download and adjustment. So, changes can be made in the color, design, graphics or any other component to create a unique layout.
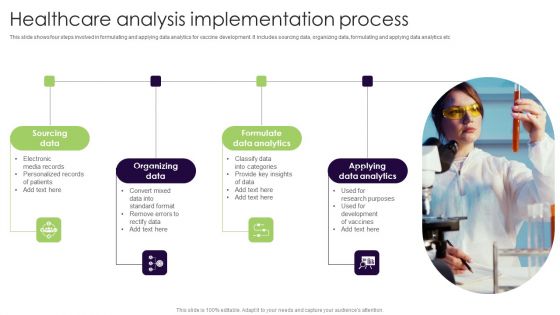
Healthcare Analysis Implementation Process Background PDF
This slide shows four steps involved in formulating and applying data analytics for vaccine development. It includes sourcing data, organizing data, formulating and applying data analytics etc. Showcasing this set of slides titled Healthcare Analysis Implementation Process Background PDF. The topics addressed in these templates are Sourcing Data, Organizing Data, Formulate Data Analytics. All the content presented in this PPT design is completely editable. Download it and make adjustments in color, background, font etc. as per your unique business setting.
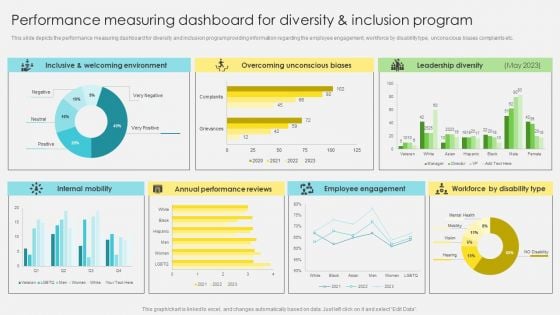
Performance Measuring Dashboard For Diversity And Inclusion Program Template PDF
This slide depicts the performance measuring dashboard for diversity and inclusion program providing information regarding the employee engagement, workforce by disability type, unconscious biases complaints etc. The Performance Measuring Dashboard For Diversity And Inclusion Program Template PDF is a compilation of the most recent design trends as a series of slides. It is suitable for any subject or industry presentation, containing attractive visuals and photo spots for businesses to clearly express their messages. This template contains a variety of slides for the user to input data, such as structures to contrast two elements, bullet points, and slides for written information. Slidegeeks is prepared to create an impression.
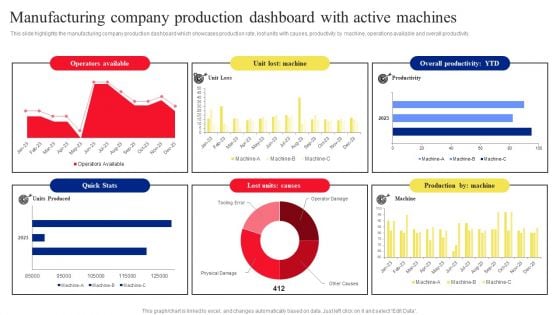
Manufacturing Company Production Dashboard With Active Machines Microsoft PDF
This slide highlights the manufacturing company production dashboard which showcases production rate, lost units with causes, productivity by machine, operations available and overall productivity. The Manufacturing Company Production Dashboard With Active Machines Microsoft PDF is a compilation of the most recent design trends as a series of slides. It is suitable for any subject or industry presentation, containing attractive visuals and photo spots for businesses to clearly express their messages. This template contains a variety of slides for the user to input data, such as structures to contrast two elements, bullet points, and slides for written information. Slidegeeks is prepared to create an impression.
Social Media Performance Tracking And Monitoring Dashboard Graphics PDF
The following slide showcases a dashboard to track and measure social media platforms performance. It includes key elements such as website traffic, social media referral rate, site revenue, social media site revenue, etc. The Social Media Performance Tracking And Monitoring Dashboard Graphics PDF is a compilation of the most recent design trends as a series of slides. It is suitable for any subject or industry presentation, containing attractive visuals and photo spots for businesses to clearly express their messages. This template contains a variety of slides for the user to input data, such as structures to contrast two elements, bullet points, and slides for written information. Slidegeeks is prepared to create an impression.
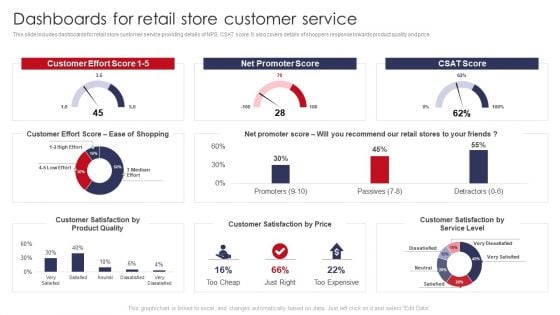
Dashboards For Retail Store Customer Service Retail Outlet Operations Performance Evaluation Pictures PDF
This slide includes dashboards for retail store customer service providing details of NPS, CSAT score. It also covers details of shoppers response towards product quality and price. Deliver an awe inspiring pitch with this creative Dashboards For Retail Store Customer Service Retail Outlet Operations Performance Evaluation Pictures PDF bundle. Topics like Customer Effort, Promoter Score, Customer Satisfaction can be discussed with this completely editable template. It is available for immediate download depending on the needs and requirements of the user.
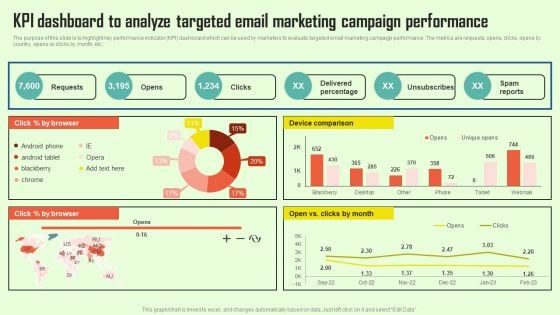
Increasing Consumer Engagement With Database KPI Dashboard To Analyze Targeted Email Infographics PDF
The purpose of this slide is to highlight key performance indicator KPI dashboard which can be used by marketers to evaluate targeted email marketing campaign performance. The metrics are requests, opens, clicks, opens by country, opens vs clicks by month, etc. This modern and well arranged Increasing Consumer Engagement With Database KPI Dashboard To Analyze Targeted Email Infographics PDF provides lots of creative possibilities. It is very simple to customize and edit with the Powerpoint Software. Just drag and drop your pictures into the shapes. All facets of this template can be edited with Powerpoint no extra software is necessary. Add your own material, put your images in the places assigned for them, adjust the colors, and then you can show your slides to the world, with an animated slide included.
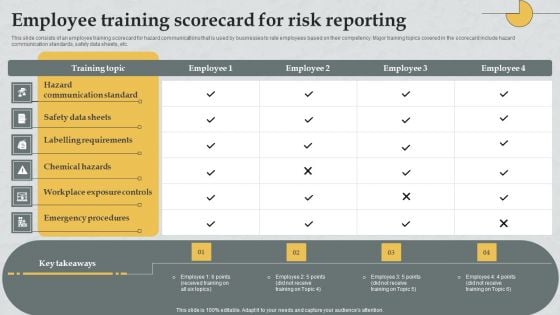
Employee Training Scorecard For Risk Reporting Microsoft PDF
This slide consists of an employee training scorecard for hazard communications that is used by businesses to rate employees based on their competency. Major training topics covered in the scorecard include hazard communication standards, safety data sheets, etc. Showcasing this set of slides titled Employee Training Scorecard For Risk Reporting Microsoft PDF. The topics addressed in these templates are Hazard Communication Standard, Safety Data Sheets, Labelling Requirements. All the content presented in this PPT design is completely editable. Download it and make adjustments in color, background, font etc. as per your unique business setting.
Developing Appealing Persona Social Media Marketing Performance Tracking Guidelines PDF
Following slide displays KPI dashboard that can be used to monitor the performance of social media marketing campaign. Metrics covered are related to fans number, engagement rate and page impressions. Create an editable Developing Appealing Persona Social Media Marketing Performance Tracking Guidelines PDF that communicates your idea and engages your audience. Whether youre presenting a business or an educational presentation, pre-designed presentation templates help save time. Developing Appealing Persona Social Media Marketing Performance Tracking Guidelines PDF is highly customizable and very easy to edit, covering many different styles from creative to business presentations. Slidegeeks has creative team members who have crafted amazing templates. So, go and get them without any delay.
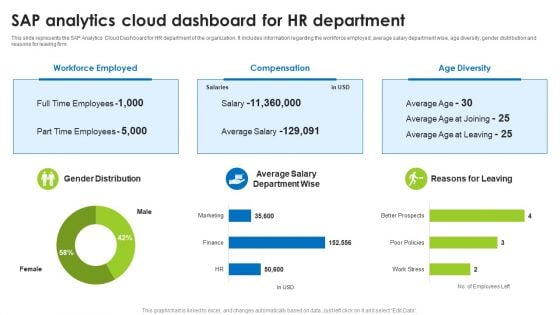
BI Technique For Data Informed Decisions Sap Analytics Cloud Dashboard For HR Department Background PDF
This slide represents the SAP Analytics Cloud Dashboard for HR department of the organization. It includes information regarding the workforce employed, average salary department wise, age diversity, gender distribution and reasons for leaving firm. This modern and well-arranged BI Technique For Data Informed Decisions Sap Analytics Cloud Dashboard For HR Department Background PDF provides lots of creative possibilities. It is very simple to customize and edit with the Powerpoint Software. Just drag and drop your pictures into the shapes. All facets of this template can be edited with Powerpoint no extra software is necessary. Add your own material, put your images in the places assigned for them, adjust the colors, and then you can show your slides to the world, with an animated slide included.
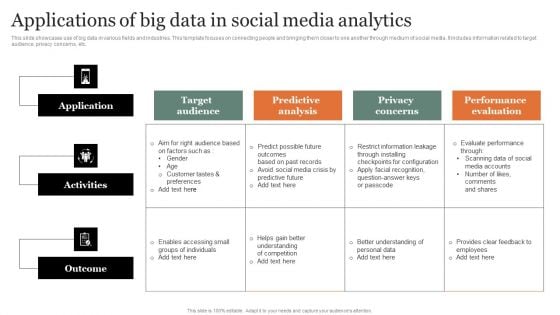
Applications Of Big Data In Social Media Analytics Graphics PDF
This slide showcases use of big data in various fields and industries. This template focuses on connecting people and bringing them closer to one another through medium of social media. It includes information related to target audience, privacy concerns, etc. Showcasing this set of slides titled Applications Of Big Data In Social Media Analytics Graphics PDF Brochure. The topics addressed in these templates are Target Audience, Predictive Analysis, Performance Evaluation. All the content presented in this PPT design is completely editable. Download it and make adjustments in color, background, font etc. as per your unique business setting.
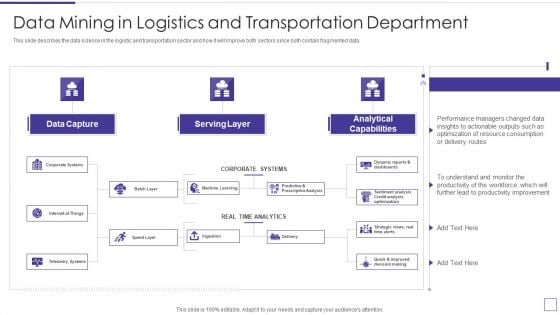
Data Mining Implementation Data Mining In Logistics And Transportation Department Information PDF
This slide describes the data science in the logistic and transportation sector and how it will improve both sectors since both contain fragmented data.Deliver an awe inspiring pitch with this creative data mining implementation data mining in logistics and transportation department information pdf bundle. Topics like dynamic reports and dashboards, predictive and prescriptive analysis, strategic views real time alerts can be discussed with this completely editable template. It is available for immediate download depending on the needs and requirements of the user.
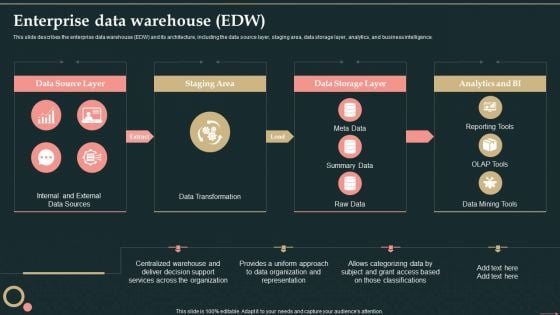
Management Information System Enterprise Data Warehouse EDW Formats PDF
This slide describes the enterprise data warehouse EDW and its architecture, including the data source layer, staging area, data storage layer, analytics, and business intelligence.Deliver an awe inspiring pitch with this creative Management Information System Enterprise Data Warehouse EDW Formats PDF bundle. Topics like Data Source, Staging Area, Data Storage can be discussed with this completely editable template. It is available for immediate download depending on the needs and requirements of the user.
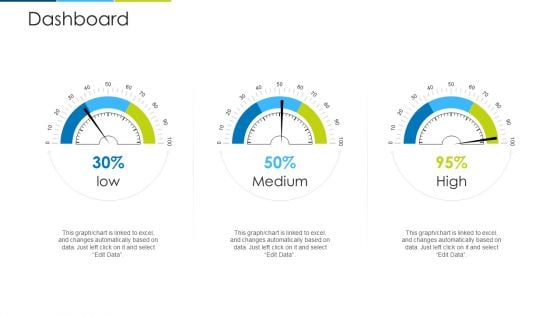
Dashboard Ppt Pictures Example PDF
Deliver an awe inspiring pitch with this creative dashboard ppt pictures example pdf bundle. Topics like dashboard can be discussed with this completely editable template. It is available for immediate download depending on the needs and requirements of the user.
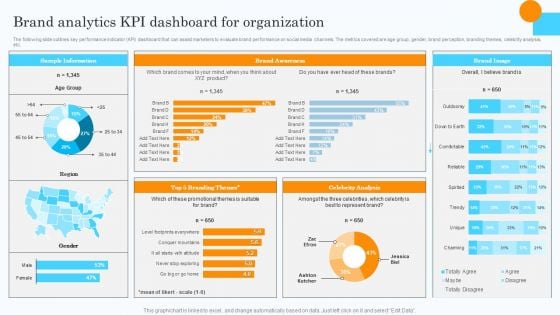
Market Research Assessment Of Target Market Requirements Brand Analytics Kpi Dashboard For Organization Clipart PDF
The following slide outlines key performance indicator KPI dashboard that can assist marketers to evaluate brand performance on social media channels. The metrics covered are age group, gender, brand perception, branding themes, celebrity analysis, etc. Do you have an important presentation coming up Are you looking for something that will make your presentation stand out from the rest Look no further than Market Research Assessment Of Target Market Requirements Brand Analytics Kpi Dashboard For Organization Clipart PDF. With our professional designs, you can trust that your presentation will pop and make delivering it a smooth process. And with Slidegeeks, you can trust that your presentation will be unique and memorable. So why wait Grab Market Research Assessment Of Target Market Requirements Brand Analytics Kpi Dashboard For Organization Clipart PDF today and make your presentation stand out from the rest.
Work From Home Performance Management Dashboard Icons PDF
The following slide outlines a comprehensive key performance indicator KPI dashboard that can be used to showcase employees performance during work from home WFH. Information covered in this slide is related to average result area scores etc. Do you have to make sure that everyone on your team knows about any specific topic. I yes, then you should give Work From Home Performance Management Dashboard Icons PDF a try. Our experts have put a lot of knowledge and effort into creating this impeccable Work From Home Performance Management Dashboard Icons PDF. You can use this template for your upcoming presentations, as the slides are perfect to represent even the tiniest detail. You can download these templates from the Slidegeeks website and these are easy to edit. So grab these today.
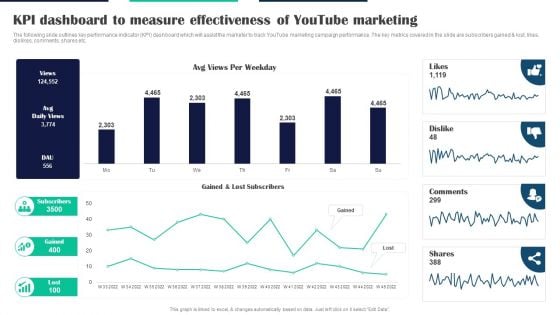
Executing Video Promotional KPI Dashboard To Measure Effectiveness Of Youtube Marketing Professional PDF
The following slide outlines key performance indicator KPI dashboard which will assist the marketer to track YouTube marketing campaign performance. The key metrics covered in the slide are subscribers gained and lost, likes, dislikes, comments, shares etc. Formulating a presentation can take up a lot of effort and time, so the content and message should always be the primary focus. The visuals of the PowerPoint can enhance the presenters message, so our Executing Video Promotional KPI Dashboard To Measure Effectiveness Of Youtube Marketing Professional PDF was created to help save time. Instead of worrying about the design, the presenter can concentrate on the message while our designers work on creating the ideal templates for whatever situation is needed. Slidegeeks has experts for everything from amazing designs to valuable content, we have put everything into Executing Video Promotional KPI Dashboard To Measure Effectiveness Of Youtube Marketing Professional PDF
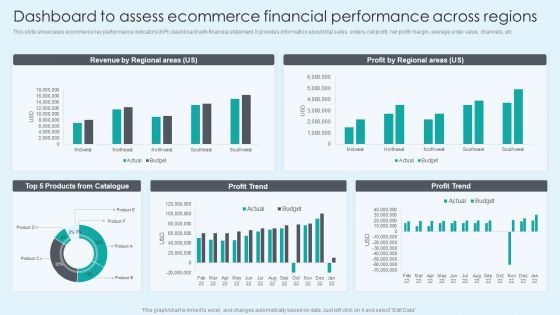
Dashboard To Assess Ecommerce Financial Performance Across Regions Themes PDF
This slide showcases ecommerce key performance indicators KPI dashboard with financial statement. It provides information about total sales, orders, net profit, net profit margin, average order value, channels, etc. Here you can discover an assortment of the finest PowerPoint and Google Slides templates. With these templates, you can create presentations for a variety of purposes while simultaneously providing your audience with an eye catching visual experience. Download Dashboard To Assess Ecommerce Financial Performance Across Regions Themes PDF to deliver an impeccable presentation. These templates will make your job of preparing presentations much quicker, yet still, maintain a high level of quality. Slidegeeks has experienced researchers who prepare these templates and write high quality content for you. Later on, you can personalize the content by editing the Dashboard To Assess Ecommerce Financial Performance Across Regions Themes PDF.
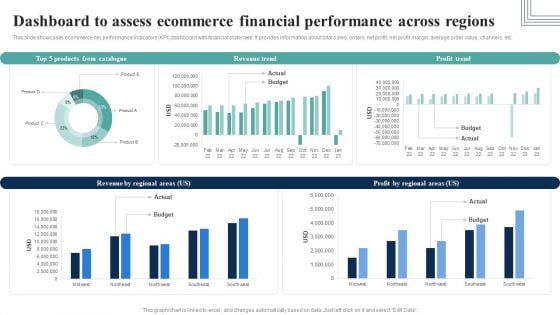
Dashboard To Assess Ecommerce Financial Performance Across Regions Infographics PDF
This slide showcases ecommerce key performance indicators KPI dashboard with financial statement. It provides information about total sales, orders, net profit, net profit margin, average order value, channels, etc.Here you can discover an assortment of the finest PowerPoint and Google Slides templates. With these templates, you can create presentations for a variety of purposes while simultaneously providing your audience with an eye-catching visual experience. Download Dashboard To Assess Ecommerce Financial Performance Across Regions Infographics PDF to deliver an impeccable presentation. These templates will make your job of preparing presentations much quicker, yet still, maintain a high level of quality. Slidegeeks has experienced researchers who prepare these templates and write high-quality content for you. Later on, you can personalize the content by editing the Dashboard To Assess Ecommerce Financial Performance Across Regions Infographics PDF.
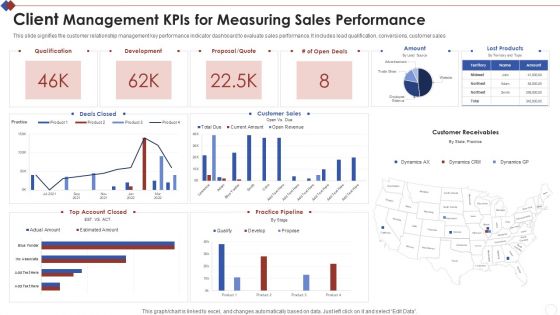
Client Management Kpis For Measuring Sales Performance Elements PDF
Showcasing this set of slides titled Client Management Kpis For Measuring Sales Performance Elements PDF. The topics addressed in these templates are Client Management Kpis For Measuring Sales Performance. All the content presented in this PPT design is completely editable. Download it and make adjustments in color, background, font etc. as per your unique business setting.
Digital Sales Metrics Showing Enhancement Icons PDF
The following slide represents statistics of online sales key performance indicators KPIs which can assist marketing manager to review their performance and take necessary steps. It include different metrics such as add to cart rate, conversion rate, and revenue per session. Showcasing this set of slides titled Digital Sales Metrics Showing Enhancement Icons PDF. The topics addressed in these templates are Quarterly Online Sales Metrics, Targeted Right Customers, Offered Product Recommendations. All the content presented in this PPT design is completely editable. Download it and make adjustments in color, background, font etc. as per your unique business setting.
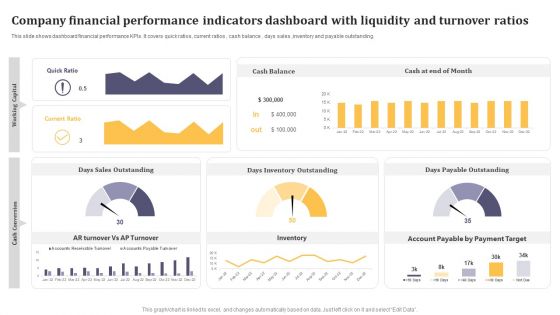
Company Financial Performance Indicators Dashboard With Liquidity And Turnover Ratios Formats PDF
This graph or chart is linked to excel, and changes automatically based on data. Just left click on it and select Edit Data. Pitch your topic with ease and precision using this Company Financial Performance Indicators Dashboard With Liquidity And Turnover Ratios Formats PDF. This layout presents information on Cash Balance, Days Inventory Outstanding, Days Payable Outstanding. It is also available for immediate download and adjustment. So, changes can be made in the color, design, graphics or any other component to create a unique layout.
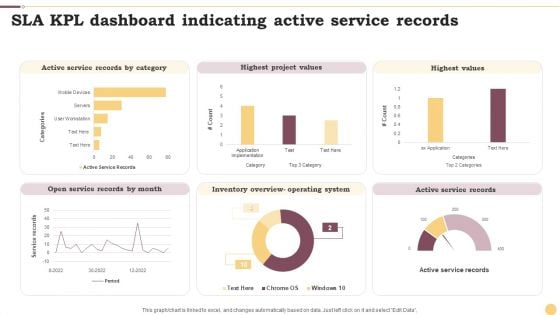
SLA KPL Dashboard Indicating Active Service Records Ppt Professional Graphics Example PDF
This graph or chart is linked to excel, and changes automatically based on data. Just left click on it and select Edit Data. Pitch your topic with ease and precision using this SLA KPL Dashboard Indicating Active Service Records Ppt Professional Graphics Example PDF. This layout presents information on Active Service Records, Highest Project Values, Highest Values. It is also available for immediate download and adjustment. So, changes can be made in the color, design, graphics or any other component to create a unique layout.
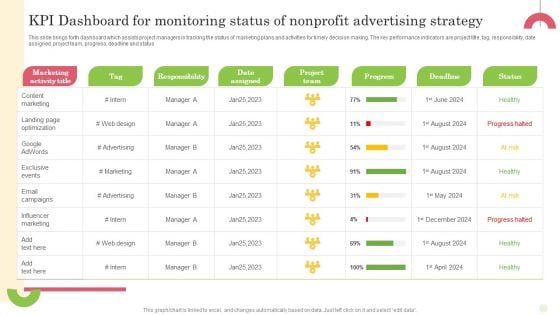
Kpi Dashboard For Monitoring Status Of Nonprofit Advertising Strategy Portrait PDF
This slide brings forth dashboard which assists project managers in tracking the status of marketing plans and activities for timely decision making. The key performance indicators are project title, tag, responsibility, date assigned, project team, progress, deadline and status Pitch your topic with ease and precision using this Kpi Dashboard For Monitoring Status Of Nonprofit Advertising Strategy Portrait PDF. This layout presents information on Tag, Responsibility, Date Assigned. It is also available for immediate download and adjustment. So, changes can be made in the color, design, graphics or any other component to create a unique layout.
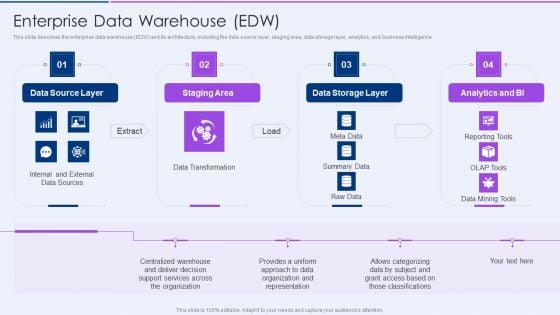
Executive Information Database System Enterprise Data Warehouse Edw Topics PDF
This slide describes the enterprise data warehouse EDW and its architecture, including the data source layer, staging area, data storage layer, analytics, and business intelligence.Deliver an awe inspiring pitch with this creative Executive Information Database System Enterprise Data Warehouse Edw Topics PDF bundle. Topics like Centralized Warehouse, Support Services, Provides A Uniform can be discussed with this completely editable template. It is available for immediate download depending on the needs and requirements of the user.
Social Platforms Data Analysis Sites Data Mining Icon Guidelines PDF
Showcasing this set of slides titled Social Platforms Data Analysis Sites Data Mining Icon Guidelines PDF. The topics addressed in these templates are Social Platforms Data Analysis, Sites Data Mining Icon. All the content presented in this PPT design is completely editable. Download it and make adjustments in color, background, font etc. as per your unique business setting.
Social Media Marketing Strategies To Generate Lead Dashboard For Tracking Social Media Kpis Summary PDF
This slide shows dashboard for tracking social media key performance indicators KPIs. It provides details about average social engagement, reactions, comments, shares, clicks, thumbnail, platform, post message, etc. Want to ace your presentation in front of a live audience Our Social Media Marketing Strategies To Generate Lead Dashboard For Tracking Social Media Kpis Summary PDF can help you do that by engaging all the users towards you. Slidegeeks experts have put their efforts and expertise into creating these impeccable powerpoint presentations so that you can communicate your ideas clearly. Moreover, all the templates are customizable, and easy to edit and downloadable. Use these for both personal and commercial use.
Application Performance Dashboard Ppt Icon Template PDF
This slide covers application performance in market KPIs and metrics such as impressions, clicks, searches for app, conversion rate etc. This Application Performance Dashboard Ppt Icon Template PDF from Slidegeeks makes it easy to present information on your topic with precision. It provides customization options, so you can make changes to the colors, design, graphics, or any other component to create a unique layout. It is also available for immediate download, so you can begin using it right away. Slidegeeks has done good research to ensure that you have everything you need to make your presentation stand out. Make a name out there for a brilliant performance.
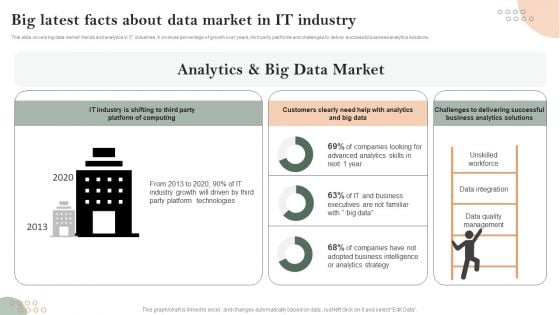
Big Latest Facts About Data Market In IT Industry Pictures PDF
This slide covers big data market trends and analytics in IT industries. It involves percentage of growth over years, third party platforms and challenges to deliver successful business analytics solutions. Showcasing this set of slides titled Big Latest Facts About Data Market In IT Industry Pictures PDF. The topics addressed in these templates are Unskilled Workforce, Data Integration, Data Quality Management. All the content presented in this PPT design is completely editable. Download it and make adjustments in color, background, font etc. as per your unique business setting.
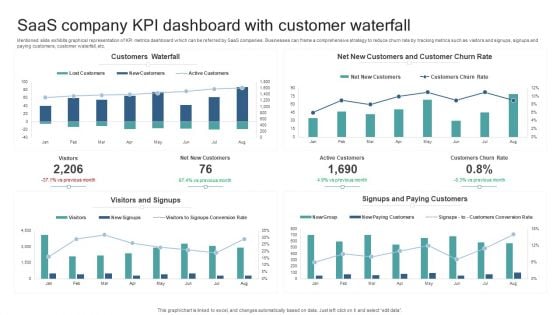
Saas Company KPI Dashboard With Customer Waterfall Slides PDF
Mentioned slide exhibits graphical representation of KPI metrics dashboard which can be referred by SaaS companies. Businesses can frame a comprehensive strategy to reduce churn rate by tracking metrics such as visitors and signups, signups and paying customers, customer waterfall, etc. Pitch your topic with ease and precision using this Saas Company KPI Dashboard With Customer Waterfall Slides PDF. This layout presents information on Customers Waterfall, Visitors And Signups, Signups And Paying Customers. It is also available for immediate download and adjustment. So, changes can be made in the color, design, graphics or any other component to create a unique layout.


 Continue with Email

 Home
Home


