Business Snapshot
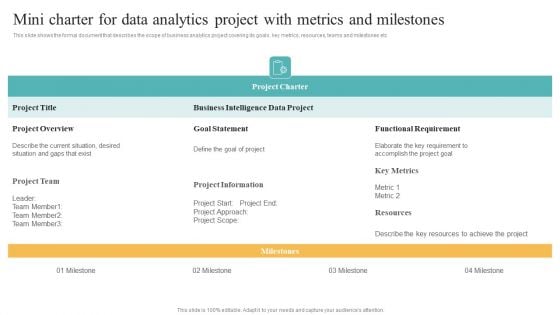
Mini Charter For Data Analytics Project With Metrics And Milestones Brochure PDF
This slide shows the formal document that describes the scope of business analytics project covering its goals, key metrics, resources, teams and milestones etc Find a pre designed and impeccable Mini Charter For Data Analytics Project With Metrics And Milestones Brochure PDF. The templates can ace your presentation without additional effort. You can download these easy to edit presentation templates to make your presentation stand out from others. So, what are you waiting for Download the template from Slidegeeks today and give a unique touch to your presentation.
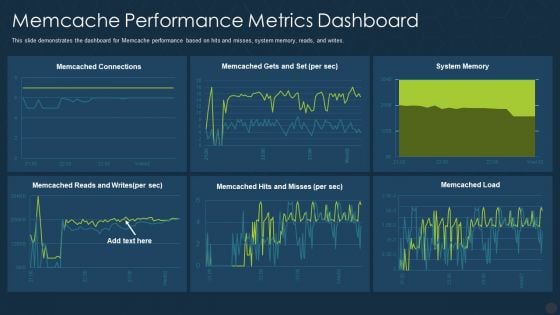
Memcache Performance Metrics Dashboard Ppt Portfolio Aids PDF
This slide demonstrates the dashboard for Memcache performance based on hits and misses, system memory, reads, and writes. Deliver an awe inspiring pitch with this creative memcache performance metrics dashboard ppt portfolio aids pdf bundle. Topics like memcache performance metrics dashboard can be discussed with this completely editable template. It is available for immediate download depending on the needs and requirements of the user.
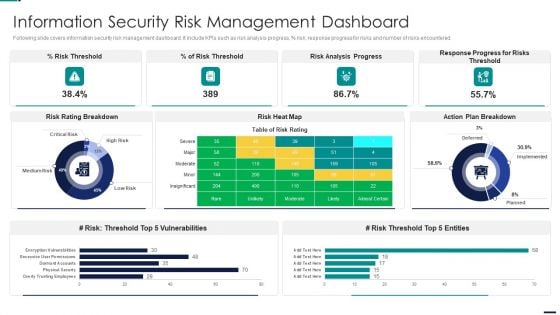
Risk Management Model For Data Security Information Security Risk Management Dashboard Pictures PDF
Following slide covers information security risk management dashboard. It include KPIs such as risk analysis progress, percent risk, response progress for risks and number of risks encountered. Deliver an awe inspiring pitch with this creative Risk Management Model For Data Security Information Security Risk Management Dashboard Pictures PDF bundle. Topics like Risk Threshold, Risk Analysis Progress, Response Progress For Risks Threshold, Action Plan Breakdown can be discussed with this completely editable template. It is available for immediate download depending on the needs and requirements of the user.
Deploying Cyber Security Incident Response Administration Enterprise Cyber Risk Management Dashboard Icons PDF
This slide represents the key metrics dashboard representing details related to management of cyber security incidents by an enterprise. It includes key performance indicators such as risk analysis progress, risk rating breakdown etc. Whether you have daily or monthly meetings, a brilliant presentation is necessary. Deploying Cyber Security Incident Response Administration Enterprise Cyber Risk Management Dashboard Icons PDF can be your best option for delivering a presentation. Represent everything in detail using Deploying Cyber Security Incident Response Administration Enterprise Cyber Risk Management Dashboard Icons PDF and make yourself stand out in meetings. The template is versatile and follows a structure that will cater to your requirements. All the templates prepared by Slidegeeks are easy to download and edit. Our research experts have taken care of the corporate themes as well. So, give it a try and see the results.

Manufacturing Quality Assurance And Control Measures Dashboard To Evaluate Manufacturing Quality Infographics PDF
This slide showcases the KPIs that would help a business organization to evaluate improvements in the new production planning and control system. It includes total production, defective production, production rate, average cycle duration, etc. This modern and well arranged Manufacturing Quality Assurance And Control Measures Dashboard To Evaluate Manufacturing Quality Infographics PDF provides lots of creative possibilities. It is very simple to customize and edit with the Powerpoint Software. Just drag and drop your pictures into the shapes. All facets of this template can be edited with Powerpoint, no extra software is necessary. Add your own material, put your images in the places assigned for them, adjust the colors, and then you can show your slides to the world, with an animated slide included.
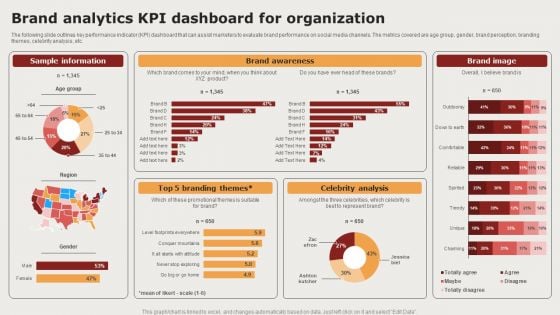
Creating Positioning Techniques For Market Research Brand Analytics Kpi Dashboard For Organization Slides PDF
The following slide outlines key performance indicator KPI dashboard that can assist marketers to evaluate brand performance on social media channels. The metrics covered are age group, gender, brand perception, branding themes, celebrity analysis, etc. Boost your pitch with our creative Creating Positioning Techniques For Market Research Brand Analytics Kpi Dashboard For Organization Slides PDF. Deliver an awe-inspiring pitch that will mesmerize everyone. Using these presentation templates you will surely catch everyones attention. You can browse the ppts collection on our website. We have researchers who are experts at creating the right content for the templates. So you do not have to invest time in any additional work. Just grab the template now and use them.
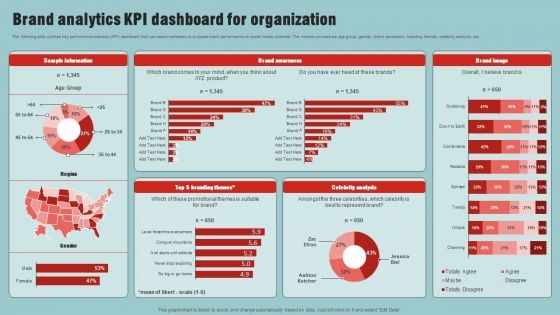
Market Analysis Overview And Different Categories Brand Analytics Kpi Dashboard For Organization Rules PDF
The following slide outlines key performance indicator KPI dashboard that can assist marketers to evaluate brand performance on social media channels. The metrics covered are age group, gender, brand perception, branding themes, celebrity analysis, etc. Present like a pro with Market Analysis Overview And Different Categories Brand Analytics Kpi Dashboard For Organization Rules PDF Create beautiful presentations together with your team, using our easy to use presentation slides. Share your ideas in real time and make changes on the fly by downloading our templates. So whether you are in the office, on the go, or in a remote location, you can stay in sync with your team and present your ideas with confidence. With Slidegeeks presentation got a whole lot easier. Grab these presentations today.

Steps To Effectively Conduct Market Research Brand Analytics KPI Dashboard For Organization Template PDF
The following slide outlines key performance indicator KPI dashboard that can assist marketers to evaluate brand performance on social media channels. The metrics covered are age group, gender, brand perception, branding themes, celebrity analysis, etc. Present like a pro with Steps To Effectively Conduct Market Research Brand Analytics KPI Dashboard For Organization Template PDF Create beautiful presentations together with your team, using our easy to use presentation slides. Share your ideas in real time and make changes on the fly by downloading our templates. So whether you are in the office, on the go, or in a remote location, you can stay in sync with your team and present your ideas with confidence. With Slidegeeks presentation got a whole lot easier. Grab these presentations today.
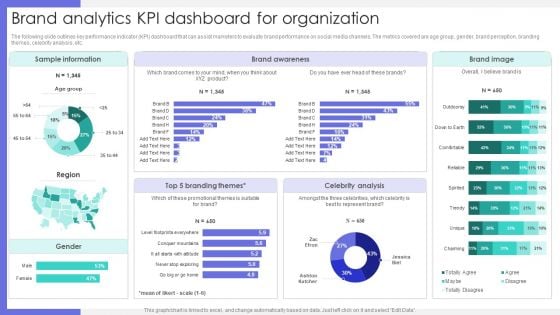
Brand Analytics Kpi Dashboard For Organization Ppt Portfolio Graphics Design PDF
The following slide outlines key performance indicator KPI dashboard that can assist marketers to evaluate brand performance on social media channels. The metrics covered are age group, gender, brand perception, branding themes, celebrity analysis, etc. Boost your pitch with our creative Brand Analytics Kpi Dashboard For Organization Ppt Portfolio Graphics Design PDF. Deliver an awe inspiring pitch that will mesmerize everyone. Using these presentation templates you will surely catch everyones attention. You can browse the ppts collection on our website. We have researchers who are experts at creating the right content for the templates. So you do not have to invest time in any additional work. Just grab the template now and use them.
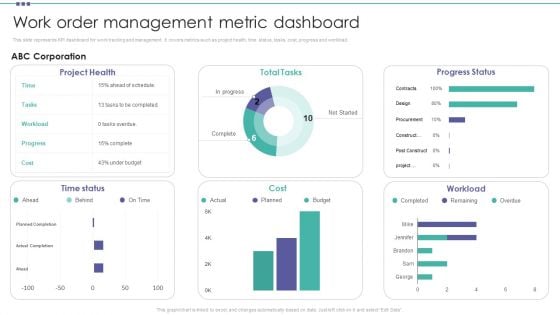
Work Order Management Metric Dashboard Organization Physical Assets Template PDF
This slide represents KPI dashboard for work tracking and management. It covers metrics such as project health, time status, tasks, cost, progress and workload. Boost your pitch with our creative Work Order Management Metric Dashboard Organization Physical Assets Template PDF. Deliver an awe-inspiring pitch that will mesmerize everyone. Using these presentation templates you will surely catch everyones attention. You can browse the ppts collection on our website. We have researchers who are experts at creating the right content for the templates. So you do not have to invest time in any additional work. Just grab the template now and use them.
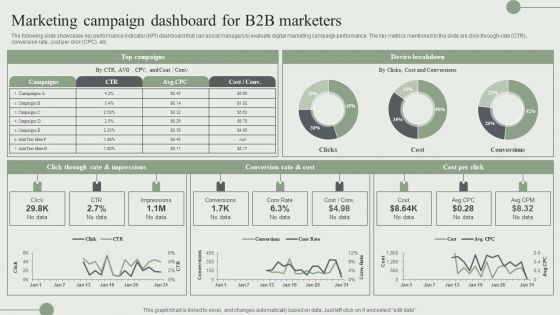
Marketing Campaign Dashboard For B2B Marketers Ppt PowerPoint Presentation File Diagrams PDF
The following slide showcases key performance indicator KPI dashboard that can assist managers to evaluate digital marketing campaign performance. The key metrics mentioned in the slide are click-through-rate CTR, conversion rate, cost per click CPC, etc. Present like a pro with Marketing Campaign Dashboard For B2B Marketers Ppt PowerPoint Presentation File Diagrams PDF Create beautiful presentations together with your team, using our easy to use presentation slides. Share your ideas in real time and make changes on the fly by downloading our templates. So whether you are in the office, on the go, or in a remote location, you can stay in sync with your team and present your ideas with confidence. With Slidegeeks presentation got a whole lot easier. Grab these presentations today.
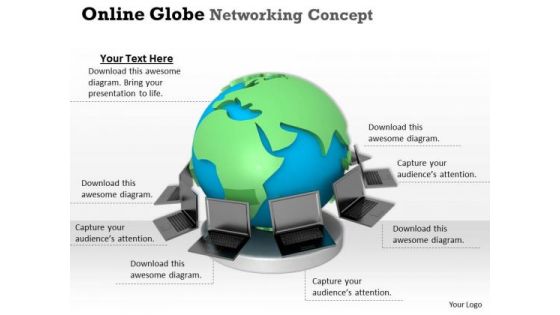
Stock Photo Online Global Networking PowerPoint Slide
This image slide displays graphic of globe surrounded with laptops. Use this image slide, in your presentations to express views on global communication and networking. This image may also be used to depict global business strategies. This image slide will enhance the quality of your presentations.
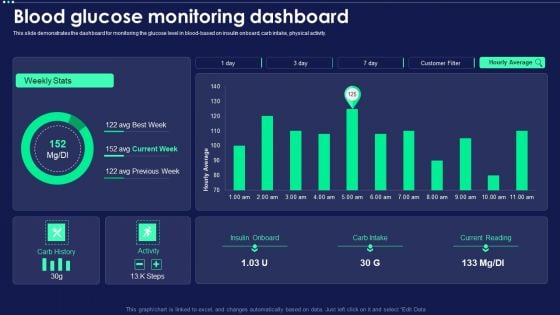
Micro Chip Blood Glucose Monitoring Dashboard Pictures PDF
This slide demonstrates the dashboard for monitoring the glucose level in blood-based on insulin onboard, carb intake, physical activity. Deliver an awe inspiring pitch with this creative Micro Chip Blood Glucose Monitoring Dashboard Pictures PDF bundle. Topics like Insulin Onboard, Carb Intake, Current Reading, Carb History can be discussed with this completely editable template. It is available for immediate download depending on the needs and requirements of the user.
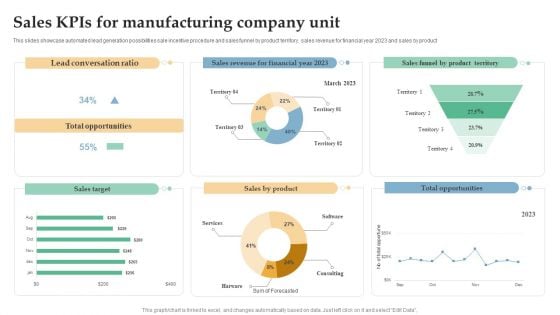
Sales Kpis For Manufacturing Company Unit Ppt Pictures Images PDF
This slides showcase automated lead generation possibilities sale incentive procedure and sales funnel by product territory, sales revenue for financial year 2023 and sales by product. Showcasing this set of slides titled Sales Kpis For Manufacturing Company Unit Ppt Pictures Images PDF. The topics addressed in these templates are Lead Conversation Ratio, Total Opportunities, Total Opportunities. All the content presented in this PPT design is completely editable. Download it and make adjustments in color, background, font etc. as per your unique business setting.
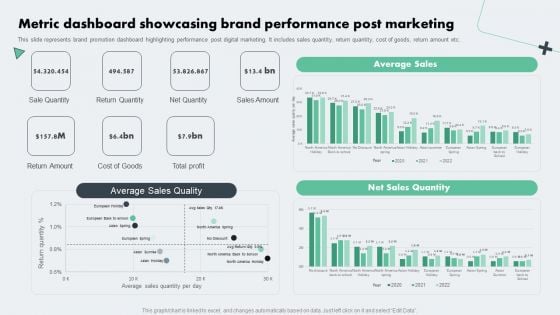
Deploying Online Marketing Metric Dashboard Showcasing Brand Performance Microsoft PDF
This slide represents brand promotion dashboard highlighting performance post digital marketing. It includes sales quantity, return quantity, cost of goods, return amount etc. From laying roadmaps to briefing everything in detail, our templates are perfect for you. You can set the stage with your presentation slides. All you have to do is download these easy-to-edit and customizable templates. Deploying Online Marketing Metric Dashboard Showcasing Brand Performance Microsoft PDF will help you deliver an outstanding performance that everyone would remember and praise you for. Do download this presentation today.
Content Marketing Dashboard For Effective Tracking Structure PDF
Purpose of the following slide is to show key metrics that can help the organization to track their content marketing efforts, these metrics are ad cost, visits, cost per click etc. Deliver an awe inspiring pitch with this creative Content Marketing Dashboard For Effective Tracking Structure PDF bundle. Topics like Metrics, Content Marketing Dashboard can be discussed with this completely editable template. It is available for immediate download depending on the needs and requirements of the user.
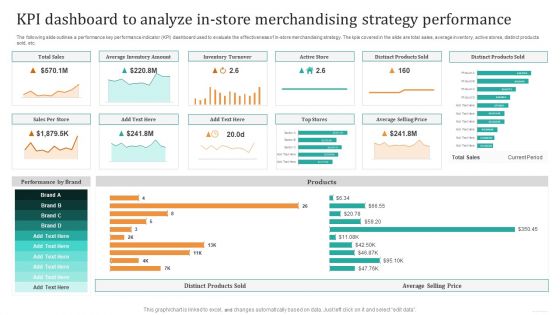
KPI Dashboard To Analyze In Store Merchandising Strategy Performance Pictures PDF
The following slide outlines a performance key performance indicator KPI dashboard used to evaluate the effectiveness of in-store merchandising strategy. The KPIs covered in the slide are total sales, average inventory, active stores, distinct products sold, etc. Formulating a presentation can take up a lot of effort and time, so the content and message should always be the primary focus. The visuals of the PowerPoint can enhance the presenters message, so our KPI Dashboard To Analyze In Store Merchandising Strategy Performance Pictures PDF was created to help save time. Instead of worrying about the design, the presenter can concentrate on the message while our designers work on creating the ideal templates for whatever situation is needed. Slidegeeks has experts for everything from amazing designs to valuable content, we have put everything into KPI Dashboard To Analyze In Store Merchandising Strategy Performance Pictures PDF.
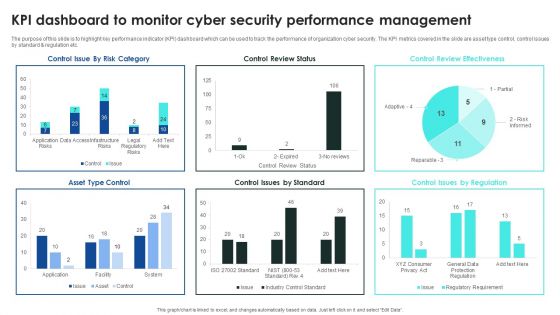
Implementing Cybersecurity Awareness Program To Prevent Attacks KPI Dashboard To Monitor Cyber Security Introduction PDF
The purpose of this slide is to highlight key performance indicator KPI dashboard which can be used to track the performance of organization cyber security. The KPI metrics covered in the slide are asset type control, control issues by standard and regulation etc. This Implementing Cybersecurity Awareness Program To Prevent Attacks KPI Dashboard To Monitor Cyber Security Introduction PDF is perfect for any presentation, be it in front of clients or colleagues. It is a versatile and stylish solution for organizing your meetings. The Implementing Cybersecurity Awareness Program To Prevent Attacks KPI Dashboard To Monitor Cyber Security Introduction PDF features a modern design for your presentation meetings. The adjustable and customizable slides provide unlimited possibilities for acing up your presentation. Slidegeeks has done all the homework before launching the product for you. So, do not wait, grab the presentation templates today

Call Center Application Market Industry Pitch Deck Ppt PowerPoint Presentation Complete Deck With Slides
This complete deck acts as a great communication tool. It helps you in conveying your business message with personalized sets of graphics, icons etc. Comprising a set of thirty one slides, this complete deck can help you persuade your audience. It also induces strategic thinking as it has been thoroughly researched and put together by our experts. Not only is it easily downloadable but also editable. The color, graphics, theme any component can be altered to fit your individual needs. So grab it now.
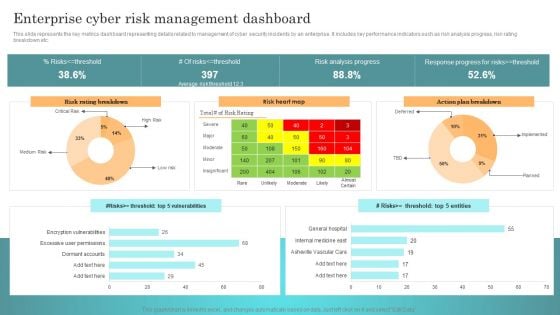
Incident Response Techniques Deployement Enterprise Cyber Risk Management Dashboard Rules PDF
This slide represents the key metrics dashboard representing details related to management of cyber security incidents by an enterprise. It includes key performance indicators such as risk analysis progress, risk rating breakdown etc. Find highly impressive Incident Response Techniques Deployement Enterprise Cyber Risk Management Dashboard Rules PDF on Slidegeeks to deliver a meaningful presentation. You can save an ample amount of time using these presentation templates. No need to worry to prepare everything from scratch because Slidegeeks experts have already done a huge research and work for you. You need to download Incident Response Techniques Deployement Enterprise Cyber Risk Management Dashboard Rules PDF for your upcoming presentation. All the presentation templates are 100 percent editable and you can change the color and personalize the content accordingly. Download now.
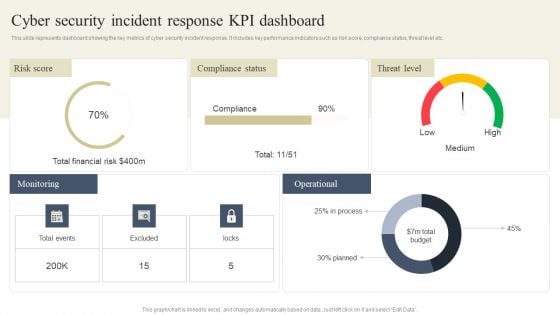
CYBER Security Breache Response Strategy Cyber Security Incident Response Kpi Dashboard Rules PDF
This slide represents dashboard showing the key metrics of cyber security incident response. It includes key performance indicators such as risk score, compliance status, threat level etc. Crafting an eye catching presentation has never been more straightforward. Let your presentation shine with this tasteful yet straightforward CYBER Security Breache Response Strategy Cyber Security Incident Response Kpi Dashboard Rules PDF template. It offers a minimalistic and classy look that is great for making a statement. The colors have been employed intelligently to add a bit of playfulness while still remaining professional. Construct the ideal CYBER Security Breache Response Strategy Cyber Security Incident Response Kpi Dashboard Rules PDF that effortlessly grabs the attention of your audience. Begin now and be certain to wow your customers.
Inbound Lead Performance Tracking Dashboard Enhancing Client Lead Conversion Rates Structure PDF
This slide covers the KPI dashboard for evaluating inbound lead performance. It includes metrics such as lead to opportunity ratio, opportunity to win ratio, lead conversion ratio, inbound leads, and leads in the sales funnel. The Inbound Lead Performance Tracking Dashboard Enhancing Client Lead Conversion Rates Structure PDF is a compilation of the most recent design trends as a series of slides. It is suitable for any subject or industry presentation, containing attractive visuals and photo spots for businesses to clearly express their messages. This template contains a variety of slides for the user to input data, such as structures to contrast two elements, bullet points, and slides for written information. Slidegeeks is prepared to create an impression.
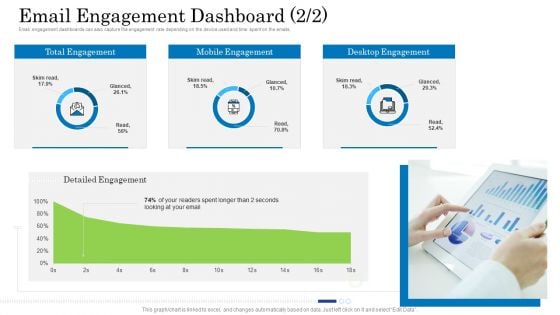
Customer Behavioral Data And Analytics Email Engagement Dashboard Email Structure PDF
Email engagement dashboards can also capture the engagement rate depending on the device used and time spent on the emails. Deliver and pitch your topic in the best possible manner with this customer behavioral data and analytics email engagement dashboard email structure pdf. Use them to share invaluable insights on email engagement dashboard and impress your audience. This template can be altered and modified as per your expectations. So, grab it now.
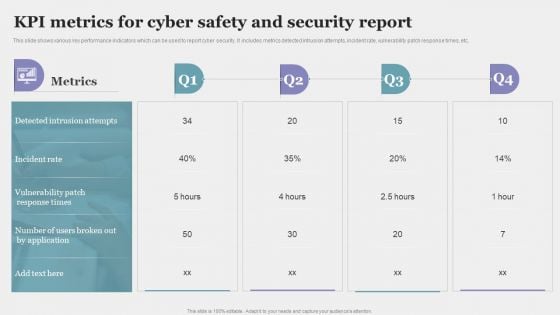
KPI Metrics For Cyber Safety And Security Report Elements PDF
This slide shows various key performance indicators which can be used to report cyber security. It includes metrics detected intrusion attempts, incident rate, vulnerability patch response times, etc. Showcasing this set of slides titled KPI Metrics For Cyber Safety And Security Report Elements PDF. The topics addressed in these templates are Incident Rate, Application, Metrics. All the content presented in this PPT design is completely editable. Download it and make adjustments in color, background, font etc. as per your unique business setting.
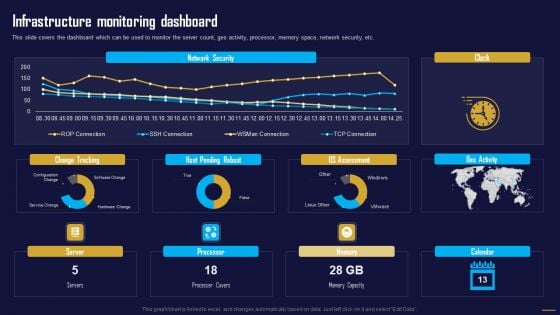
Infrastructure Monitoring Dashboard Information Tech System Maintenance Pictures PDF
This slide covers the dashboard which can be used to monitor the server count, geo activity, processor, memory space, network security, etc.Crafting an eye-catching presentation has never been more straightforward. Let your presentation shine with this tasteful yet straightforward Infrastructure Monitoring Dashboard Information Tech System Maintenance Pictures PDF template. It offers a minimalistic and classy look that is great for making a statement. The colors have been employed intelligently to add a bit of playfulness while still remaining professional. Construct the ideal Infrastructure Monitoring Dashboard Information Tech System Maintenance Pictures PDF that effortlessly grabs the attention of your audience Begin now and be certain to wow your customers.
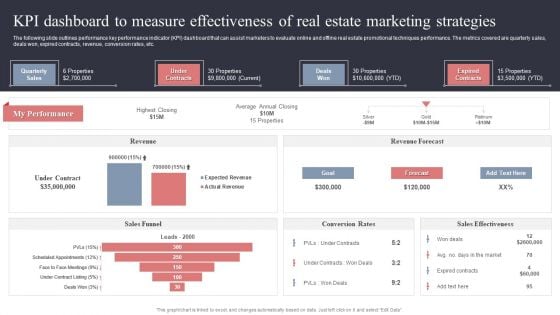
KPI Dashboard To Measure Effectiveness Of Real Estate Marketing Strategies Inspiration PDF
The following slide outlines performance key performance indicator KPI dashboard that can assist marketers to evaluate online and offline real estate promotional techniques performance. The metrics covered are quarterly sales, deals won, expired contracts, revenue, conversion rates, etc. Coming up with a presentation necessitates that the majority of the effort goes into the content and the message you intend to convey. The visuals of a PowerPoint presentation can only be effective if it supplements and supports the story that is being told. Keeping this in mind our experts created KPI Dashboard To Measure Effectiveness Of Real Estate Marketing Strategies Inspiration PDF to reduce the time that goes into designing the presentation. This way, you can concentrate on the message while our designers take care of providing you with the right template for the situation.
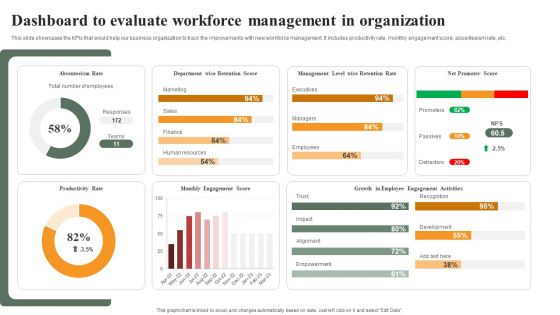
Optimizing Human Capital Alignment Dashboard To Evaluate Workforce Management In Organization Mockup PDF
This slide showcases the KPIs that would help our business organization to track the improvements with new workforce management. It includes productivity rate, monthly engagement score, absenteeism rate, etc. Do you have to make sure that everyone on your team knows about any specific topic I yes, then you should give Optimizing Human Capital Alignment Dashboard To Evaluate Workforce Management In Organization Mockup PDF a try. Our experts have put a lot of knowledge and effort into creating this impeccable Optimizing Human Capital Alignment Dashboard To Evaluate Workforce Management In Organization Mockup PDF. You can use this template for your upcoming presentations, as the slides are perfect to represent even the tiniest detail. You can download these templates from the Slidegeeks website and these are easy to edit. So grab these today.
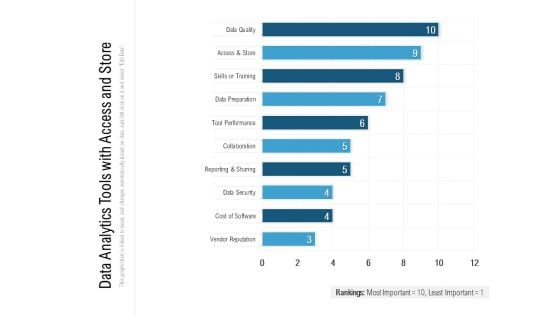
Data Analytics Tools With Access And Store Ppt PowerPoint Presentation Inspiration Aids PDF
Showcasing this set of slides titled data analytics tools with access and store ppt powerpoint presentation inspiration aids pdf. The topics addressed in these templates are cost of software, data security, collaboration, skills or training, tool performance. All the content presented in this PPT design is completely editable. Download it and make adjustments in color, background, font etc. as per your unique business setting.
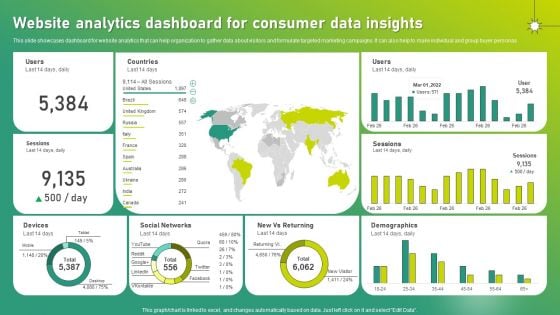
Targeted Marketing Strategic Plan For Audience Engagement Website Analytics Dashboard For Consumer Data Insights Guidelines PDF
This slide showcases dashboard for website analytics that can help organization to gather data about visitors and formulate targeted marketing campaigns. It can also help to make individual and group buyer personas. This Targeted Marketing Strategic Plan For Audience Engagement Website Analytics Dashboard For Consumer Data Insights Guidelines PDF is perfect for any presentation, be it in front of clients or colleagues. It is a versatile and stylish solution for organizing your meetings. The Targeted Marketing Strategic Plan For Audience Engagement Website Analytics Dashboard For Consumer Data Insights Guidelines PDF features a modern design for your presentation meetings. The adjustable and customizable slides provide unlimited possibilities for acing up your presentation. Slidegeeks has done all the homework before launching the product for you. So, do not wait, grab the presentation templates today.
Comparative Metrics For Continuous Tracking In Devops Tools Clipart PDF
This slide illustrates comparison of key performance indicators of DevOps tools. It includes metrics such as observability and visualization, observability and application, pattern analysis, etc. Showcasing this set of slides titled Comparative Metrics For Continuous Tracking In Devops Tools Clipart PDF. The topics addressed in these templates are Appdynamics, Datadog, Dynatrace. All the content presented in this PPT design is completely editable. Download it and make adjustments in color, background, font etc. as per your unique business setting.
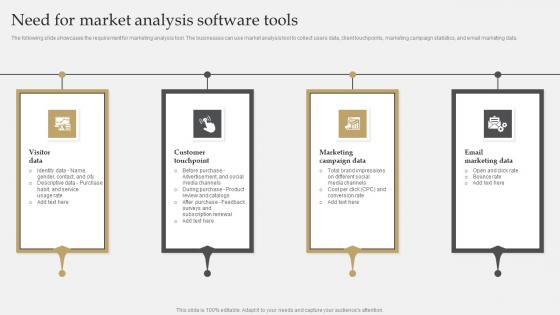
IT Industry Market Research Need For Market Analysis Software Tools Guidelines Pdf
The following slide showcases the requirement for marketing analysis tool. The businesses can use market analysis tool to collect users data, client touchpoints, marketing campaign statistics, and email marketing data. Make sure to capture your audiences attention in your business displays with our gratis customizable IT Industry Market Research Need For Market Analysis Software Tools Guidelines Pdf. These are great for business strategies, office conferences, capital raising or task suggestions. If you desire to acquire more customers for your tech business and ensure they stay satisfied, create your own sales presentation with these plain slides. The following slide showcases the requirement for marketing analysis tool. The businesses can use market analysis tool to collect users data, client touchpoints, marketing campaign statistics, and email marketing data.
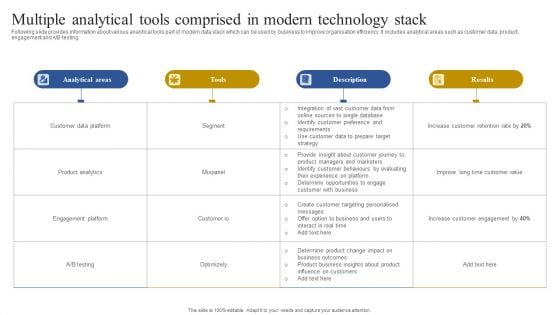
Multiple Analytical Tools Comprised In Modern Technology Stack Topics PDF
Following slide provides information about various analytical tools part of modern data stack which can be used by business to improve organisation efficiency. It includes analytical areas such as customer data, product, engagement and A or B testing. Showcasing this set of slides titled Multiple Analytical Tools Comprised In Modern Technology Stack Topics PDF. The topics addressed in these templates are Product Analytics, Engagement Platform, Customer Data Platform. All the content presented in this PPT design is completely editable. Download it and make adjustments in color, background, font etc. as per your unique business setting.
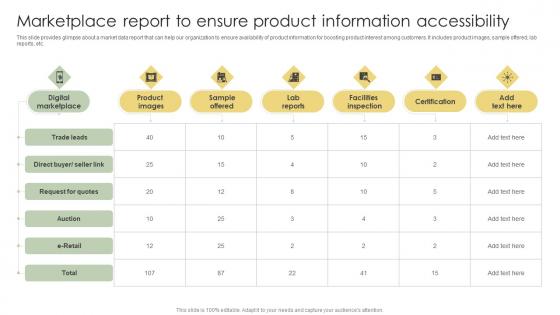
Marketplace Report To Ensure Product Information Accessibility Analyzing Customer Introduction Pdf
This slide provides glimpse about a market data report that can help our organization to ensure availability of product information for boosting product interest among customers. It includes product images, sample offered, lab reports, etc. Make sure to capture your audiences attention in your business displays with our gratis customizable Marketplace Report To Ensure Product Information Accessibility Analyzing Customer Introduction Pdf. These are great for business strategies, office conferences, capital raising or task suggestions. If you desire to acquire more customers for your tech business and ensure they stay satisfied, create your own sales presentation with these plain slides. This slide provides glimpse about a market data report that can help our organization to ensure availability of product information for boosting product interest among customers. It includes product images, sample offered, lab reports, etc.
Framework Administration KPI Metrics And Dashboard Ppt Gallery Designs PDF
Deliver and pitch your topic in the best possible manner with this framework administration kpi metrics and dashboard ppt gallery designs pdf. Use them to share invaluable insights on kpi metrics, kpi dashboards and impress your audience. This template can be altered and modified as per your expectations. So, grab it now.

Saas Metrics Dashboard Depicting Customer Acquisition Cost Download PDF
Pitch your topic with ease and precision using this Saas Metrics Dashboard Depicting Customer Acquisition Cost Download PDF This layout presents information on Saas Metrics Dashboard Depicting Customer Acquisition Cost It is also available for immediate download and adjustment. So, changes can be made in the color, design, graphics or any other component to create a unique layout.
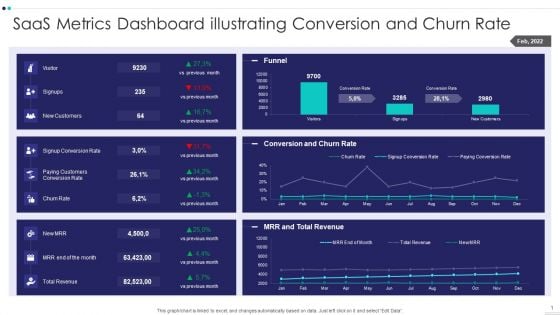
Saas Metrics Dashboard Illustrating Conversion And Churn Rate Slides PDF
Pitch your topic with ease and precision using this Saas Metrics Dashboard Illustrating Conversion And Churn Rate Slides PDF This layout presents information on Saas Metrics Dashboard Illustrating Conversion And Churn Rate It is also available for immediate download and adjustment. So, changes can be made in the color, design, graphics or any other component to create a unique layout.
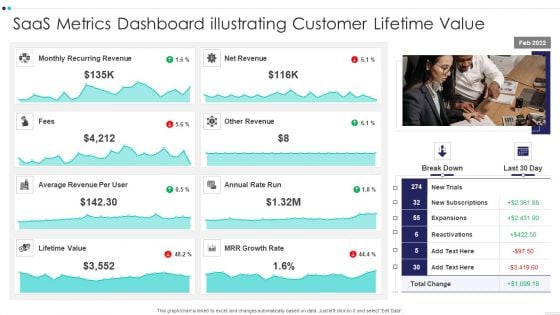
Saas Metrics Dashboard Illustrating Customer Lifetime Value Slides PDF
Pitch your topic with ease and precision using this Saas Metrics Dashboard Illustrating Customer Lifetime Value Slides PDF This layout presents information on Saas Metrics Dashboard Illustrating Customer Lifetime Value It is also available for immediate download and adjustment. So, changes can be made in the color, design, graphics or any other component to create a unique layout.
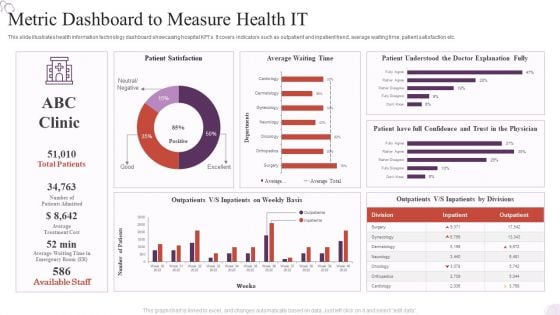
Metric Dashboard To Measure Health IT Background PDF
Pitch your topic with ease and precision using this Metric Dashboard To Measure Health IT Background PDF. This layout presents information on Metric Dashboard, Patient Satisfaction, Average Waiting Time. It is also available for immediate download and adjustment. So, changes can be made in the color, design, graphics or any other component to create a unique layout.
Shipping Order Management Tracking Metrics Dashboard Clipart PDF
Pitch your topic with ease and precision using this Shipping Order Management Tracking Metrics Dashboard Clipart PDF. This layout presents information on Management Tracking, Metrics Dashboard. It is also available for immediate download and adjustment. So, changes can be made in the color, design, graphics or any other component to create a unique layout.
Shipping Tracking Metrics Dashboard For Tracking Shipment Delays Summary PDF
Pitch your topic with ease and precision using this Shipping Tracking Metrics Dashboard For Tracking Shipment Delays Summary PDF. This layout presents information on Metrics Dashboard, Tracking Shipment. It is also available for immediate download and adjustment. So, changes can be made in the color, design, graphics or any other component to create a unique layout.
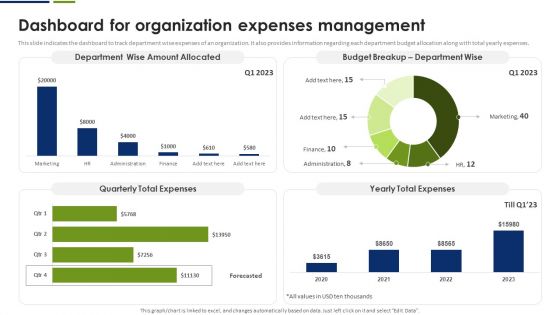
Dashboard For Organization Expenses Management Summary PDF
This slide indicates the dashboard to track department wise expenses of an organization. It also provides information regarding each department budget allocation along with total yearly expenses. Crafting an eye catching presentation has never been more straightforward. Let your presentation shine with this tasteful yet straightforward Dashboard For Organization Expenses Management Summary PDF template. It offers a minimalistic and classy look that is great for making a statement. The colors have been employed intelligently to add a bit of playfulness while still remaining professional. Construct the ideal Dashboard For Organization Expenses Management Summary PDF that effortlessly grabs the attention of your audience Begin now and be certain to wow your customers.
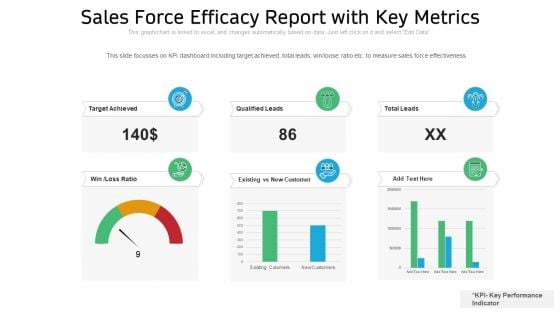
Sales Force Efficacy Report With Key Metrics Ppt PowerPoint Presentation File Summary PDF
Showcasing this set of slides titled sales force efficacy report with key metrics ppt powerpoint presentation file summary pdf. The topics addressed in these templates are sales force efficacy report with key metrics All the content presented in this PPT design is completely editable. Download it and make adjustments in color, background, font etc. as per your unique business setting.
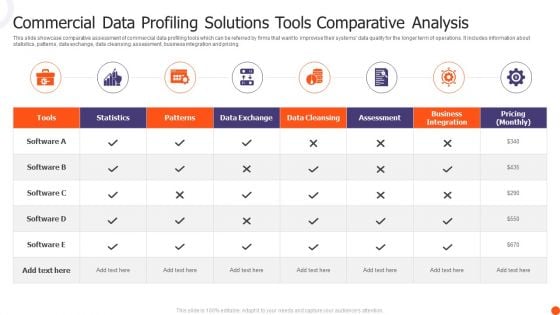
Commercial Data Profiling Solutions Tools Comparative Analysis Rules PDF
This slide showcase comparative assessment of commercial data profiling tools which can be referred by firms that want to improvise their systems data quality for the longer term of operations. It includes information about statistics, patterns, data exchange, data cleansing, assessment, business integration and pricing. Showcasing this set of slides titled Commercial Data Profiling Solutions Tools Comparative Analysis Rules PDF. The topics addressed in these templates are Patterns, Data Exchange, Data Cleansing. All the content presented in this PPT design is completely editable. Download it and make adjustments in color, background, font etc. as per your unique business setting.
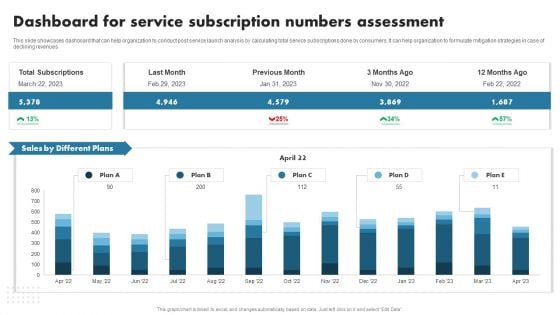
Enhancing Customer Outreach Dashboard For Service Subscription Numbers Template PDF
This slide showcases dashboard that can help organization to conduct post service launch analysis by calculating total service subscriptions done by consumers. It can help organization to formulate mitigation strategies in case of declining revenues. This Enhancing Customer Outreach Dashboard For Service Subscription Numbers Template PDF from Slidegeeks makes it easy to present information on your topic with precision. It provides customization options, so you can make changes to the colors, design, graphics, or any other component to create a unique layout. It is also available for immediate download, so you can begin using it right away. Slidegeeks has done good research to ensure that you have everything you need to make your presentation stand out. Make a name out there for a brilliant performance.
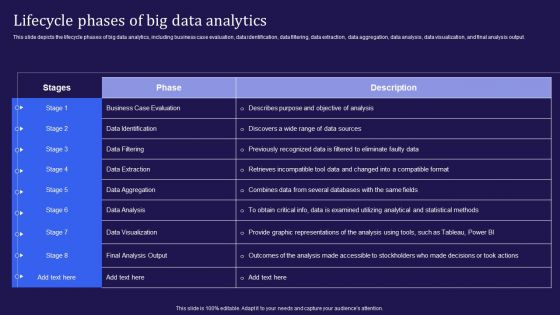
Big Data Analytics Lifecycle Lifecycle Phases Of Big Data Analytics Ppt Gallery Sample PDF
This slide depicts the lifecycle phases of big data analytics, including business case evaluation, data identification, data filtering, data extraction, data aggregation, data analysis, data visualization, and final analysis output. Slidegeeks is one of the best resources for PowerPoint templates. You can download easily and regulate Big Data Analytics Lifecycle Lifecycle Phases Of Big Data Analytics Ppt Gallery Sample PDF for your personal presentations from our wonderful collection. A few clicks is all it takes to discover and get the most relevant and appropriate templates. Use our Templates to add a unique zing and appeal to your presentation and meetings. All the slides are easy to edit and you can use them even for advertisement purposes.
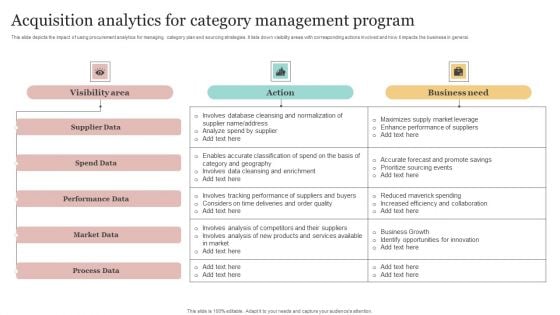
Acquisition Analytics For Category Management Program Download PDF
This slide depicts the impact of using procurement analytics for managing category plan and sourcing strategies. It lists down visibility areas with corresponding actions involved and how it impacts the business in general. Showcasing this set of slides titled Acquisition Analytics For Category Management Program Download PDF. The topics addressed in these templates are Supplier Data, Spend Data, Performance Data. All the content presented in this PPT design is completely editable. Download it and make adjustments in color, background, font etc. as per your unique business setting.
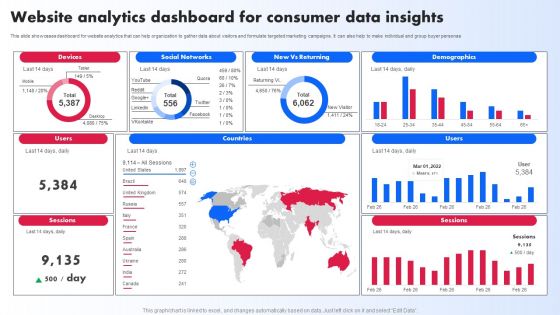
Website Analytics Dashboard For Consumer Data Insights Ppt PowerPoint Presentation File Slides PDF
This slide showcases dashboard for website analytics that can help organization to gather data about visitors and formulate targeted marketing campaigns. It can also help to make individual and group buyer personas. If you are looking for a format to display your unique thoughts, then the professionally designed Website Analytics Dashboard For Consumer Data Insights Ppt PowerPoint Presentation File Slides PDF is the one for you. You can use it as a Google Slides template or a PowerPoint template. Incorporate impressive visuals, symbols, images, and other charts. Modify or reorganize the text boxes as you desire. Experiment with shade schemes and font pairings. Alter, share or cooperate with other people on your work. Download Website Analytics Dashboard For Consumer Data Insights Ppt PowerPoint Presentation File Slides PDF and find out how to give a successful presentation. Present a perfect display to your team and make your presentation unforgettable.
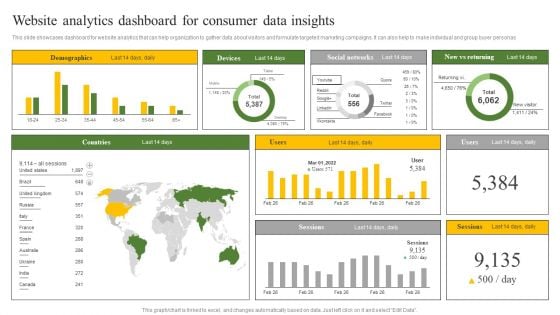
Website Analytics Dashboard For Consumer Data Insights Ppt Infographic Template Samples PDF
This slide showcases dashboard for website analytics that can help organization to gather data about visitors and formulate targeted marketing campaigns. It can also help to make individual and group buyer personas. Crafting an eye catching presentation has never been more straightforward. Let your presentation shine with this tasteful yet straightforward Website Analytics Dashboard For Consumer Data Insights Ppt Infographic Template Samples PDF template. It offers a minimalistic and classy look that is great for making a statement. The colors have been employed intelligently to add a bit of playfulness while still remaining professional. Construct the ideal Website Analytics Dashboard For Consumer Data Insights Ppt Infographic Template Samples PDF that effortlessly grabs the attention of your audience Begin now and be certain to wow your customers.
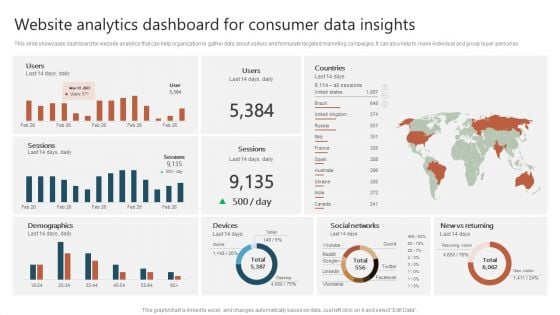
Website Analytics Dashboard For Consumer Data Insights Ppt Show Graphics Download PDF
This slide showcases dashboard for website analytics that can help organization to gather data about visitors and formulate targeted marketing campaigns. It can also help to make individual and group buyer personas. Crafting an eye catching presentation has never been more straightforward. Let your presentation shine with this tasteful yet straightforward Website Analytics Dashboard For Consumer Data Insights Ppt Show Graphics Download PDF template. It offers a minimalistic and classy look that is great for making a statement. The colors have been employed intelligently to add a bit of playfulness while still remaining professional. Construct the ideal Website Analytics Dashboard For Consumer Data Insights Ppt Show Graphics Download PDF that effortlessly grabs the attention of your audience Begin now and be certain to wow your customers.
Performance Tracking Metrics Of Marketing Return On Investment Graphics PDF
This slide shows various key performance indicators to measure performance of marketing ROI. It includes metrics such as unique monthly visitors, cost per lead, return on ad spend, average order value, etc. Showcasing this set of slides titled Performance Tracking Metrics Of Marketing Return On Investment Graphics PDF. The topics addressed in these templates are Cost Per Lead, Customer Lifetime Value, Unique Monthly Visitors. All the content presented in this PPT design is completely editable. Download it and make adjustments in color, background, font etc. as per your unique business setting.
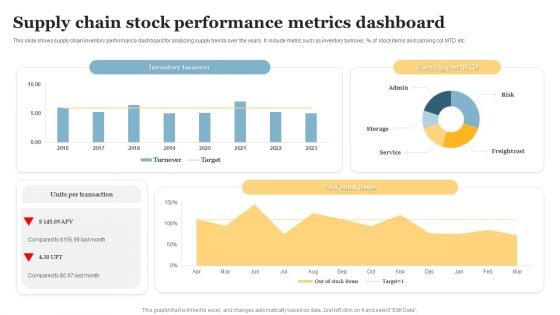
Supply Chain Stock Performance Metrics Dashboard Mockup PDF
This slide shows supply chain inventory performance dashboard for analyzing supply trends over the years. It include metric such as inventory turnover, Percent of stock items and carrying cot MTD etc . Pitch your topic with ease and precision using this Supply Chain Stock Performance Metrics Dashboard Mockup PDF. This layout presents information on Supply Chain Stock, Performance Metrics Dashboard. It is also available for immediate download and adjustment. So, changes can be made in the color, design, graphics or any other component to create a unique layout.
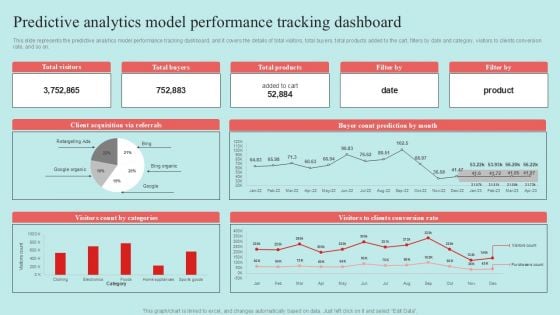
Predictive Data Model Predictive Analytics Model Performance Tracking Dashboard Themes PDF
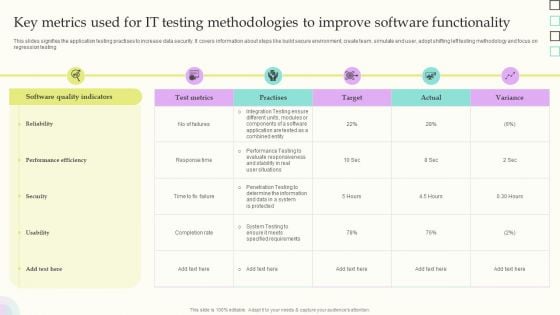
Key Metrics Used For IT Testing Methodologies To Improve Software Functionality Slides PDF
This slides signifies the application testing practises to increase data security. It covers information about steps like build secure environment, create team, simulate end user, adopt shifting left testing methodology and focus on regression testing. Showcasing this set of slides titled Key Metrics Used For IT Testing Methodologies To Improve Software Functionality Slides PDF. The topics addressed in these templates are Software Quality Indicators, Reliability, Performance Efficiency. All the content presented in this PPT design is completely editable. Download it and make adjustments in color, background, font etc. as per your unique business setting.
Cognitive Analytics Strategy And Techniques Tracking Customer Data Insights Dashboard Demonstration PDF
This slide provides information regarding customer data insights dashboard in terms of average churn risk, segments, high earner, highly engaged customers, etc. Take your projects to the next level with our ultimate collection of Cognitive Analytics Strategy And Techniques Tracking Customer Data Insights Dashboard Demonstration PDF. Slidegeeks has designed a range of layouts that are perfect for representing task or activity duration, keeping track of all your deadlines at a glance. Tailor these designs to your exact needs and give them a truly corporate look with your own brand colors they will make your projects stand out from the rest.
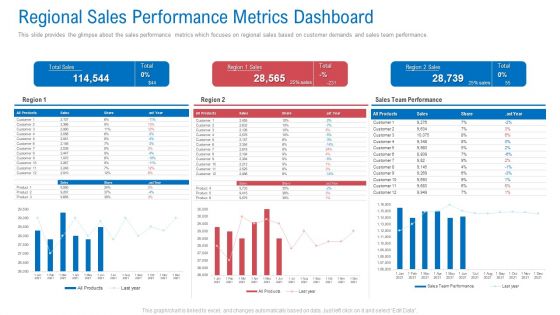
Regional Marketing Planning Regional Sales Performance Metrics Dashboard Information PDF
This slide provides the glimpse about the sales performance metrics which focuses on regional sales based on customer demands and sales team performance. Deliver an awe inspiring pitch with this creative regional marketing planning regional sales performance metrics dashboard information pdf bundle. Topics like regional sales performance metrics dashboard can be discussed with this completely editable template. It is available for immediate download depending on the needs and requirements of the user.

Market Area Analysis Regional Sales Performance Metrics Dashboard Designs PDF
This slide provides the glimpse about the sales performance metrics which focuses on regional sales based on customer demands and sales team performance. Deliver and pitch your topic in the best possible manner with this market area analysis regional sales performance metrics dashboard designs pdf. Use them to share invaluable insights on regional sales performance metrics dashboard and impress your audience. This template can be altered and modified as per your expectations. So, grab it now.

Regional Marketing Strategies Regional Sales Performance Metrics Dashboard Infographics PDF
This slide provides the glimpse about the sales performance metrics which focuses on regional sales based on customer demands and sales team performance. Deliver and pitch your topic in the best possible manner with this regional marketing strategies regional sales performance metrics dashboard infographics pdf. Use them to share invaluable insights on regional sales performance metrics dashboard and impress your audience. This template can be altered and modified as per your expectations. So, grab it now.
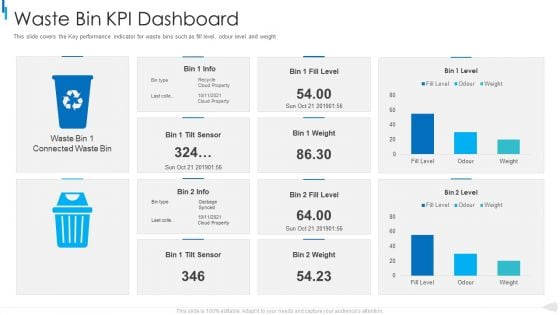
MSW Management Waste Bin Kpi Dashboard Clipart PDF
This slide covers the Key performance indicator for waste bins such as fill level, odour level and weight. Deliver an awe inspiring pitch with this creative MSW Management Waste Bin Kpi Dashboard Clipart Pdf bundle. Topics like waste bin kpi dashboard can be discussed with this completely editable template. It is available for immediate download depending on the needs and requirements of the user.
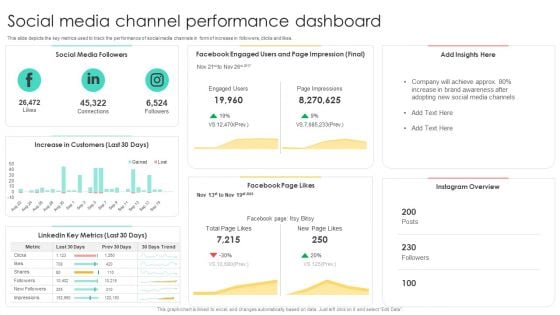
Media Advertising Social Media Channel Performance Dashboard Pictures PDF
This slide depicts the key metrics used to track the performance of social media channels in form of increase in followers, clicks and likes. This modern and well-arranged Media Advertising Social Media Channel Performance Dashboard Pictures PDF provides lots of creative possibilities. It is very simple to customize and edit with the Powerpoint Software. Just drag and drop your pictures into the shapes. All facets of this template can be edited with Powerpoint, no extra software is necessary. Add your own material, put your images in the places assigned for them, adjust the colors, and then you can show your slides to the world, with an animated slide included.
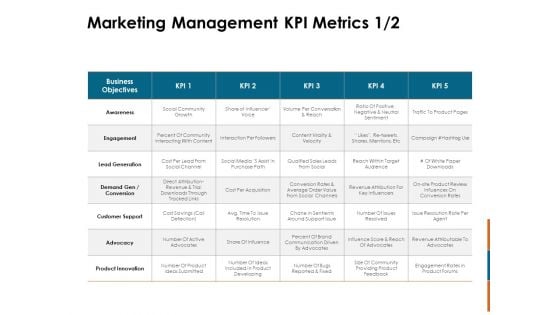
Key Statistics Of Marketing Management KPI Metrics Ppt PowerPoint Presentation Professional Graphics PDF
Deliver an awe-inspiring pitch with this creative key statistics of marketing management kpi metrics ppt powerpoint presentation professional graphics pdf bundle. Topics like business objectives, awareness, engagement, lead generation, customer support, product innovation can be discussed with this completely editable template. It is available for immediate download depending on the needs and requirements of the user.


 Continue with Email

 Home
Home


