Business Statistics
B2B Content Marketing Latest Trend Analysis Statistical Icons PDF
This slide shows the graph representing the statistical data related to latest trends emerging in the field of content marketing. It includes trends such as blog posts, email newsletters, case studies, videos, virtual events, infographics etc. Deliver an awe inspiring pitch with this creative B2B Content Marketing Latest Trend Analysis Statistical Icons PDF bundle. Topics like B2b Content Marketing, Latest Trend Analysis Statistical can be discussed with this completely editable template. It is available for immediate download depending on the needs and requirements of the user.
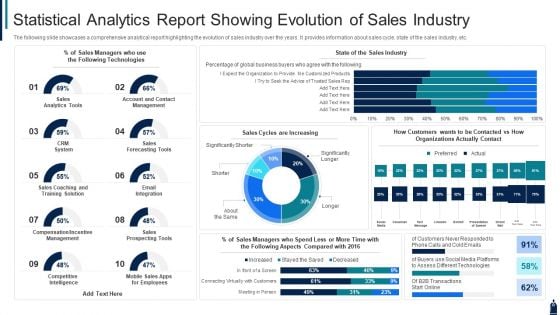
Statistical Analytics Report Showing Evolution Of Sales Industry Diagrams PDF
The following slide showcases a comprehensive analytical report highlighting the evolution of sales industry over the years. It provides information about sales cycle, state of the sales industry, etc. Showcasing this set of slides titled statistical analytics report showing evolution of sales industry diagrams pdf. The topics addressed in these templates are sales, technologies, system. All the content presented in this PPT design is completely editable. Download it and make adjustments in color, background, font etc. as per your unique business setting.
Integrating Company Service Management System Statistical Analysis Icon Elements PDF
This slide defines the enterprise service management software comparison. It includes information related to different softwareS and features available in the same. Showcasing this set of slides titled Integrating Company Service Management System Statistical Analysis Icon Elements PDF. The topics addressed in these templates are Automated Routing, Community Forums, Document Management. All the content presented in this PPT design is completely editable. Download it and make adjustments in color, background, font etc. as per your unique business setting.
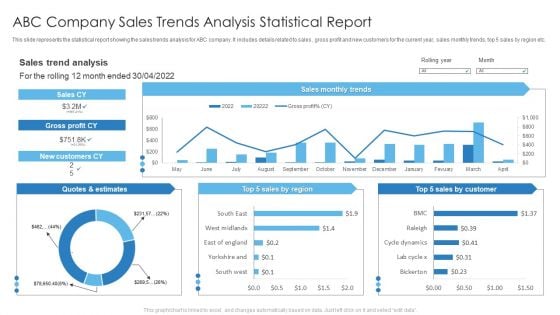
Abc Company Sales Trends Analysis Statistical Report Slides PDF
This slide represents the statistical report showing the sales trends analysis for ABC company. It includes details related to sales , gross profit and new customers for the current year, sales monthly trends, top 5 sales by region etc. Deliver an awe inspiring pitch with this creative Abc Company Sales Trends Analysis Statistical Report Slides PDF bundle. Topics like Abc Company Sales, Trends Analysis Statistical Report can be discussed with this completely editable template. It is available for immediate download depending on the needs and requirements of the user.

Statistic Graphic Money PowerPoint Backgrounds And Templates 1210
Microsoft PowerPoint Template and Background with statistic graphic with golden coins Ambiguity can be exasperating. Give definite answers with our Statistic Graphic Money PowerPoint Backgrounds And Templates 1210.
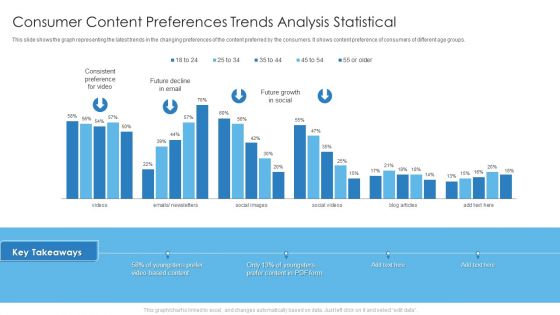
Consumer Content Preferences Trends Analysis Statistical Designs PDF
This slide shows the graph representing the latest trends in the changing preferences of the content preferred by the consumers. It shows content preference of consumers of different age groups. Deliver an awe inspiring pitch with this creative Consumer Content Preferences Trends Analysis Statistical Designs PDF bundle. Topics like Consumer Content Preferences, Trends Analysis Statistical can be discussed with this completely editable template. It is available for immediate download depending on the needs and requirements of the user.
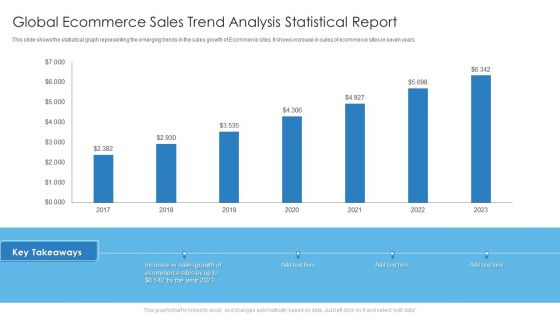
Global Ecommerce Sales Trend Analysis Statistical Report Mockup PDF
This slide shows the statistical graph representing the emerging trends in the sales growth of Ecommerce sites. It shows increase in sales of ecommerce sites in seven years. Deliver and pitch your topic in the best possible manner with this Global Ecommerce Sales Trend Analysis Statistical Report Mockup PDF. Use them to share invaluable insights on Sales Growth, Ecommerce Sites and impress your audience. This template can be altered and modified as per your expectations. So, grab it now.
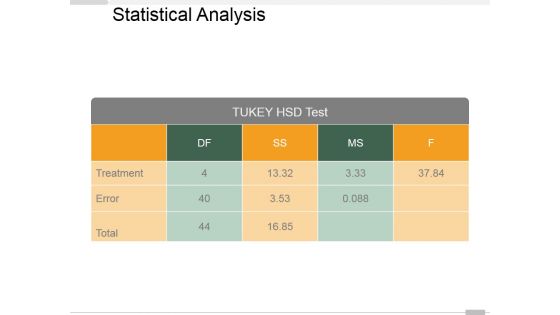
Statistical Analysis Template 1 Ppt PowerPoint Presentation Portfolio Layout Ideas
This is a statistical analysis template 1 ppt powerpoint presentation portfolio layout ideas. This is a four stage process. The stages in this process are treatment, error, total.
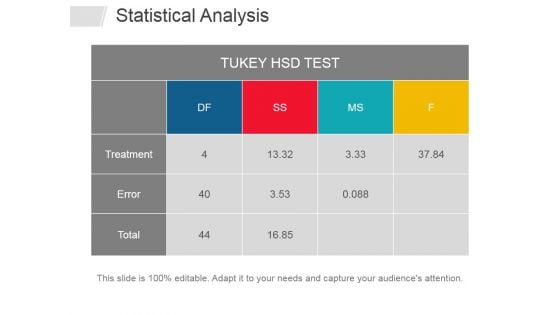
Statistical Analysis Template 2 Ppt PowerPoint Presentation File Files
This is a statistical analysis template 2 ppt powerpoint presentation file files. This is a four stage process. The stages in this process are error, total, treatment.
Statistical Data For Identity Fraud Reports Icons PDF
This slide showcases identity thefts and frauds complaints in various years. This template focuses on providing layers of protection to customers digital identities and reduce risk of financial loss. It includes information related to consumer complainants, etc. Showcasing this set of slides titled Statistical Data For Identity Fraud Reports Icons PDF. The topics addressed in these templates are Poor Management Information, Lack Of Transparency, Protected Accounts. All the content presented in this PPT design is completely editable. Download it and make adjustments in color, background, font etc. as per your unique business setting.

Medical Care Organization Management And Statistical Analysis Summary PDF
This slide covers the details related to the healthcare company. The purpose of this template is to define the fact sheet used in the healthcare industry. It covers information about mission, vision, key metrics, revenues, etc. Showcasing this set of slides titled Medical Care Organization Management And Statistical Analysis Summary PDF. The topics addressed in these templates are Executive, Chief Medical Officer, Management. All the content presented in this PPT design is completely editable. Download it and make adjustments in color, background, font etc. as per your unique business setting.
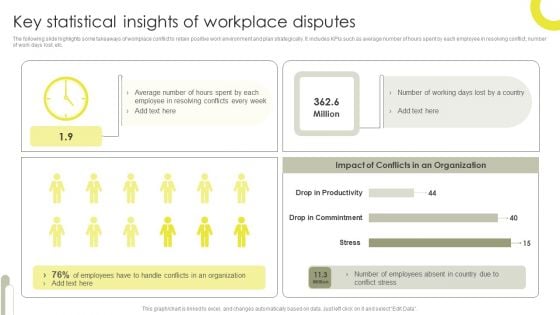
Key Statistical Insights Of Workplace Disputes Demonstration PDF
The following slide highlights some takeaways of workplace conflict to retain positive work environment and plan strategically. It includes KPIs such as average number of hours spent by each employee in resolving conflict, number of work days lost, etc. Showcasing this set of slides titled Key Statistical Insights Of Workplace Disputes Demonstration PDF. The topics addressed in these templates are Average, Employee, Organization. All the content presented in this PPT design is completely editable. Download it and make adjustments in color, background, font etc. as per your unique business setting.
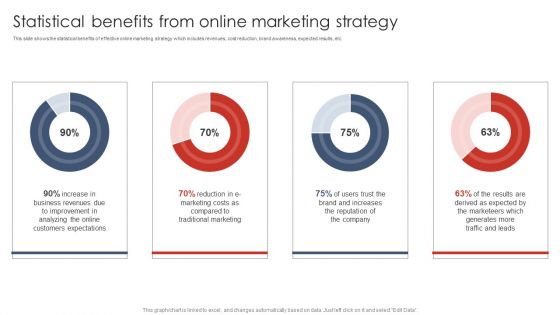
Statistical Benefits From Online Marketing Strategy Formats PDF
This slide shows the statistical benefits of effective online marketing strategy which includes revenues, cost reduction, brand awareness, expected results, etc.The best PPT templates are a great way to save time, energy, and resources. Slidegeeks have 100 precent editable powerpoint slides making them incredibly versatile. With these quality presentation templates, you can create a captivating and memorable presentation by combining visually appealing slides and effectively communicating your message. Download Statistical Benefits From Online Marketing Strategy Formats PDF from Slidegeeks and deliver a wonderful presentation.
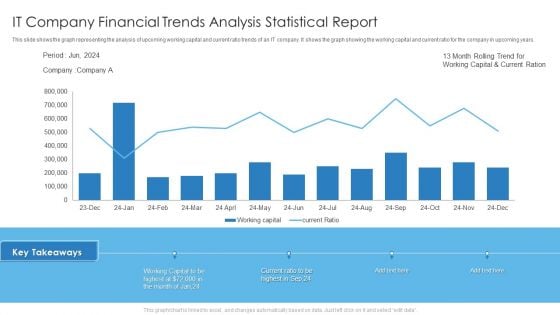
IT Company Financial Trends Analysis Statistical Report Slides PDF
This slide shows the graph representing the analysis of upcoming working capital and current ratio trends of an IT company. It shows the graph showing the working capital and current ratio for the company in upcoming years. Deliver and pitch your topic in the best possible manner with this IT Company Financial Trends Analysis Statistical Report Slides PDF. Use them to share invaluable insights on It Company Financial, Trends Analysis Statistical Report and impress your audience. This template can be altered and modified as per your expectations. So, grab it now.
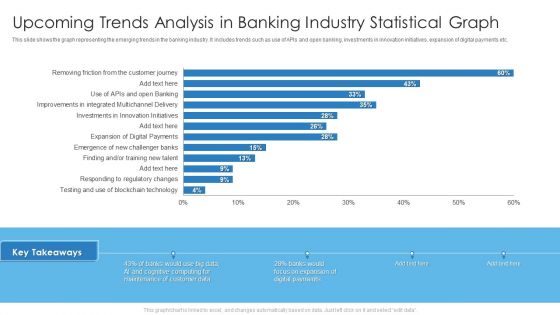
Upcoming Trends Analysis In Banking Industry Statistical Graph Brochure PDF
This slide shows the graph representing the emerging trends in the banking industry. It includes trends such as use of APIs and open banking, investments in innovation initiatives, expansion of digital payments etc. Deliver and pitch your topic in the best possible manner with this Upcoming Trends Analysis In Banking Industry Statistical Graph Brochure PDF. Use them to share invaluable insights on Upcoming Trends Analysis, Banking Industry Statistical Graph and impress your audience. This template can be altered and modified as per your expectations. So, grab it now.
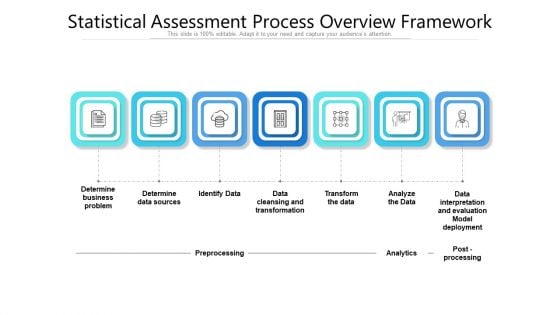
Statistical Assessment Process Overview Framework Ppt Layouts Graphics PDF
Presenting statistical assessment process overview framework ppt layouts graphics pdf to dispense important information. This template comprises seven stages. It also presents valuable insights into the topics including data sources, transform, business problem, data interpretation, analytics. This is a completely customizable PowerPoint theme that can be put to use immediately. So, download it and address the topic impactfully.
Statistical Statement Vector Icon Ppt PowerPoint Presentation Styles Graphics Pictures
Presenting this set of slides with name statistical statement vector icon ppt powerpoint presentation styles graphics pictures. This is a one stage process. The stages in this process are data report, infographics brochure, business statement. This is a completely editable PowerPoint presentation and is available for immediate download. Download now and impress your audience.
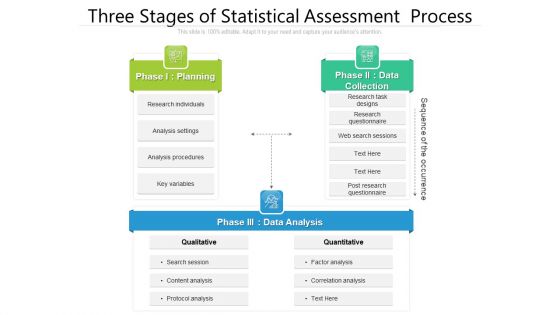
Three Stages Of Statistical Assessment Process Ppt Outline Shapes PDF
Pitch your topic with ease and precision using this three stages of statistical assessment process ppt outline shapes pdf. This layout presents information on planning, data collection, data analysis. It is also available for immediate download and adjustment. So, changes can be made in the color, design, graphics or any other component to create a unique layout.
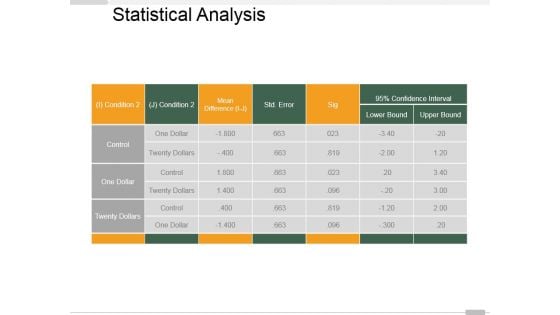
Statistical Analysis Template 2 Ppt PowerPoint Presentation Infographics Deck
This is a statistical analysis template 2 ppt powerpoint presentation infographics deck. This is a two stage process. The stages in this process are control, one dollar, twenty dollars, lower bound, upper bound.
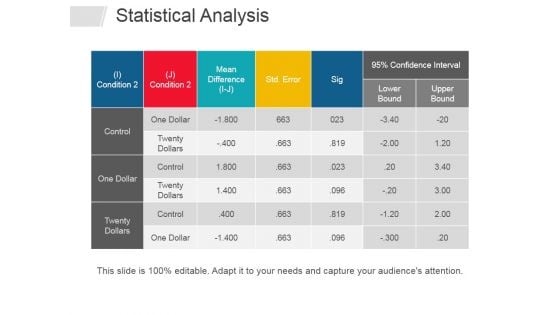
Statistical Analysis Template 1 Ppt PowerPoint Presentation Layouts Summary
This is a statistical analysis template 1 ppt powerpoint presentation layouts summary. This is a four stage process. The stages in this process are mean difference, lower bound, confidence interval, lower bound, upper bound.

Dollar Statistic Money PowerPoint Themes And PowerPoint Slides 0611
Microsoft PowerPoint Theme and Slide with 3d rendered illustration of a blue and red dollar statistic Get your audience familiar with your thoughts. Acclimatise them with our Dollar Statistic Money PowerPoint Themes And PowerPoint Slides 0611.
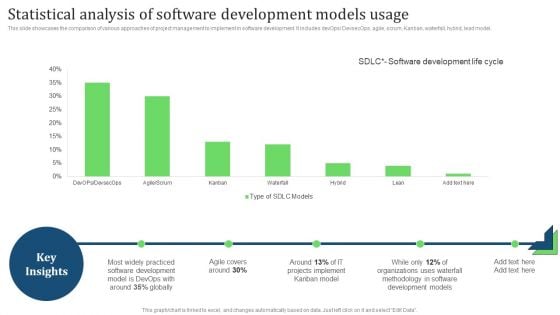
Statistical Analysis Of Software Development Models Usage Topics PDF
This slide showcases the comparison of various approaches of project management to implement in software development. It includes devOps DevsecOps, agile, scrum, Kanban, waterfall, hybrid, lead model. Find highly impressive Statistical Analysis Of Software Development Models Usage Topics PDF on Slidegeeks to deliver a meaningful presentation. You can save an ample amount of time using these presentation templates. No need to worry to prepare everything from scratch because Slidegeeks experts have already done a huge research and work for you. You need to download Statistical Analysis Of Software Development Models Usage Topics PDF for your upcoming presentation. All the presentation templates are 100 percent editable and you can change the color and personalize the content accordingly. Download now
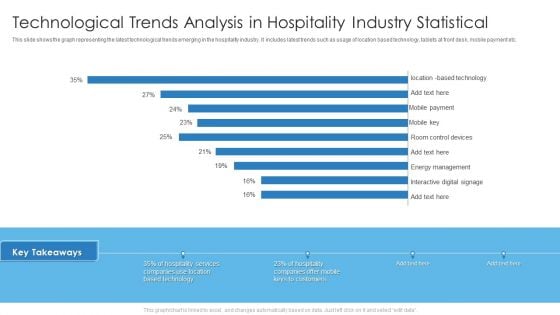
Technological Trends Analysis In Hospitality Industry Statistical Professional PDF
This slide shows the graph representing the latest technological trends emerging in the hospitality industry. It includes latest trends such as usage of location based technology, tablets at front desk, mobile payment etc. Deliver and pitch your topic in the best possible manner with this Technological Trends Analysis In Hospitality Industry Statistical Professional PDF. Use them to share invaluable insights on Technology, Location, Services and impress your audience. This template can be altered and modified as per your expectations. So, grab it now.
Statistical Modeling Project Ppt Powerpoint Presentation Complete Deck With Slides
This Statistical Modeling Project Ppt Powerpoint Presentation Complete Deck With Slides acts as backup support for your ideas, vision, thoughts, etc. Use it to present a thorough understanding of the topic. This PPT slideshow can be utilized for both in-house and outside presentations depending upon your needs and business demands. Entailing eighteen slides with a consistent design and theme, this template will make a solid use case. As it is intuitively designed, it suits every business vertical and industry. All you have to do is make a few tweaks in the content or any other component to design unique presentations. The biggest advantage of this complete deck is that it can be personalized multiple times once downloaded. The color, design, shapes, and other elements are free to modify to add personal touches. You can also insert your logo design in this PPT layout. Therefore a well-thought and crafted presentation can be delivered with ease and precision by downloading this Statistical Modeling Project Ppt Powerpoint Presentation Complete Deck With Slides PPT slideshow. Our Statistical Modeling Project Ppt Powerpoint Presentation Complete Deck With Slides are topically designed to provide an attractive backdrop to any subject. Use them to look like a presentation pro.
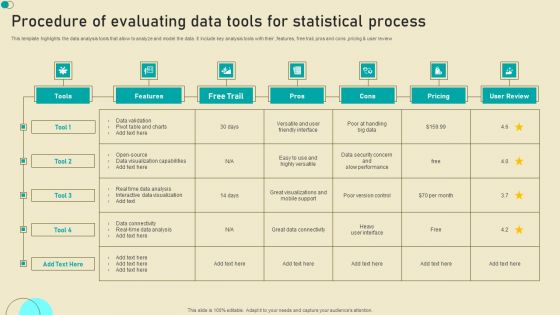
Procedure Of Evaluating Data Tools For Statistical Process Professional PDF
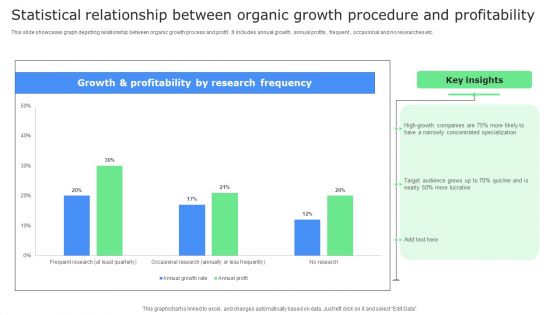
Statistical Relationship Between Organic Growth Procedure And Profitability Rules PDF
This slide showcases graph depicting relationship between organic growth process and profit . It includes annual growth , annual profits , frequent , occasional and no researches etc. Pitch your topic with ease and precision using this Statistical Relationship Between Organic Growth Procedure And Profitability Rules PDF. This layout presents information on Key Insights, Frequency, Profitability. It is also available for immediate download and adjustment. So, changes can be made in the color, design, graphics or any other component to create a unique layout.
Staff Productivity And Attrition Tracking Rate Statistical Report Ideas PDF
This slide covers dashboard for employees productivity stats. It further includes stats for absence rates, cost incurred, benefits derived, satisfaction index, net promoter score, turnover and promotion rates. Pitch your topic with ease and precision using this Staff Productivity And Attrition Tracking Rate Statistical Report Ideas PDF. This layout presents information on Absence Cost, Benefits Satisfaction, Productivity Rate. It is also available for immediate download and adjustment. So, changes can be made in the color, design, graphics or any other component to create a unique layout.
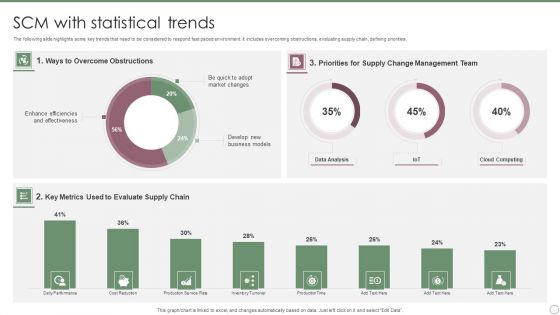
SCM With Statistical Trends Ppt PowerPoint Presentation Gallery Examples PDF
The following slide highlights some key trends that need to be considered to respond fast paced environment. It includes overcoming obstructions, evaluating supply chain, defining priorities. Pitch your topic with ease and precision using this SCM With Statistical Trends Ppt PowerPoint Presentation Gallery Examples PDF. This layout presents information on Ways To Overcome, Obstructions, Key Metrics, Evaluate Supply Chain. It is also available for immediate download and adjustment. So, changes can be made in the color, design, graphics or any other component to create a unique layout.
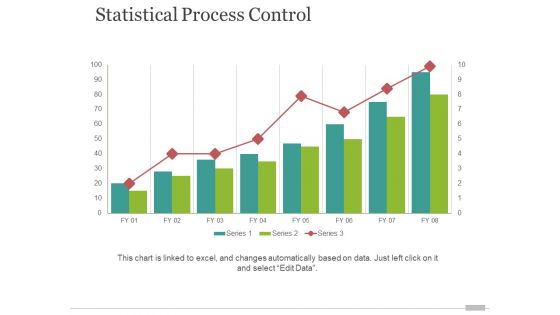
statistical process control ppt powerpoint presentation inspiration layouts
This is a statistical process control ppt powerpoint presentation inspiration layouts. This is a eight stage process. The stages in this process are business, marketing, strategy, growth.
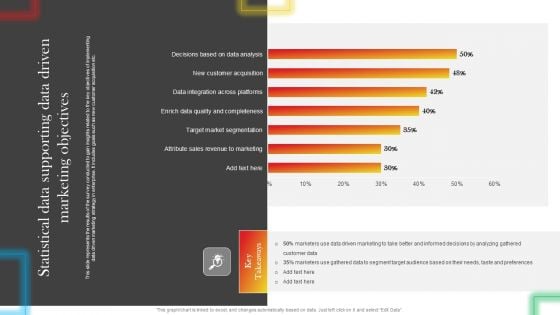
Statistical Data Supporting Data Driven Marketing Objectives Summary PDF
This slide represents the results of the survey conducted to gain insights related to the key objectives of implementing data driven marketing strategy in enterprise. It includes goals such as new customer acquisition etc. Are you in need of a template that can accommodate all of your creative concepts This one is crafted professionally and can be altered to fit any style. Use it with Google Slides or PowerPoint. Include striking photographs, symbols, depictions, and other visuals. Fill, move around, or remove text boxes as desired. Test out color palettes and font mixtures. Edit and save your work, or work with colleagues. Download Statistical Data Supporting Data Driven Marketing Objectives Summary PDF and observe how to make your presentation outstanding. Give an impeccable presentation to your group and make your presentation unforgettable.

Statistical Data Ppt PowerPoint Presentation Complete Deck With Slides
Boost your confidence and team morale with this well-structured statistical data ppt powerpoint presentation complete deck with slides. This prefabricated set gives a voice to your presentation because of its well-researched content and graphics. Our experts have added all the components very carefully, thus helping you deliver great presentations with a single click. Not only that, it contains a set of twelve slides that are designed using the right visuals, graphics, etc. Various topics can be discussed, and effective brainstorming sessions can be conducted using the wide variety of slides added in this complete deck. Apart from this, our PPT design contains clear instructions to help you restructure your presentations and create multiple variations. The color, format, design anything can be modified as deemed fit by the user. Not only this, it is available for immediate download. So, grab it now.
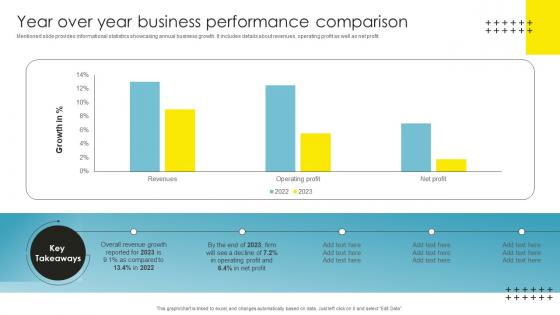
Strategic Brand Management Year Over Year Business Performance Brochure Pdf
Mentioned slide provides informational statistics showcasing annual business growth. It includes details about revenues, operating profit as well as net profit. Slidegeeks is here to make your presentations a breeze with Strategic Brand Management Year Over Year Business Performance Brochure Pdf With our easy to use and customizable templates, you can focus on delivering your ideas rather than worrying about formatting. With a variety of designs to choose from, you are sure to find one that suits your needs. And with animations and unique photos, illustrations, and fonts, you can make your presentation pop. So whether you are giving a sales pitch or presenting to the board, make sure to check out Slidegeeks first. Mentioned slide provides informational statistics showcasing annual business growth. It includes details about revenues, operating profit as well as net profit.
Employee Attrition Tracking Statistical Report Icon Download PDF
Persuade your audience using this Employee Attrition Tracking Statistical Report Icon Download PDF. This PPT design covers four stages, thus making it a great tool to use. It also caters to a variety of topics including Employee Attrition Tracking, Statistical Report Icon. Download this PPT design now to present a convincing pitch that not only emphasizes the topic but also showcases your presentation skills.
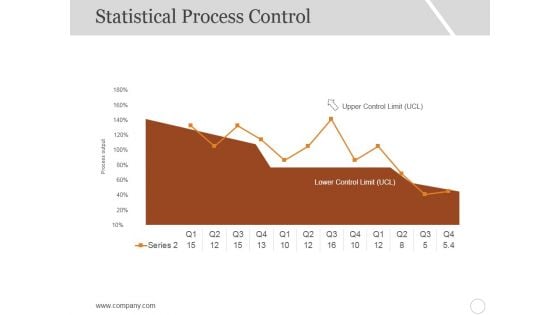
Statistical Process Control Ppt PowerPoint Presentation Portfolio Design Ideas
This is a statistical process control ppt powerpoint presentation portfolio design ideas. This is a one stage process. The stages in this process are process output, upper control limit, series, business, marketing.
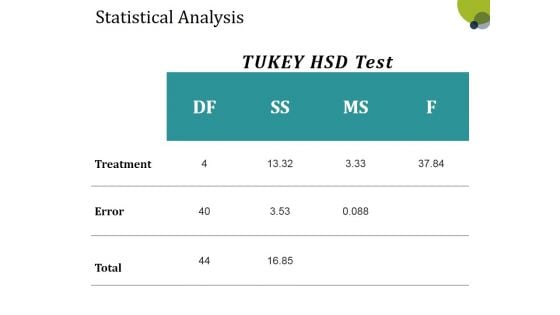
Statistical Analysis Template 2 Ppt PowerPoint Presentation Summary Visuals
This is a statistical analysis template 2 ppt powerpoint presentation summary visuals. This is a three stage process. The stages in this process are treatment, error, total, business, table.
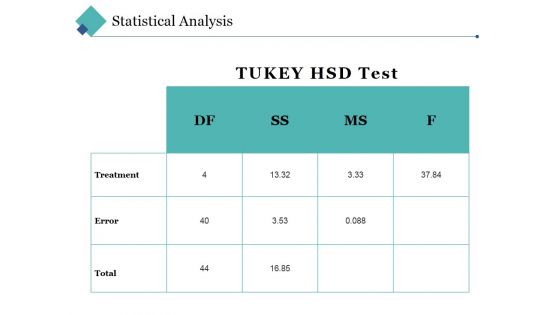
Statistical Analysis Template 2 Ppt PowerPoint Presentation Layouts Background Image
This is a statistical analysis template 2 ppt powerpoint presentation layouts background image. This is a three stage process. The stages in this process are treatment, error, total, table, business.
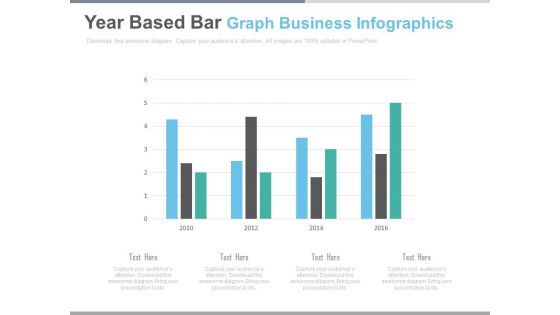
Bar Graph For Yearly Statistical Analysis Powerpoint Slides
This PowerPoint template has been designed with bar graph. This PowerPoint diagram is useful to exhibit yearly statistical analysis. This diagram slide can be used to make impressive presentations.
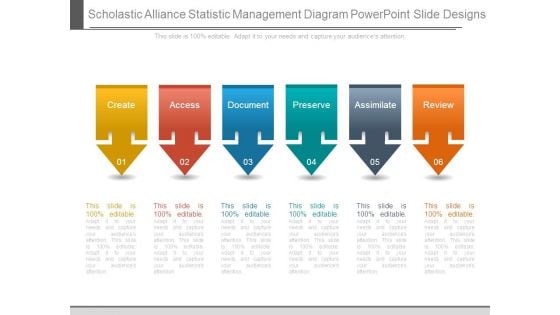
Scholastic Alliance Statistic Management Diagram Powerpoint Slide Designs
This is a scholastic alliance statistic management diagram powerpoint slide designs. This is a six stage process. The stages in this process are create, access, document, preserve, assimilate, review.
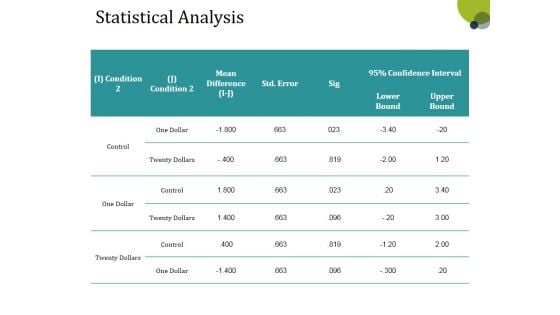
Statistical Analysis Template 1 Ppt PowerPoint Presentation Infographics Show
This is a statistical analysis template 1 ppt powerpoint presentation infographics show. This is a three stage process. The stages in this process are one dollar, control, condition, lower bound, upper bound.
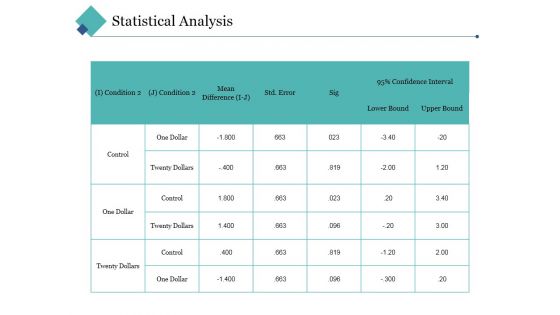
Statistical Analysis Template 1 Ppt PowerPoint Presentation Styles Inspiration
This is a statistical analysis template 1 ppt powerpoint presentation styles inspiration. This is a three stage process. The stages in this process are control, condition, mean difference, lower bound, upper bound.
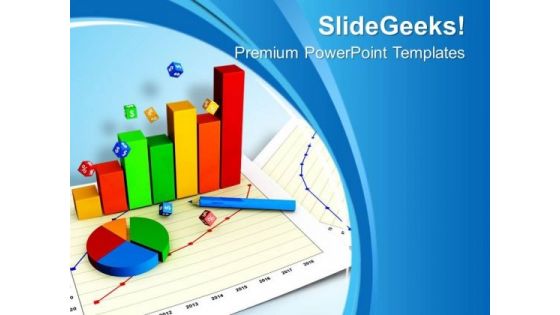
Statistical Graph Illustration PowerPoint Templates Ppt Backgrounds For Slides 0713
Draw away from doubts with our Statistical Graph Illustration PowerPoint Templates PPT Backgrounds For Slides 0713. Connect your thoughts to the positives. Attract a crowd with our Pie charts PowerPoint Templates. They will drop it all and come to hear you. They will come in droves to hear your views. Our Sales PowerPoint Templates will have them dripping excitement. Manage growth with our Statistical Graph Illustration PowerPoint Templates Ppt Backgrounds For Slides 0713. Download without worries with our money back guaranteee.
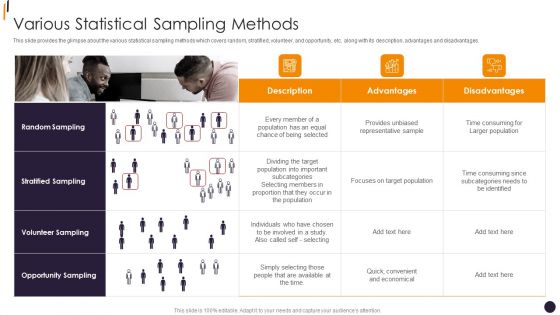
PMP Tools Various Statistical Sampling Methods Microsoft PDF
his slide provides the glimpse about the various statistical sampling methods which covers random, stratified, volunteer, and opportunity, etc. along with its description, advantages and disadvantages.This is a PMP Tools Various Statistical Sampling Methods Microsoft PDF template with various stages. Focus and dispense information on one stage using this creative set, that comes with editable features. It contains large content boxes to add your information on topics like Random Sampling, Volunteer Sampling, Opportunity Sampling You can also showcase facts, figures, and other relevant content using this PPT layout. Grab it now.
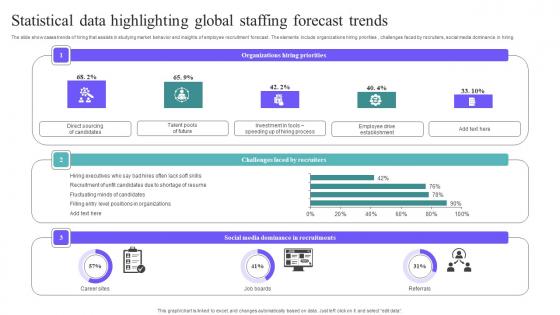
Statistical Data Highlighting Global Staffing Forecast Trends Template Pdf
The slide showcases trends of hiring that assists in studying market behavior and insights of employee recruitment forecast . The elements include organizations hiring priorities , challenges faced by recruiters, social media dominance in hiring. Showcasing this set of slides titled Statistical Data Highlighting Global Staffing Forecast Trends Template Pdf. The topics addressed in these templates are Hiring Executives, Fluctuating Minds, Filling Entry Level Positions. All the content presented in this PPT design is completely editable. Download it and make adjustments in color, background, font etc. as per your unique business setting. The slide showcases trends of hiring that assists in studying market behavior and insights of employee recruitment forecast . The elements include organizations hiring priorities , challenges faced by recruiters, social media dominance in hiring.
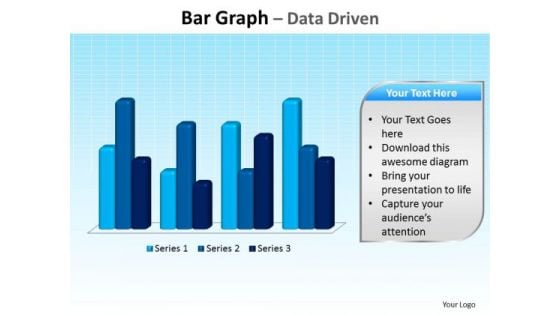
Business Education PowerPoint Templates Business Bar Graph Data Driven Ppt Slides
Business Education PowerPoint Templates Business bar graph data driven PPT Slides-This PowerPoint slide is a data driven Columns Chart. The number of columns depend on the data.-Business Editable PowerPoint Templates Business beveled column chart PPT Slides-This ppt can be used for concepts relating to-chart,, graph, growth, investment, , market, percentage, , presentation report, results, statistics, stock, success and business. Our Business Education PowerPoint Templates Business Bar Graph Data Driven Ppt Slides keep the faith alive. Belief in you will get stronger.
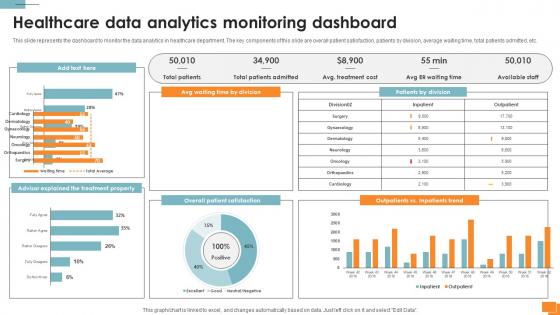
Statistical Tools For Evidence Healthcare Data Analytics Monitoring Dashboard
This slide represents the dashboard to monitor the data analytics in healthcare department. The key components of this slide are overall patient satisfaction, patients by division, average waiting time, total patients admitted, etc. Welcome to our selection of the Statistical Tools For Evidence Healthcare Data Analytics Monitoring Dashboard. These are designed to help you showcase your creativity and bring your sphere to life. Planning and Innovation are essential for any business that is just starting out. This collection contains the designs that you need for your everyday presentations. All of our PowerPoints are 100Percent editable, so you can customize them to suit your needs. This multi-purpose template can be used in various situations. Grab these presentation templates today. This slide represents the dashboard to monitor the data analytics in healthcare department. The key components of this slide are overall patient satisfaction, patients by division, average waiting time, total patients admitted, etc.
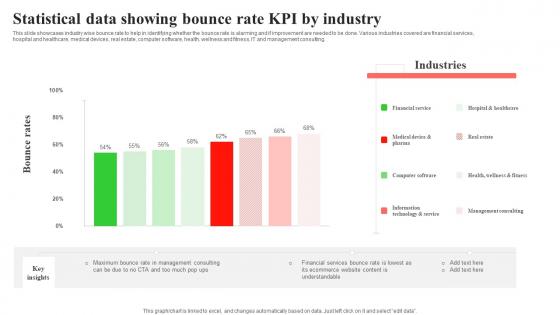
Statistical Data Showing Bounce Rate KPI By Industry Ideas Pdf
This slide showcases industry wise bounce rate to help in identifying whether the bounce rate is alarming and if improvement are needed to be done. Various industries covered are financial services, hospital and healthcare, medical devices, real estate, computer software, health, wellness and fitness, IT and management consulting. Showcasing this set of slides titled Statistical Data Showing Bounce Rate KPI By Industry Ideas Pdf. The topics addressed in these templates are Financial Services, Hospital And Healthcare, Medical Devices. All the content presented in this PPT design is completely editable. Download it and make adjustments in color, background, font etc. as per your unique business setting. This slide showcases industry wise bounce rate to help in identifying whether the bounce rate is alarming and if improvement are needed to be done. Various industries covered are financial services, hospital and healthcare, medical devices, real estate, computer software, health, wellness and fitness, IT and management consulting.
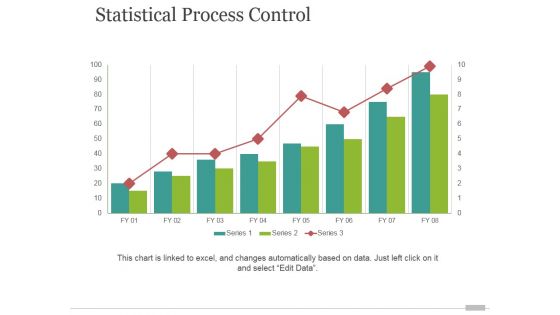
Statistical Process Control Ppt PowerPoint Presentation Designs Download
This is a statistical process control ppt powerpoint presentation designs download. This is a eight stage process. The stages in this process are finance, process, business, marketing, management.
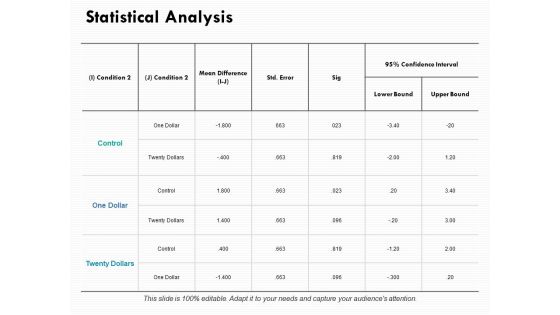
Statistical Analysis Slide Ppt PowerPoint Presentation Outline Themes
This is a statistical analysis slide ppt powerpoint presentation outline themes. This is a five stage process. The stages in this process are business, management, marketing.
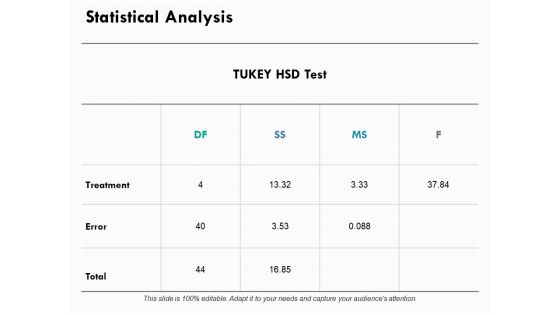
Statistical Analysis Ppt PowerPoint Presentation File Background Images
This is a statistical analysis ppt powerpoint presentation file background images. This is a six stage process. The stages in this process are business, management, marketing.
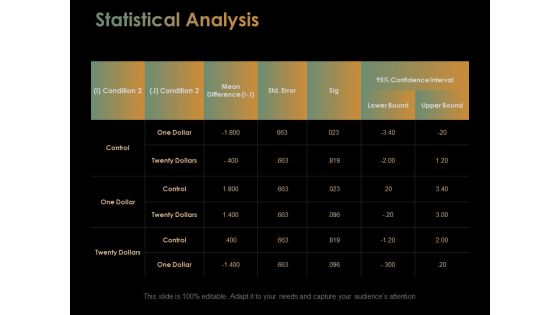
Statistical Analysis Slide Ppt PowerPoint Presentation Slides Templates
This is a statistical analysis slide ppt powerpoint presentation slides templates. This is a four stage process. The stages in this process are business, management, marketing.

Statistical Analysis Slide Ppt PowerPoint Presentation Inspiration Graphics
This is a statistical analysis slide ppt powerpoint presentation inspiration graphics. This is a four stage process. The stages in this process are marketing, business, management, compare.

Statistical Analysis Ppt PowerPoint Presentation Styles Graphics Design
This is a statistical analysis ppt powerpoint presentation styles graphics design. This is a six stage process. The stages in this process are marketing, business, management, compare.
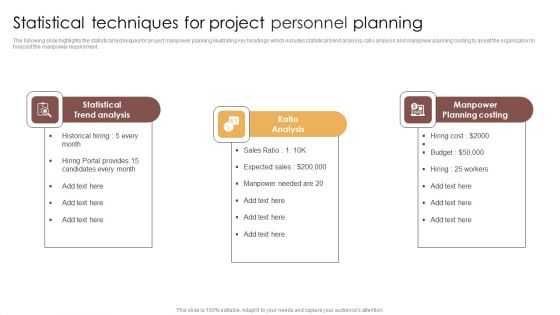
Statistical Techniques For Project Personnel Planning Pictures PDF
The following slide highlights the statistical techniques for project manpower planning illustrating key headings which includes statistical trend analysis, ratio analysis and manpower planning costing to assist the organization to forecast the manpower requirement. Presenting Statistical Techniques For Project Personnel Planning Pictures PDF to dispense important information. This template comprises three stages. It also presents valuable insights into the topics including Statistical Trend Analysis, Ratio Analysis, Manpower Planning Costing. This is a completely customizable PowerPoint theme that can be put to use immediately. So, download it and address the topic impactfully.
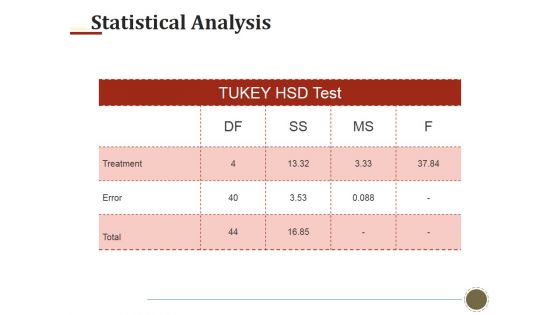
Statistical Analysis Template 1 Ppt PowerPoint Presentation Outline Show
This is a statistical analysis template 1 ppt powerpoint presentation outline show. This is a four stage process. The stages in this process are treatment, error, total.
Statistical Data Graph Icon Showing Financial Forecast Rules PDF
Presenting statistical data graph icon showing financial forecast rules pdf to dispense important information. This template comprises four stages. It also presents valuable insights into the topics including statistical data graph icon showing financial forecast. This is a completely customizable PowerPoint theme that can be put to use immediately. So, download it and address the topic impactfully.
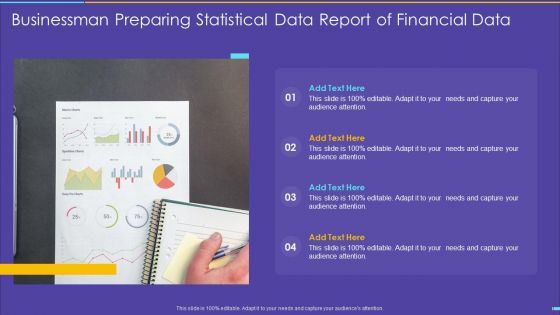
Businessman Preparing Statistical Data Report Of Financial Data Brochure PDF
Presenting businessman preparing statistical data report of financial data brochure pdf to dispense important information. This template comprises four stages. It also presents valuable insights into the topics including businessman preparing statistical data report of financial data. This is a completely customizable PowerPoint theme that can be put to use immediately. So, download it and address the topic impactfully.

Statistical Data Analysis Chart Of Collected Data Formats PDF
Presenting statistical data analysis chart of collected data formats pdf to dispense important information. This template comprises four stages. It also presents valuable insights into the topics including statistical data analysis chart of collected data. This is a completely customizable PowerPoint theme that can be put to use immediately. So, download it and address the topic impactfully.
Social Platforms Data Analysis Marketing Statistical Data Icon Ideas PDF
Presenting Social Platforms Data Analysis Marketing Statistical Data Icon Ideas PDF to dispense important information. This template comprises three stages. It also presents valuable insights into the topics including Social Platforms Data Analysis, Marketing Statistical Data Icon. This is a completely customizable PowerPoint theme that can be put to use immediately. So, download it and address the topic impactfully.
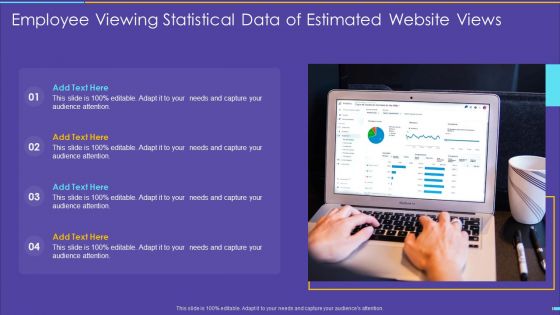
Employee Viewing Statistical Data Of Estimated Website Views Background PDF
Presenting employee viewing statistical data of estimated website views background pdf to dispense important information. This template comprises four stages. It also presents valuable insights into the topics including employee viewing statistical data of estimated website views. This is a completely customizable PowerPoint theme that can be put to use immediately. So, download it and address the topic impactfully.
Statistical Data Icon Depicting Investment Marketing Information PDF
Persuade your audience using this statistical data icon depicting investment marketing information pdf. This PPT design covers four stages, thus making it a great tool to use. It also caters to a variety of topics including statistical data icon depicting investment marketing. Download this PPT design now to present a convincing pitch that not only emphasizes the topic but also showcases your presentation skills.


 Continue with Email

 Home
Home


