Business Statistics
Social Media Marketing Statistical Data Icon Download PDF
Persuade your audience using this Social Media Marketing Statistical Data Icon Download PDF. This PPT design covers three stages, thus making it a great tool to use. It also caters to a variety of topics including Social Media Marketing, Statistical Data Icon. Download this PPT design now to present a convincing pitch that not only emphasizes the topic but also showcases your presentation skills.
Statistical Analysis Ppt PowerPoint Presentation Styles Visual Aids Cpb
Presenting this set of slides with name statistical analysis ppt powerpoint presentation styles visual aids cpb. This is a four stage process. The stages in this process are statistical analysis. This is a completely editable PowerPoint presentation and is available for immediate download. Download now and impress your audience.

Predictive Statistical Models Ppt PowerPoint Presentation File Background Image Cpb
Presenting this set of slides with name predictive statistical models ppt powerpoint presentation file background image cpb. This is a three stage process. The stages in this process are predictive statistical models. This is a completely editable PowerPoint presentation and is available for immediate download. Download now and impress your audience.
Statistical Analysis Vector Icon Ppt PowerPoint Presentation Show Example
Presenting this set of slides with name statistical analysis vector icon ppt powerpoint presentation show example. This is a three stage process. The stages in this process are statistical analysis vector icon. This is a completely editable PowerPoint presentation and is available for immediate download. Download now and impress your audience.
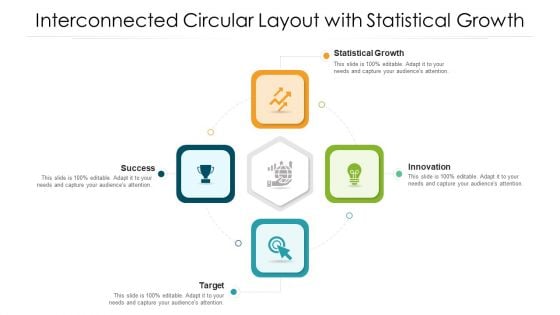
Interconnected Circular Layout With Statistical Growth Ppt Layouts PDF
Persuade your audience using this interconnected circular layout with statistical growth ppt layouts pdf. This PPT design covers four stages, thus making it a great tool to use. It also caters to a variety of topics including innovation, success, target, statistical growth. Download this PPT design now to present a convincing pitch that not only emphasizes the topic but also showcases your presentation skills.
Icon Of Statistical Chart Presenting Growth Trend Graph Brochure PDF
Presenting Icon Of Statistical Chart Presenting Growth Trend Graph Brochure PDF to dispense important information. This template comprises Four stages. It also presents valuable insights into the topics including Icon Of Statistical, Chart Presenting, Growth Trend This is a completely customizable PowerPoint theme that can be put to use immediately. So, download it and address the topic impactfully.
Customer Attrition Tracking Statistical Report Icon Themes PDF
Presenting Customer Attrition Tracking Statistical Report Icon Themes PDF to dispense important information. This template comprises four stages. It also presents valuable insights into the topics including Customer Attrition Tracking, Statistical Report Icon. This is a completely customizable PowerPoint theme that can be put to use immediately. So, download it and address the topic impactfully.
Statistical Analysis Employees Coaching Program Icon Clipart PDF
Presenting Statistical Analysis Employees Coaching Program Icon Clipart PDF to dispense important information. This template comprises three stages. It also presents valuable insights into the topics including Statistical Analysis, Employees Coaching, Program Icon. This is a completely customizable PowerPoint theme that can be put to use immediately. So, download it and address the topic impactfully.
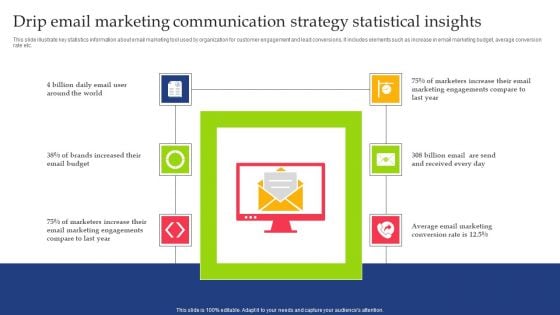
Drip Email Marketing Communication Strategy Statistical Insights Diagrams PDF
Persuade your audience using this Drip Email Marketing Communication Strategy Statistical Insights Diagrams PDF. This PPT design covers Six stages, thus making it a great tool to use. It also caters to a variety of topics including Communication Strategy, Statistical Insight. Download this PPT design now to present a convincing pitch that not only emphasizes the topic but also showcases your presentation skills.
Statistical Data Dashboard Icon Depicting Analytical Figures Sample PDF
Persuade your audience using this statistical data dashboard icon depicting analytical figures sample pdf. This PPT design covers four stages, thus making it a great tool to use. It also caters to a variety of topics including statistical data dashboard icon depicting analytical figures. Download this PPT design now to present a convincing pitch that not only emphasizes the topic but also showcases your presentation skills.
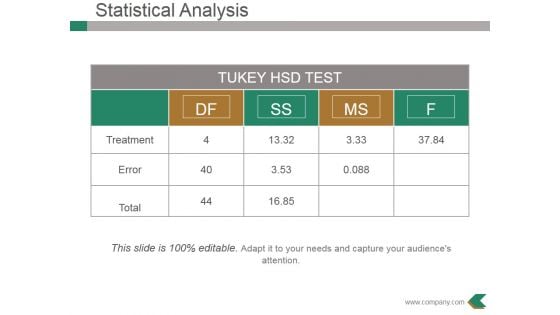
Statistical Analysis Template 2 Ppt PowerPoint Presentation Gallery Designs
This is a statistical analysis template 2 ppt powerpoint presentation gallery designs. This is a four stage process. The stages in this process are treatment, error, total, table, business.
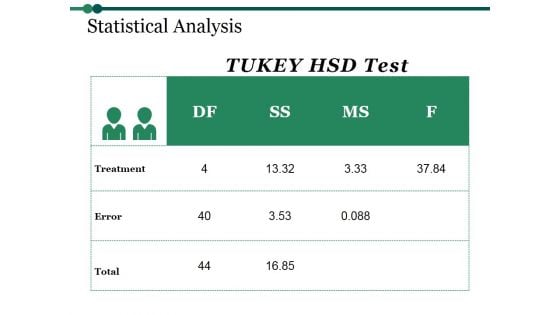
Statistical Analysis Template 1 Ppt PowerPoint Presentation Outline Professional
This is a statistical analysis template 1 ppt powerpoint presentation outline professional. This is a four stage process. The stages in this process are treatment, table, management, business, planning.

Statistical Analysis Template 2 Ppt PowerPoint Presentation Summary Ideas
This is a statistical analysis template 2 ppt powerpoint presentation summary ideas. This is a two stage process. The stages in this process are business, table, analysis, management, success.
Corporate Man Preparing Presentation Icon Using Statistical Data Topics PDF
Persuade your audience using this Corporate Man Preparing Presentation Icon Using Statistical Data Topics PDF. This PPT design covers three stages, thus making it a great tool to use. It also caters to a variety of topics including Corporate Man, Preparing Presentation, Statistical Data. Download this PPT design now to present a convincing pitch that not only emphasizes the topic but also showcases your presentation skills.
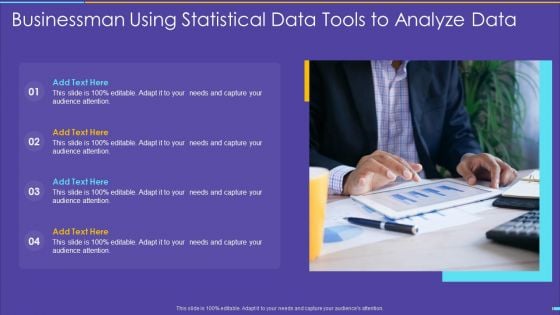
Businessman Using Statistical Data Tools To Analyze Data Designs PDF
Persuade your audience using this businessman using statistical data tools to analyze data designs pdf. This PPT design covers four stages, thus making it a great tool to use. It also caters to a variety of topics including businessman using statistical data tools to analyze data. Download this PPT design now to present a convincing pitch that not only emphasizes the topic but also showcases your presentation skills.
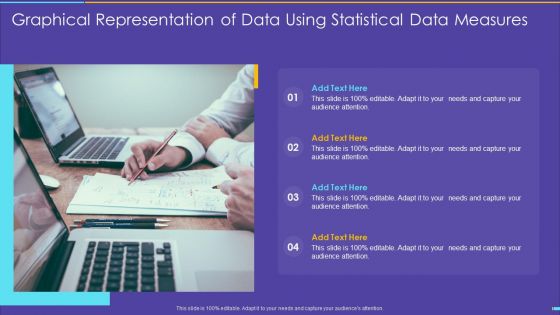
Graphical Representation Of Data Using Statistical Data Measures Elements PDF
Persuade your audience using this graphical representation of data using statistical data measures elements pdf. This PPT design covers four stages, thus making it a great tool to use. It also caters to a variety of topics including graphical representation of data using statistical data measures. Download this PPT design now to present a convincing pitch that not only emphasizes the topic but also showcases your presentation skills.
Statistical Analysis Procedure To Identify Problem Icon Guidelines PDF
Persuade your audience using this Statistical Analysis Procedure To Identify Problem Icon Guidelines PDF. This PPT design covers three stages, thus making it a great tool to use. It also caters to a variety of topics including Statistical Analysis Procedure, Identify Problem Icon. Download this PPT design now to present a convincing pitch that not only emphasizes the topic but also showcases your presentation skills.

statistical forecasting ppt powerpoint presentation infographic template deck cpb
Presenting this set of slides with name statistical forecasting ppt powerpoint presentation infographic template deck cpb. This is an editable Powerpoint four stages graphic that deals with topics like statistical forecasting to help convey your message better graphically. This product is a premium product available for immediate download and is 100 percent editable in Powerpoint. Download this now and use it in your presentations to impress your audience.
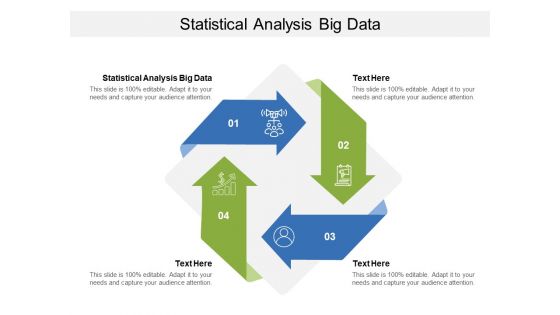
Statistical Analysis Big Data Ppt PowerPoint Presentation Ideas Diagrams Cpb
Presenting this set of slides with name statistical analysis big data ppt powerpoint presentation ideas diagrams cpb. This is an editable Powerpoint four stages graphic that deals with topics like statistical analysis big data to help convey your message better graphically. This product is a premium product available for immediate download and is 100 percent editable in Powerpoint. Download this now and use it in your presentations to impress your audience.
Data Driven Organizational Culture Icon Depicting Statistical Analysis Sample PDF
Persuade your audience using this data driven organizational culture icon depicting statistical analysis sample pdf. This PPT design covers three stages, thus making it a great tool to use. It also caters to a variety of topics including data driven organizational culture icon depicting statistical analysis. Download this PPT design now to present a convincing pitch that not only emphasizes the topic but also showcases your presentation skills.
Statistical Data Showing Sales Strategy Framework Icon Clipart PDF
Persuade your audience using this Statistical Data Showing Sales Strategy Framework Icon Clipart PDF. This PPT design covers three stages, thus making it a great tool to use. It also caters to a variety of topics including Statistical Data, Showing Sales Strategy, Framework Icon. Download this PPT design now to present a convincing pitch that not only emphasizes the topic but also showcases your presentation skills.
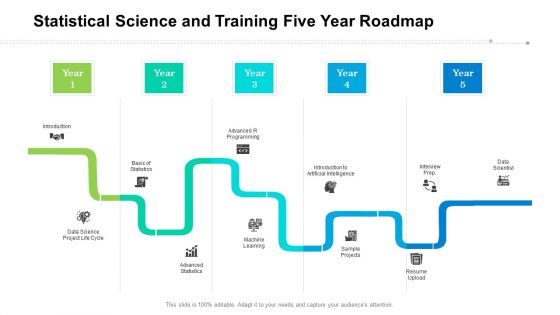
Statistical Science And Training Five Year Roadmap Structure
We present our statistical science and training five year roadmap structure. This PowerPoint layout is easy to edit so you can change the font size, font type, color, and shape conveniently. In addition to this, the PowerPoint layout is Google Slides compatible, so you can share it with your audience and give them access to edit it. Therefore, download and save this well researched statistical science and training five year roadmap structure in different formats like PDF, PNG, and JPG to smoothly execute your business plan.
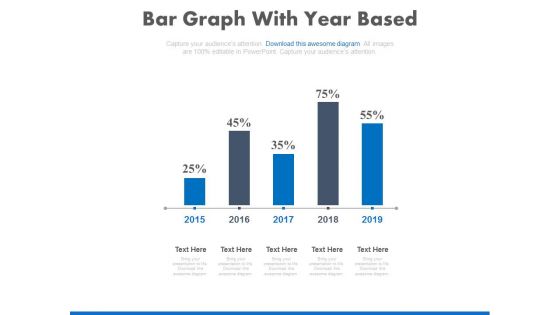
Bar Graph With Yearly Statistical Analysis Powerpoint Slides
This PowerPoint template contains diagram of bar graph with yearly percentage ratios. You may download this slide to display statistical analysis. You can easily customize this template to make it more unique as per your need.

Statistical Analysis Template 1 Ppt PowerPoint Presentation Layouts Tips
This is a statistical analysis template 1 ppt powerpoint presentation layouts tips. This is a six stage process. The stages in this process are control, condition, mean difference, lower bound, upper bound.
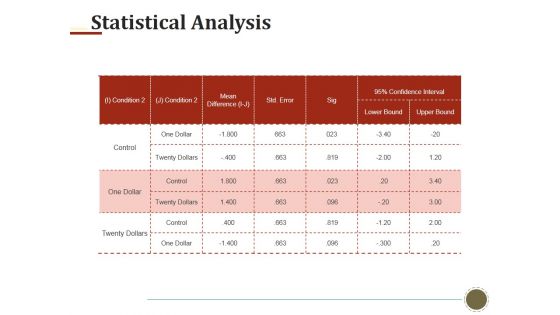
Statistical Analysis Template 2 Ppt PowerPoint Presentation Show Templates
This is a statistical analysis template 2 ppt powerpoint presentation show templates. This is a two stage process. The stages in this process are control, one dollar, lower bound, upper bound.
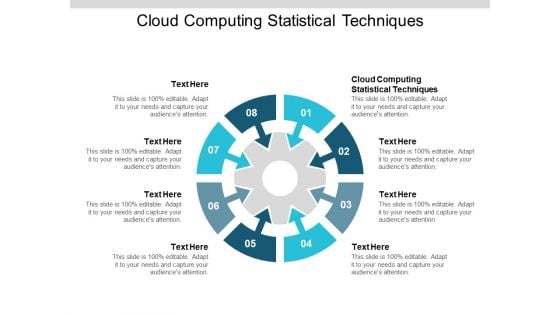
Cloud Computing Statistical Techniques Ppt PowerPoint Presentation Information Cpb
Presenting this set of slides with name cloud computing statistical techniques ppt powerpoint presentation information cpb. This is an editable Powerpoint eight stages graphic that deals with topics like cloud computing statistical techniques to help convey your message better graphically. This product is a premium product available for immediate download and is 100 percent editable in Powerpoint. Download this now and use it in your presentations to impress your audience.
Portfolio Statistical Measures Ppt PowerPoint Presentation Inspiration Ideas Cpb
Presenting this set of slides with name portfolio statistical measures ppt powerpoint presentation inspiration ideas cpb. This is an editable Powerpoint four stages graphic that deals with topics like portfolio statistical measures to help convey your message better graphically. This product is a premium product available for immediate download and is 100 percent editable in Powerpoint. Download this now and use it in your presentations to impress your audience.
Statistical Predictive Modelling Techniques Ppt PowerPoint Presentation Gallery Themes Cpb
Presenting this set of slides with name statistical predictive modelling techniques ppt powerpoint presentation gallery themes cpb. This is an editable Powerpoint five stages graphic that deals with topics like statistical predictive modelling techniques to help convey your message better graphically. This product is a premium product available for immediate download and is 100 percent editable in Powerpoint. Download this now and use it in your presentations to impress your audience.
Statistical Process Quality Control Ppt PowerPoint Presentation Introduction Cpb
Presenting this set of slides with name statistical process quality control ppt powerpoint presentation introduction cpb. This is an editable Powerpoint three stages graphic that deals with topics like statistical process quality control to help convey your message better graphically. This product is a premium product available for immediate download and is 100 percent editable in Powerpoint. Download this now and use it in your presentations to impress your audience.
Statistical Analysis Application Ppt PowerPoint Presentation Visual Aids Icon Cpb
Presenting this set of slides with name statistical analysis application ppt powerpoint presentation visual aids icon cpb. This is an editable Powerpoint three stages graphic that deals with topics like statistical analysis application to help convey your message better graphically. This product is a premium product available for immediate download and is 100 percent editable in Powerpoint. Download this now and use it in your presentations to impress your audience.
Statistical Hypothesis Testing Ppt PowerPoint Presentation Slides Aids Cpb
Presenting this set of slides with name statistical hypothesis testing ppt powerpoint presentation slides aids cpb. This is an editable Powerpoint one stages graphic that deals with topics like statistical hypothesis testing to help convey your message better graphically. This product is a premium product available for immediate download and is 100 percent editable in Powerpoint. Download this now and use it in your presentations to impress your audience.
Statistical Modelling Ppt PowerPoint Presentation Icon Designs Cpb
Presenting this set of slides with name statistical modelling ppt powerpoint presentation icon designs cpb. This is an editable Powerpoint three stages graphic that deals with topics like statistical modelling to help convey your message better graphically. This product is a premium product available for immediate download and is 100 percent editable in Powerpoint. Download this now and use it in your presentations to impress your audience.
Statistical Manipulation Examples Ppt PowerPoint Presentation Layouts Examples Cpb Pdf
Presenting this set of slides with name statistical manipulation examples ppt powerpoint presentation layouts examples cpb pdf. This is an editable Powerpoint six stages graphic that deals with topics like statistical manipulation examples to help convey your message better graphically. This product is a premium product available for immediate download and is 100 percent editable in Powerpoint. Download this now and use it in your presentations to impress your audience.
Statistically Significant Difference Ppt PowerPoint Presentation Inspiration Styles Cpb Pdf
Presenting this set of slides with name statistically significant difference ppt powerpoint presentation inspiration styles cpb pdf. This is an editable Powerpoint four stages graphic that deals with topics like statistically significant difference to help convey your message better graphically. This product is a premium product available for immediate download and is 100 percent editable in Powerpoint. Download this now and use it in your presentations to impress your audience.
Statistical Assessment Process Vector Icon Ppt Infographic Template Icon PDF
Persuade your audience using this statistical assessment process vector icon ppt infographic template icon pdf. This PPT design covers three stages, thus making it a great tool to use. It also caters to a variety of topics including statistical assessment process vector icon. Download this PPT design now to present a convincing pitch that not only emphasizes the topic but also showcases your presentation skills.
Icon Depicting Benchmarking Procedure For Statistical Analysis Rules PDF
Persuade your audience using this Icon Depicting Benchmarking Procedure For Statistical Analysis Rules PDF This PPT design covers four stages, thus making it a great tool to use. It also caters to a variety of topics including Icon Depicting, Benchmarking Procedure, Statistical Analysis Download this PPT design now to present a convincing pitch that not only emphasizes the topic but also showcases your presentation skills.
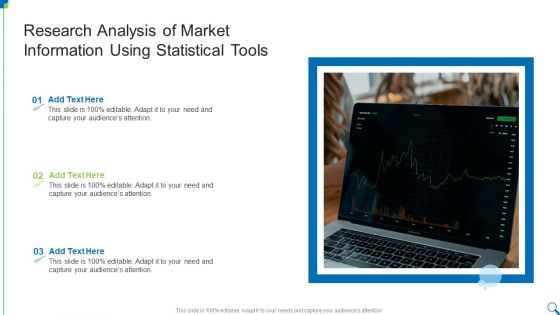
Research Analysis Of Market Information Using Statistical Tools Clipart PDF
Persuade your audience using this Research Analysis Of Market Information Using Statistical Tools Clipart PDF This PPT design covers three stages, thus making it a great tool to use. It also caters to a variety of topics including Research Analysis, Of Market Information, Statistical Tools Download this PPT design now to present a convincing pitch that not only emphasizes the topic but also showcases your presentation skills.
Emerging Trends In Affiliation Marketing Statistical Icon Slides PDF
Presenting Emerging Trends In Affiliation Marketing Statistical Icon Slides PDF to provide visual cues and insights. Share and navigate important information on four stages that need your due attention. This template can be used to pitch topics like Emerging Trends In Affiliation, Marketing Statistical Icon. In addtion, this PPT design contains high resolution images, graphics, etc, that are easily editable and available for immediate download.
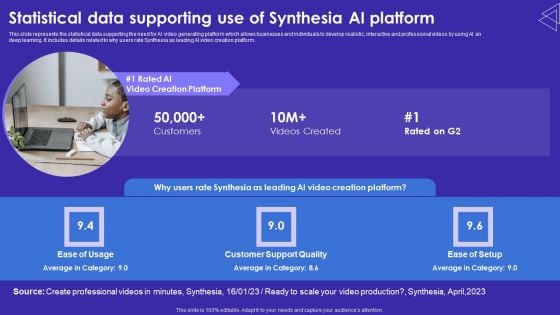
Statistical Data Supporting Use Of Synthesia AI Platform Background PDF
This slide represents the statistical data supporting the need for AI video generating platform which allows businesses and individuals to develop realistic, interactive and professional videos by using AI an deep learning. It includes details related to why users rate Synthesia as leading AI video creation platform. Formulating a presentation can take up a lot of effort and time, so the content and message should always be the primary focus. The visuals of the PowerPoint can enhance the presenters message, so our Statistical Data Supporting Use Of Synthesia AI Platform Background PDF was created to help save time. Instead of worrying about the design, the presenter can concentrate on the message while our designers work on creating the ideal templates for whatever situation is needed. Slidegeeks has experts for everything from amazing designs to valuable content, we have put everything into Statistical Data Supporting Use Of Synthesia AI Platform Background PDF.
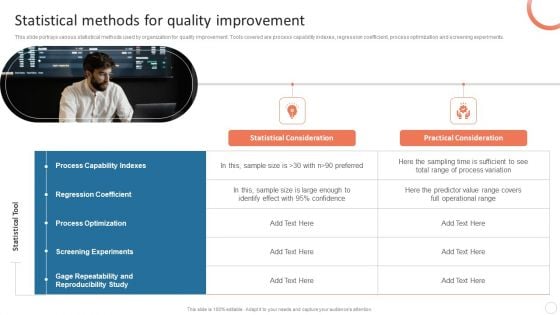
Quality Control Plan Statistical Methods For Quality Improvement Diagrams PDF
This slide portrays various statistical methods used by organization for quality improvement. Tools covered are process capability indexes, regression coefficient, process optimization and screening experiments. The Quality Control Plan Statistical Methods For Quality Improvement Diagrams PDF is a compilation of the most recent design trends as a series of slides. It is suitable for any subject or industry presentation, containing attractive visuals and photo spots for businesses to clearly express their messages. This template contains a variety of slides for the user to input data, such as structures to contrast two elements, bullet points, and slides for written information. Slidegeeks is prepared to create an impression.

Editable Bell Curve PowerPoint Templates Statistical Curve Ppt Slides
Editable Bell Curve PowerPoint templates Statistical Curve PPT Slides-These high quality, editable pre-designed powerpoint slides have been carefully created by our professional team to help you impress your audience. Each graphic in every slide is vector based and is 100% editable in powerpoint. Each and every property of any slide - color, size, shading etc can be modified to build an effective powerpoint presentation. Use these slides to convey complex business concepts in a simplified manner. Any text can be entered at any point in the powerpoint slide. Simply DOWNLOAD, TYPE and PRESENT! Dwell on your argument with our Editable Bell Curve PowerPoint Templates Statistical Curve Ppt Slides. Your audience will see eye to eye with you.
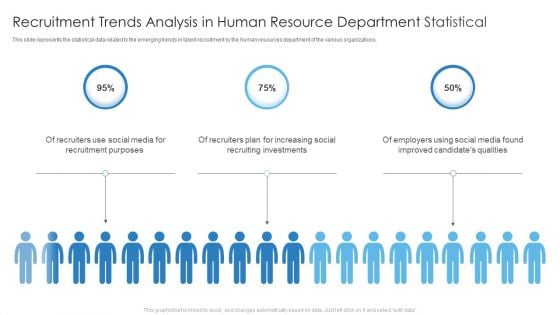
Recruitment Trends Analysis In Human Resource Department Statistical Download PDF
This slide represents the statistical data related to the emerging trends in talent recruitment by the human resources department of the various organizations. Presenting Recruitment Trends Analysis In Human Resource Department Statistical Download PDF to provide visual cues and insights. Share and navigate important information on three stages that need your due attention. This template can be used to pitch topics like Recruiting Investments, Social Media, Recruitment Purposes. In addtion, this PPT design contains high resolution images, graphics, etc, that are easily editable and available for immediate download.
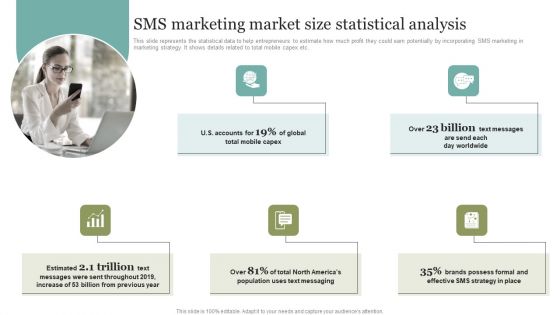
SMS Marketing Market Size Statistical Analysis Brochure PDF
Here you can discover an assortment of the finest PowerPoint and Google Slides templates. With these templates, you can create presentations for a variety of purposes while simultaneously providing your audience with an eye-catching visual experience. Download SMS Marketing Market Size Statistical Analysis Brochure PDF to deliver an impeccable presentation. These templates will make your job of preparing presentations much quicker, yet still, maintain a high level of quality. Slidegeeks has experienced researchers who prepare these templates and write high-quality content for you. Later on, you can personalize the content by editing the SMS Marketing Market Size Statistical Analysis Brochure PDF.
Statistical Analysis Vector Icon Ppt Powerpoint Presentation Layouts Tips
Presenting this set of slides with name statistical analysis vector icon ppt powerpoint presentation layouts tips. This is a one stage process. The stages in this process are market entry analysis, market attractiveness, strategic analysis. This is a completely editable PowerPoint presentation and is available for immediate download. Download now and impress your audience.
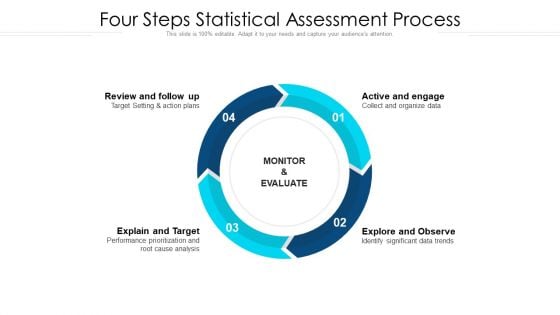
Four Steps Statistical Assessment Process Ppt Infographic Template Templates PDF
Presenting four steps statistical assessment process ppt infographic template templates pdf to dispense important information. This template comprises four stages. It also presents valuable insights into the topics including active and engage, explore and observe, explain and target, review and follow up. This is a completely customizable PowerPoint theme that can be put to use immediately. So, download it and address the topic impactfully.
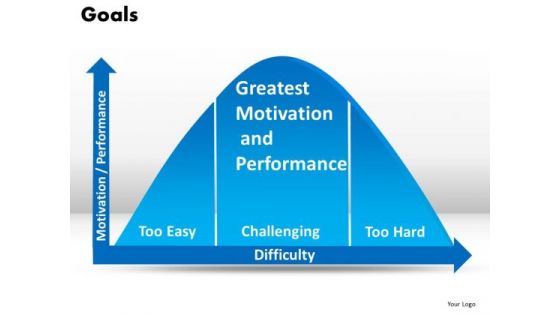
PowerPoint Templates Statistical Bell Curve PowerPoint Slides Download
PowerPoint_Templates_Statistical_Bell_Curve_PowerPoint_Slides_Download-These high quality powerpoint pre-designed slides and powerpoint templates have been carefully created by our professional team to help you impress your audience. All slides have been created and are 100% editable in powerpoint. Each and every property of any graphic - color, size, orientation, shading, outline etc. can be modified to help you build an effective powerpoint presentation. Any text can be entered at any point in the powerpoint template or slide. Simply DOWNLOAD, TYPE and PRESENT! These PowerPoint presentation slides can be used to represent themes relating to --Arrow, alphabet, ball, blue, business, chart, concept, creative, crystal, circle, diagram, shape, round, shadow, reflection, glossy, glowing, shiny, icon, process, flow, link, connect, connection, style, relation, text, textbox-PowerPoint_Templates_Statistical_Bell_Curve_PowerPoint_Slides_Download Make the greatest presentation ever with our PowerPoint Templates Statistical Bell Curve PowerPoint Slides Download. Dont waste time struggling with PowerPoint. Let us do it for you.
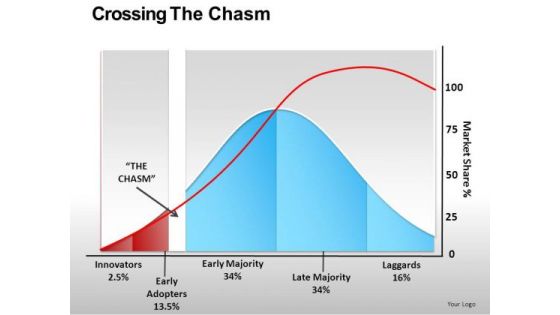
Growth After Reaching Critical Mass Statistical Curve Editable Ppt Slides
Growth_after_reaching_Critical_Mass_Statistical_Curve_Editable_PPT_Slides-These high quality powerpoint pre-designed slides and powerpoint templates have been carefully created by our professional team to help you impress your audience. All slides have been created and are 100% editable in powerpoint. Each and every property of any graphic - color, size, orientation, shading, outline etc. can be modified to help you build an effective powerpoint presentation. Any text can be entered at any point in the powerpoint template or slide. Simply DOWNLOAD, TYPE and PRESENT! These PowerPoint presentation slides can be used to represent themes relating to --Alone, apart, chasm, clipart, communication, concept, couple, crack, divide, divorce, estranged, female, figure, gap, gender, graphic, illustration, isolated, isolation, issues, loneliness, love, male, man, people, problems, romance, silhouette, stick, symbol, vector, woman-Growth_after_reaching_Critical_Mass_Statistical_Curve_Editable_PPT_Slides Use our Growth After Reaching Critical Mass Statistical Curve Editable Ppt Slides as an example. Demonstrate the benefit of attention to detail.
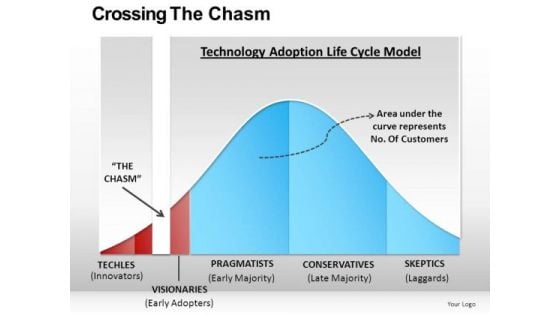
Statistical Bell Curve Gap PowerPoint Slides And Editable Ppt Templates
Statistical_Bell_Curve_Gap_PowerPoint_Slides_and_Editable_PPT_templates-These high quality powerpoint pre-designed slides and powerpoint templates have been carefully created by our professional team to help you impress your audience. All slides have been created and are 100% editable in powerpoint. Each and every property of any graphic - color, size, orientation, shading, outline etc. can be modified to help you build an effective powerpoint presentation. Any text can be entered at any point in the powerpoint template or slide. Simply DOWNLOAD, TYPE and PRESENT! These PowerPoint presentation slides can be used to represent themes relating to --Alone, apart, chasm, clipart, communication, concept, couple, crack, divide, divorce, estranged, female, figure, gap, gender, graphic, illustration, isolated, isolation, issues, loneliness, love, male, man, people, problems, romance, silhouette, stick, symbol, vector, woman-Statistical_Bell_Curve_Gap_PowerPoint_Slides_and_Editable_PPT_templates Catalog your journey with our Statistical Bell Curve Gap PowerPoint Slides And Editable Ppt Templates. Download without worries with our money back guaranteee.

Recent Statistical Trends Related Internet Based Trade Structure Ppt Template
This slide shows recent trends related to global e-commerce revenue market size and leading players in the market with predictions for upcoming years in retail ecommerce and US market size. If your project calls for a presentation, then Slidegeeks is your go-to partner because we have professionally designed, easy-to-edit templates that are perfect for any presentation. After downloading, you can easily edit Recent Statistical Trends Related Internet Based Trade Structure Ppt Template and make the changes accordingly. You can rearrange slides or fill them with different images. Check out all the handy templates This slide shows recent trends related to global e-commerce revenue market size and leading players in the market with predictions for upcoming years in retail ecommerce and US market size.
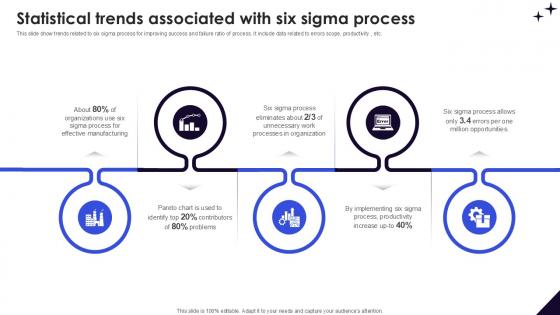
Statistical Trends Associated With DMAIC Methodology To Maintain PPT Template
This slide show trends related to six sigma process for improving success and failure ratio of process. It include data related to errors scope, productivity , etc. Take your projects to the next level with our ultimate collection of Statistical Trends Associated With DMAIC Methodology To Maintain PPT Template. Slidegeeks has designed a range of layouts that are perfect for representing task or activity duration, keeping track of all your deadlines at a glance. Tailor these designs to your exact needs and give them a truly corporate look with your own brand colors they will make your projects stand out from the rest This slide show trends related to six sigma process for improving success and failure ratio of process. It include data related to errors scope, productivity , etc.
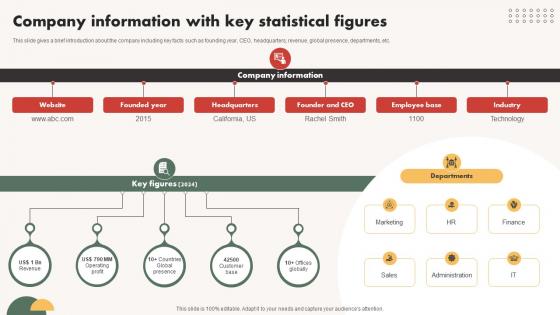
Automated Communication System Company Information With Key Statistical Figures
This slide gives a brief introduction about the company including key facts such as founding year, CEO, headquarters, revenue, global presence, departments, etc. Whether you have daily or monthly meetings, a brilliant presentation is necessary. Automated Communication System Company Information With Key Statistical Figures can be your best option for delivering a presentation. Represent everything in detail using Automated Communication System Company Information With Key Statistical Figures and make yourself stand out in meetings. The template is versatile and follows a structure that will cater to your requirements. All the templates prepared by Slidegeeks are easy to download and edit. Our research experts have taken care of the corporate themes as well. So, give it a try and see the results. This slide gives a brief introduction about the company including key facts such as founding year, CEO, headquarters, revenue, global presence, departments, etc.

Business Diagram Business Bar Graph For Data Analysis Presentation Template
This business slide displays pie charts with percentage ratios. This diagram is a data visualization tool that gives you a simple way to present statistical information. This slide helps your audience examines and interprets the data you present.
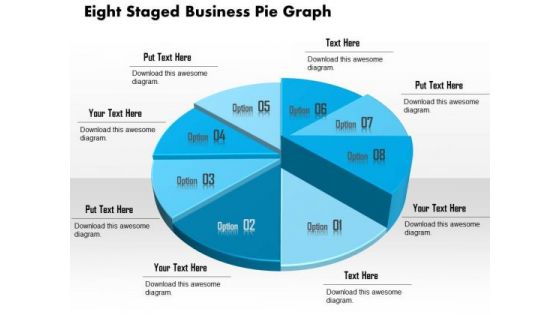
Business Diagram Eight Staged Business Pie Graph Presentation Template
This business slide displays eight staged pie chart. This diagram is a data visualization tool that gives you a simple way to present statistical information. This slide helps your audience examine and interpret the data you present.
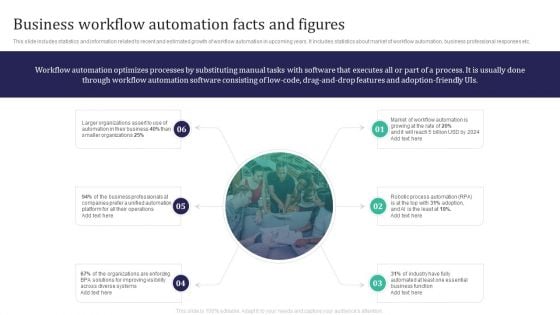
Integration Automation Business Workflow Automation Facts And Figures Elements PDF
This slide includes statistics and information related to recent and estimated growth of workflow automation in upcoming years. It includes statistics about market of workflow automation, business professional responses etc. There are so many reasons you need a Integration Automation Business Workflow Automation Facts And Figures Elements PDF. The first reason is you cant spend time making everything from scratch, Thus, Slidegeeks has made presentation templates for you too. You can easily download these templates from our website easily.
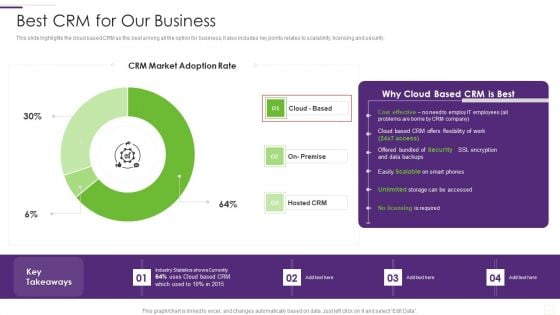
CRM Implementation Strategy Best CRM For Our Business Pictures PDF
This slide highlights the cloud based CRM as the best among all the option for business, It also includes key points relates to scalability, licensing and security.Deliver an awe inspiring pitch with this creative CRM Implementation Strategy Best CRM For Our Business Pictures PDF bundle. Topics like Statistics Shows, Currently, Market Adoption can be discussed with this completely editable template. It is available for immediate download depending on the needs and requirements of the user.
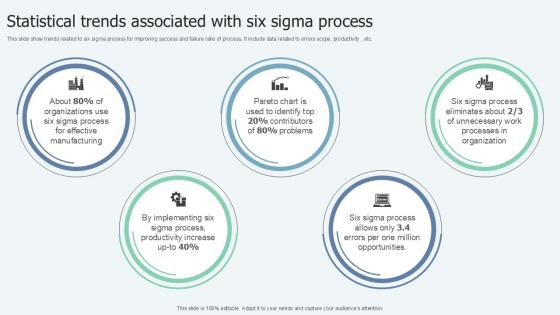
Statistical Trends Associated With Lean Six Sigma In Manufacturing Ppt Example
This slide show trends related to six sigma process for improving success and failure ratio of process. It include data related to errors scope, productivity , etc. Make sure to capture your audiences attention in your business displays with our gratis customizable Statistical Trends Associated With Lean Six Sigma In Manufacturing Ppt Example. These are great for business strategies, office conferences, capital raising or task suggestions. If you desire to acquire more customers for your tech business and ensure they stay satisfied, create your own sales presentation with these plain slides. This slide show trends related to six sigma process for improving success and failure ratio of process. It include data related to errors scope, productivity , etc.
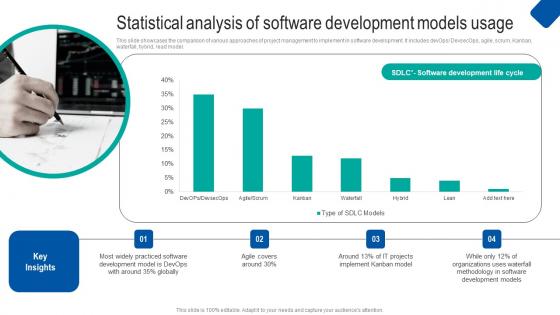
Statistical Analysis Of Software Waterfall Project Management Strategy Construction Industry Microsoft Pdf
This slide showcases the comparison of various approaches of project management to implement in software development. It includes devOps DevsecOps, agile, scrum, Kanban, waterfall, hybrid, lead model. Make sure to capture your audiences attention in your business displays with our gratis customizable Statistical Analysis Of Software Waterfall Project Management Strategy Construction Industry Microsoft Pdf. These are great for business strategies, office conferences, capital raising or task suggestions. If you desire to acquire more customers for your tech business and ensure they stay satisfied, create your own sales presentation with these plain slides. This slide showcases the comparison of various approaches of project management to implement in software development. It includes devOps DevsecOps, agile, scrum, Kanban, waterfall, hybrid, lead model.
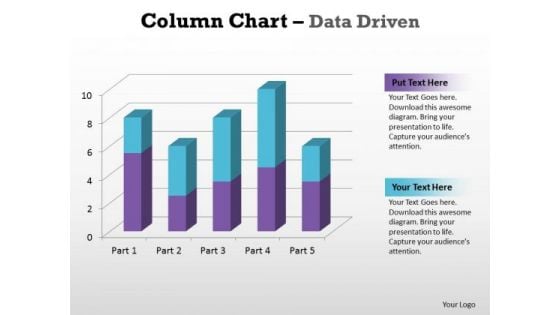
Business Graphic PowerPoint Templates Business Column Chart Data Driven Ppt Slides
Business Graphic PowerPoint Templates Business column chart data driven PPT Slides-With help of visual aids like this template you can capture the attention of the audience and make the presentation very interactive and lively.-Business Graphic PowerPoint Templates Business column chart data driven PPT Slides-This ppt can be used for concepts relating to-chart,, graph, growth, investment, , market, percentage, , presentation report, results, statistics, stock, success and business. Attain stardom with our Business Graphic PowerPoint Templates Business Column Chart Data Driven Ppt Slides. You will come out on top.
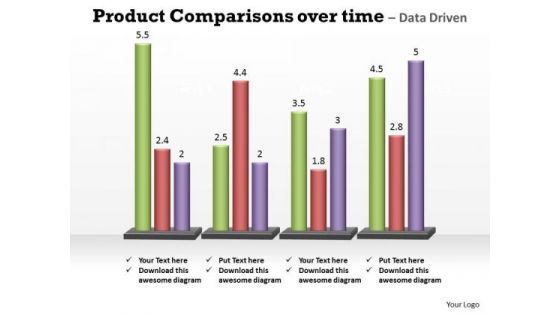
Business Marketing PowerPoint Templates Business Product Comparisons Over Time Ppt Slides
Business Marketing PowerPoint Templates Business product comparisons over time PPT Slides--This chart is useful for showing data changes over a period of time or for illustrating comparisons among items. -Business Marketing PowerPoint Templates Business product comparison over time PPT Slides-This ppt can be used for concepts relating to-chart,, graph, growth, investment, , market, percentage, , presentation report, results, statistics, stock, success and business. Continue growing with our Business Marketing PowerPoint Templates Business Product Comparisons Over Time Ppt Slides. Download without worries with our money back guaranteee.
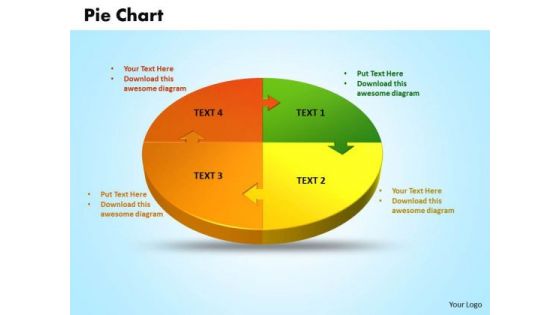
Business Editable PowerPoint Templates Business 3d Jigsaw Circular Pie Chart Ppt Slides
Business Chart PowerPoint Templates Business 3d jigsaw circular pie chart PPT Slides-PowerPoint Template shows Pie Chart with four sectors \\ Part of a series. -Business Chart PowerPoint Templates Business 3d jigsaw circular pie chart PPT Slides-This ppt can be used for concepts relating to-chart, circular, graph, growth, investment, isolated, market, numbers, percentage, pie, piece, plan, presentation, render, report, results, slice, statistics, stock, success and business. Our Business Editable PowerPoint Templates Business 3d Jigsaw Circular Pie Chart Ppt Slides ensure approval. Your ideas will fit the bill.


 Continue with Email

 Home
Home


