Capital Management
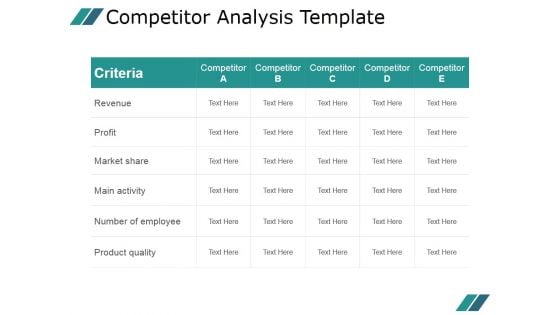
Competitor Analysis Template Ppt PowerPoint Presentation Model
This is a competitor analysis template ppt powerpoint presentation model. This is a five stage process. The stages in this process are revenue, profit, market share, main activity, number of employee, product quality.
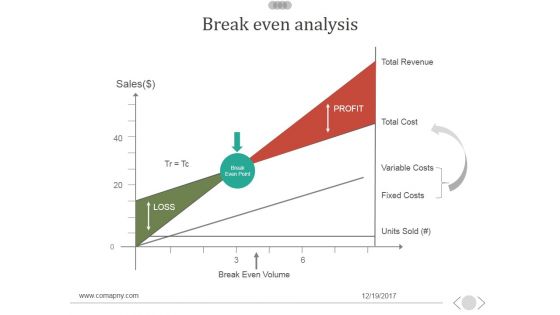
Break Even Analysis Ppt PowerPoint Presentation Design Templates
This is a break even analysis ppt powerpoint presentation design templates. This is a two stage process. The stages in this process are sales, break even volume, total revenue, loss, profit.
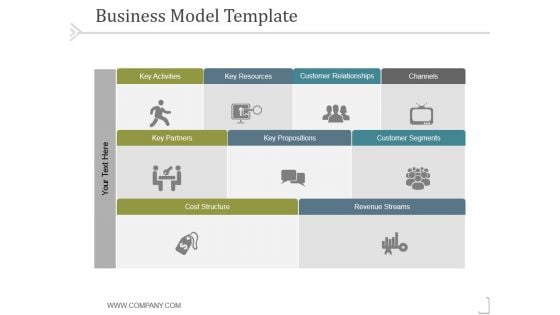
Business Model Template 3 Ppt PowerPoint Presentation Files
This is a business model template 3 ppt powerpoint presentation files. This is a three stage process. The stages in this process are key activities, key resources, key propositions , customer relationships, channels, customer segments, revenue streams.
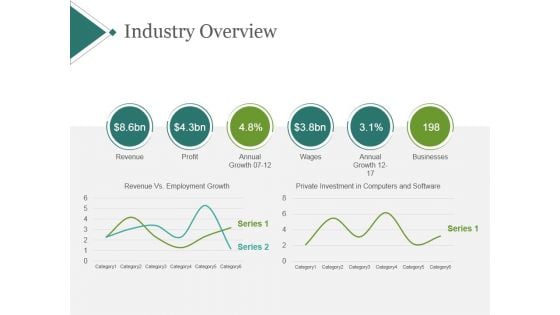
Industry Overview Template 1 Ppt PowerPoint Presentation Deck
This is a industry overview template 1 ppt powerpoint presentation deck. This is a six stage process. The stages in this process are revenue, profit, annual growth, wages, annual growth, businesses.
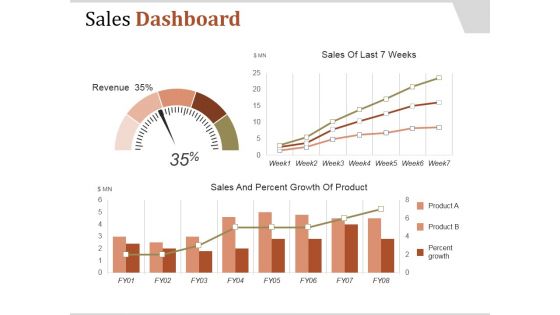
Sales Dashboard Template 1 Ppt PowerPoint Presentation Samples
This is a sales dashboard template 1 ppt powerpoint presentation samples. This is a one stage process. The stages in this process are sales and percent growth of product, revenue, product, percent growth.

Break Even Analysis Ppt PowerPoint Presentation Slides
This is a break even analysis ppt powerpoint presentation slides. This is a two stage process. The stages in this process are loss, profit, sales, total revenue, break even point, total costs.
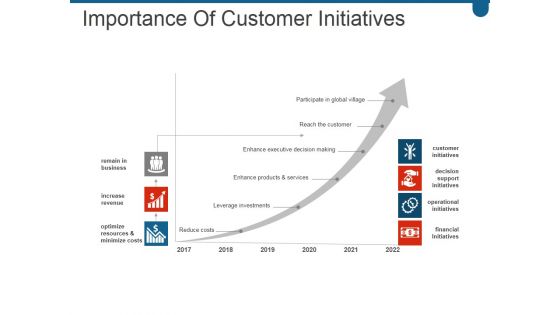
Importance Of Customer Initiatives Ppt PowerPoint Presentation Microsoft
This is a importance of customer initiatives ppt powerpoint presentation microsoft. This is a six stage process. The stages in this process are remain in business, increase revenue, optimize resources and minimize costs, customer initiatives, decision support initiatives.
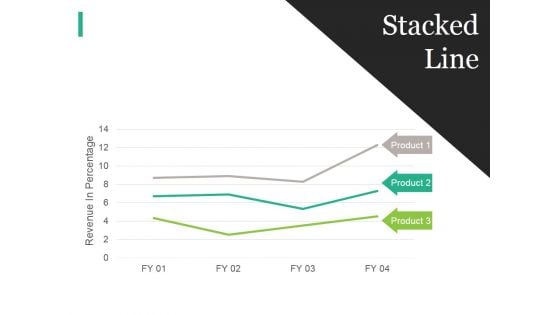
Stacked Line Ppt PowerPoint Presentation File Display
This is a stacked line ppt powerpoint presentation file display. This is a three stage process. The stages in this process are business, strategy, marketing, analysis, revenue in percentage, stacked line.
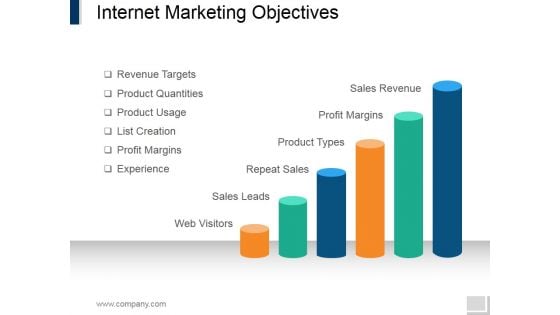
Internet Marketing Objectives Ppt PowerPoint Presentation Summary Portrait
This is a internet marketing objectives ppt powerpoint presentation summary portrait. This is a six stage process. The stages in this process are sales revenue, profit margins, product types, repeat sales, sales leads, web visitors.
Campaign Report Ppt PowerPoint Presentation Icon Visuals
This is a campaign report ppt powerpoint presentation icon visuals. This is a ten stage process. The stages in this process are email name, send date time, recipients, delivered, spam, opt out, revenue.
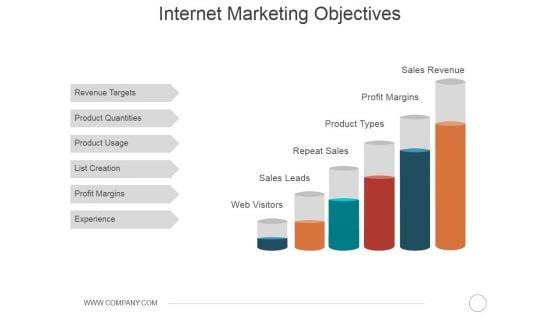
Internet Marketing Objectives Ppt PowerPoint Presentation Portfolio Summary
This is a internet marketing objectives ppt powerpoint presentation portfolio summary. This is a six stage process. The stages in this process are revenue targets, product quantities, product usage, list creation, profit margins, experience.
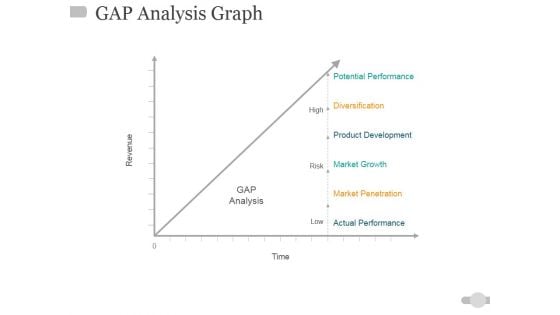
Gap Analysis Graph Ppt PowerPoint Presentation Inspiration Picture
This is a gap analysis graph ppt powerpoint presentation inspiration picture. This is a one stage process. The stages in this process are high, risk, low, time, gap analysis, revenue.
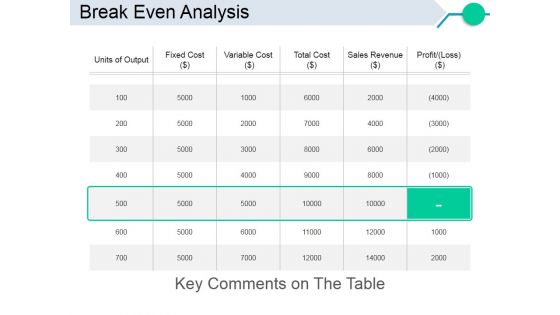
Break Even Analysis Ppt PowerPoint Presentation Model Portfolio
This is a break even analysis ppt powerpoint presentation model portfolio. This is a five stage process. The stages in this process are fixed cost, variable cost, total cost, sales revenue.
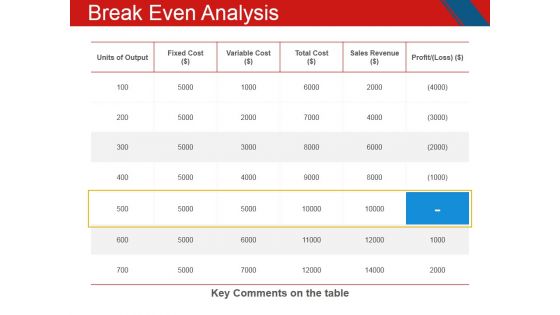
Break Even Analysis Ppt PowerPoint Presentation Inspiration Templates
This is a break even analysis ppt powerpoint presentation inspiration templates. This is a five stage process. The stages in this process are units of output, fixed cost, variable cost, total cost, sales revenue, profit.
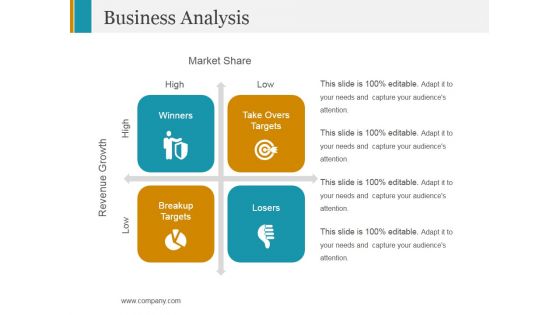
Business Analysis Ppt PowerPoint Presentation Styles Images
This is a business analysis ppt powerpoint presentation styles images. This is a four stage process. The stages in this process are high, low, market share, revenue growth, winners.
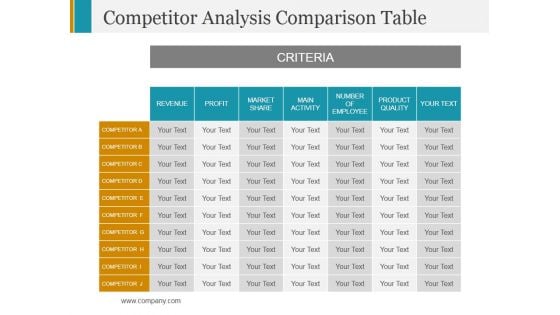
Competitor Analysis Comparison Table Ppt PowerPoint Presentation Infographics Design Inspiration
This is a competitor analysis comparison table ppt powerpoint presentation infographics design inspiration. This is a seven stage process. The stages in this process are revenue, profit, market share, main activity.
Calculating Customer Lifetime Value Clv Ppt PowerPoint Presentation Show Icon
This is a calculating customer lifetime value clv ppt powerpoint presentation show icon. This is a five stage process. The stages in this process are average acquisition cost, average customer revenue, average customer costs, average customer profit, customer retention rate.
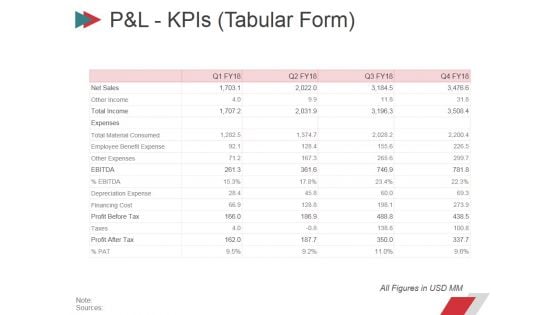
Pandl Kpis Tabular Form Ppt PowerPoint Presentation Summary Layout
This is a pandl kpis tabular form ppt powerpoint presentation summary layout. This is a four stage process. The stages in this process are revenue, cogs, operating profit, net profit.
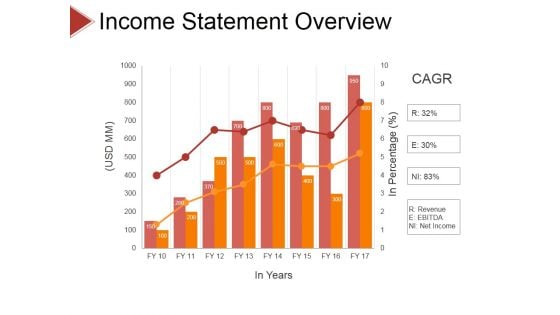
Income Statement Overview Ppt PowerPoint Presentation Slides Samples
This is a income statement overview ppt powerpoint presentation slides samples. This is a eight stage process. The stages in this process are business, strategy, analysis, pretention, revenue, ebitda, net income.
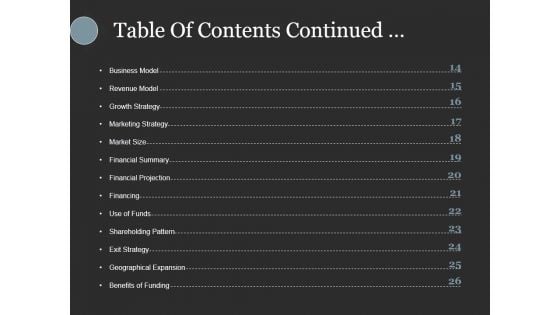
Table Of Contents Continued Ppt PowerPoint Presentation Inspiration Slides
This is a table of contents continued ppt powerpoint presentation inspiration slides. This is a fourteen stage process. The stages in this process are business model, revenue model, growth strategy, marketing strategy, market size.
Break Even Analysis Ppt PowerPoint Presentation Icon Slide
This is a break even analysis ppt powerpoint presentation icon slide. This is a four stage process. The stages in this process are total revenue, total costs, variable cost, fixed costs.
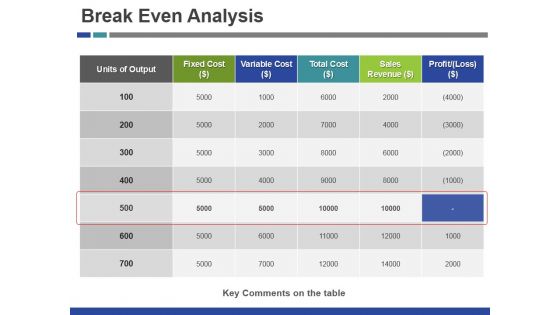
Break Even Analysis Ppt PowerPoint Presentation Inspiration Microsoft
This is a break even analysis ppt powerpoint presentation inspiration microsoft. This is a five stage process. The stages in this process are fixed cost, variable cost, total cost, sales revenue.
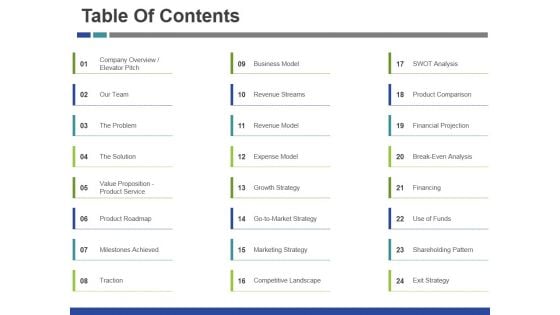
Table Of Contents Ppt PowerPoint Presentation Background Image
This is a table of contents ppt powerpoint presentation background image. This is a three stage process. The stages in this process are our team, the problem, business model, revenue streams.
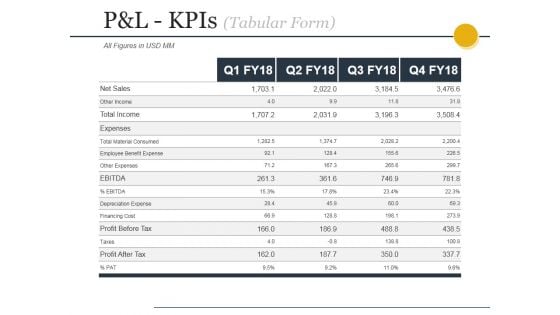
Pandl Kpis Tabular Form Ppt PowerPoint Presentation File Design Templates
This is a pandl kpis tabular form ppt powerpoint presentation file design templates. This is a four stage process. The stages in this process are revenue, cogs, operating profit, net profit.
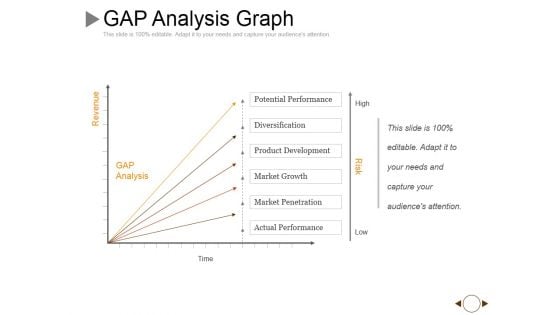
Gap Analysis Graph Ppt PowerPoint Presentation Slides Graphics Pictures
This is a gap analysis graph ppt powerpoint presentation slides graphics pictures. This is a five stage process. The stages in this process are revenue, time, high, low, risk.
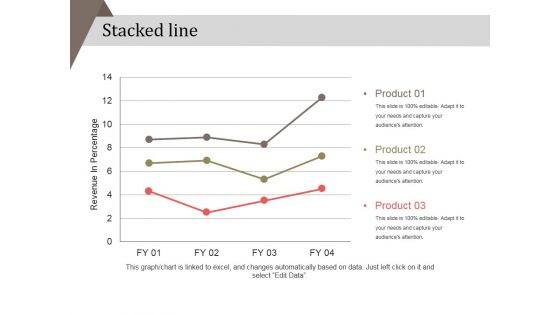
Stacked Line Ppt PowerPoint Presentation Summary File Formats
This is a stacked line ppt powerpoint presentation summary file formats. This is a three stage process. The stages in this process are product, revenue in percentage, strategy, business, marketing.
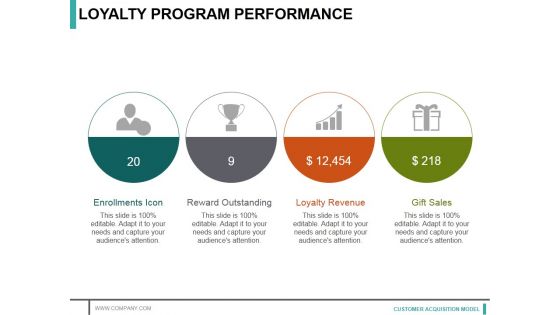
Loyalty Program Performance Ppt PowerPoint Presentation Styles Example
This is a loyalty program performance ppt powerpoint presentation styles example. This is a four stage process. The stages in this process are enrollments icon, reward outstanding, loyalty revenue, gift sales.
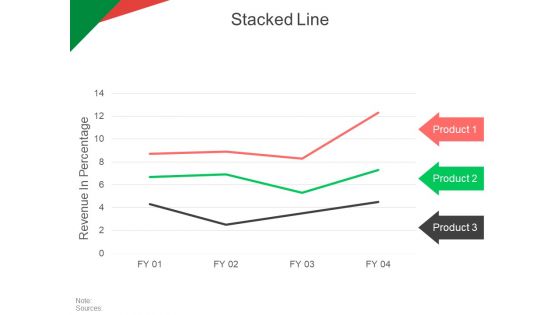
Stacked Line Ppt PowerPoint Presentation Portfolio Example Topics
This is a stacked line ppt powerpoint presentation portfolio example topics. This is a three stage process. The stages in this process are revenue in percentage, product, business, marketing, strategy.
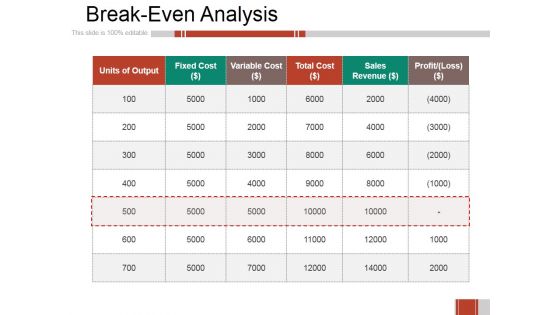
Breakeven Analysis Ppt PowerPoint Presentation Professional Design Templates
This is a breakeven analysis ppt powerpoint presentation professional design templates. This is a six stage process. The stages in this process are units of output, fixed cost, variable cost, total cost, sales revenue.
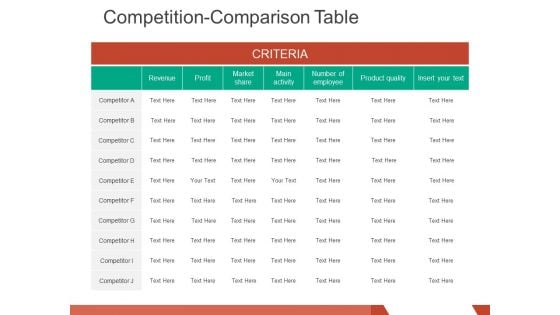
competition comparison table ppt powerpoint presentation infographics design inspiration
This is a competition comparison table ppt powerpoint presentation infographics design inspiration. This is a seven stage process. The stages in this process are revenue, profit, market share, main activity, number of employee.
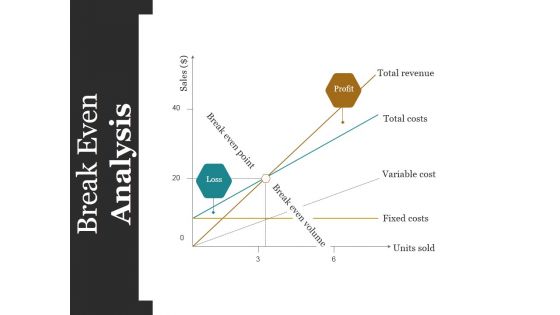
Break Even Analysis Ppt PowerPoint Presentation Inspiration Layouts
This is a break even analysis ppt powerpoint presentation inspiration layouts. This is a three stage process. The stages in this process are total revenue, total costs, variable cost, fixed costs, units sold.
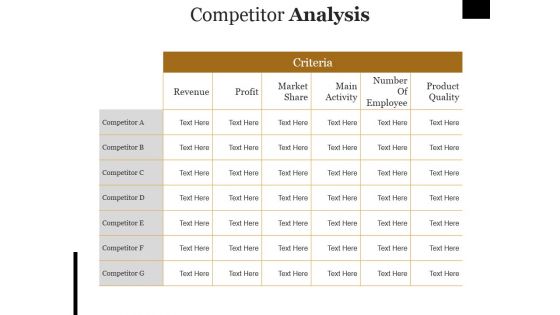
Competitor Analysis Ppt PowerPoint Presentation Outline Rules
This is a competitor analysis ppt powerpoint presentation outline rules. This is a seven stage process. The stages in this process are revenue, profit, market share, main activity, number of employee.
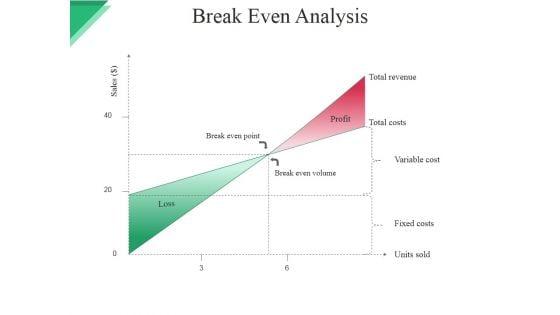
Break Even Analysis Ppt PowerPoint Presentation Styles Samples
This is a break even analysis ppt powerpoint presentation styles samples. This is a two stage process. The stages in this process are break even point, break even volume, profit, total revenue, total costs, variable cost.
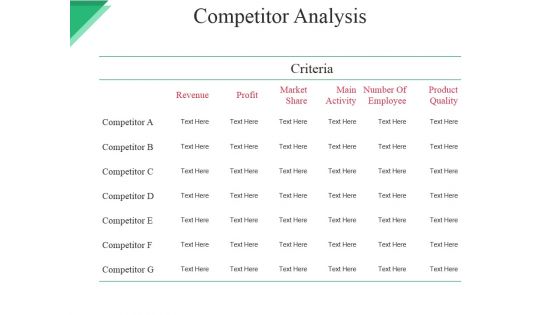
Competitor Analysis Ppt PowerPoint Presentation Show Infographics
This is a competitor analysis ppt powerpoint presentation show infographics. This is a seven stage process. The stages in this process are revenue, profit, market, share, main activity, number of employee.
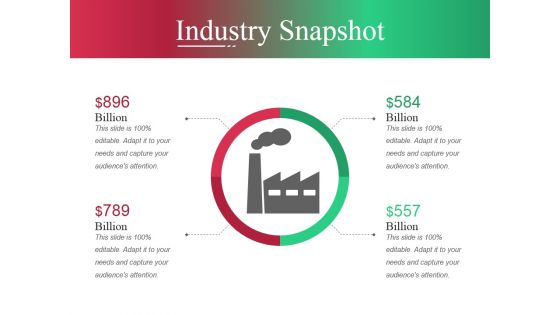
Industry Snapshot Template Ppt PowerPoint Presentation Slides Shapes
This is a industry snapshot template ppt powerpoint presentation slides shapes. This is a two stage process. The stages in this process are revenue, profit, annual growth, wages, annual growth, business.
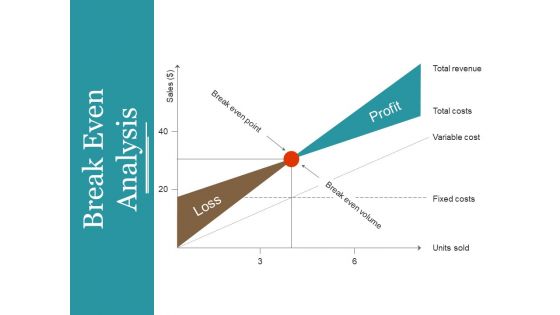
Break Even Analysis Ppt PowerPoint Presentation Gallery Master Slide
This is a break even analysis ppt powerpoint presentation gallery master slide. This is a two stage process. The stages in this process are total revenue, total costs, variable cost, fixed costs, units sold.
Competitor Analysis Ppt PowerPoint Presentation Ideas Icons
This is a competitor analysis ppt powerpoint presentation ideas icons. This is a seven stage process. The stages in this process are revenue, profit, market share, main activity, number of employee.
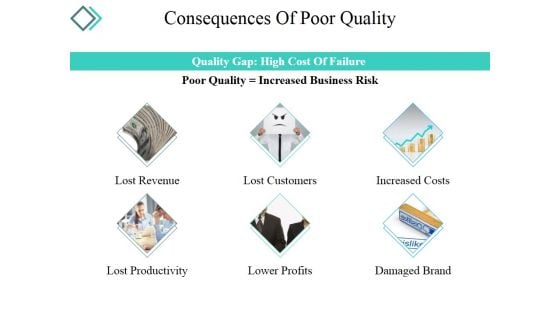
Consequences Of Poor Quality Ppt PowerPoint Presentation Show Grid
This is a consequences of poor quality ppt powerpoint presentation show grid. This is a six stage process. The stages in this process are lost revenue, lost customers, increased costs, lost productivity, lower profits.

Ideal Acquisition Cost Model Ppt PowerPoint Presentation Inspiration Background Designs
This is a ideal acquisition cost model ppt powerpoint presentation inspiration background designs. This is a two stage process. The stages in this process are cost to acquire a customer, monetization, recurring revenue, field sales.
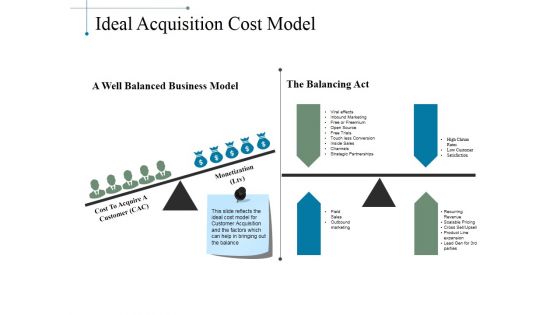
Ideal Acquisition Cost Model Ppt PowerPoint Presentation Pictures Infographics
This is a ideal acquisition cost model ppt powerpoint presentation pictures infographics. This is a two stage process. The stages in this process are the balancing act, viral effects, monetization, recurring revenue.
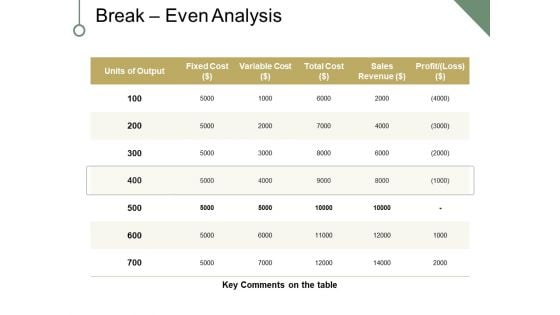
Break Even Analysis Ppt PowerPoint Presentation Portfolio Clipart
This is a break even analysis ppt powerpoint presentation portfolio clipart. This is a five stage process. The stages in this process are fixed cost, variable cost, sales revenue, profit, key comments on the table, units of output.
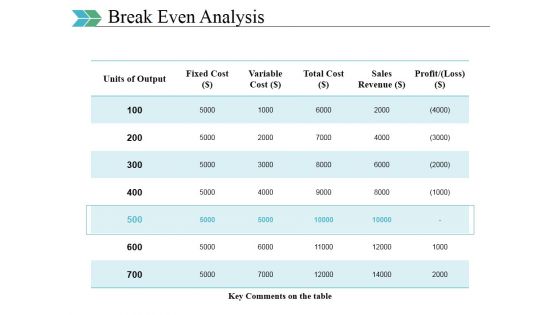
Break Even Analysis Ppt PowerPoint Presentation Styles Influencers
This is a break even analysis ppt powerpoint presentation styles influencers. This is a five stage process. The stages in this process are units of output, fixed cost, variable cost, total cost, sales revenue.

Table Of Contents Ppt PowerPoint Presentation Summary Slide Portrait
This is a table of contents ppt powerpoint presentation summary slide portrait. This is a three stage process. The stages in this process are the problem, our team, the solution, business model, revenue streams.
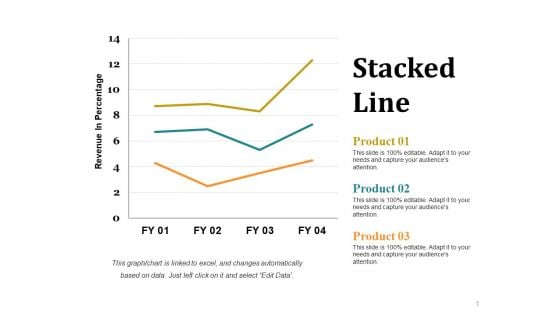
Stacked Line Ppt PowerPoint Presentation Portfolio Vector
This is a stacked line ppt powerpoint presentation portfolio vector. This is a three stage process. The stages in this process are revenue in percentage, business, marketing, growth, strategy.
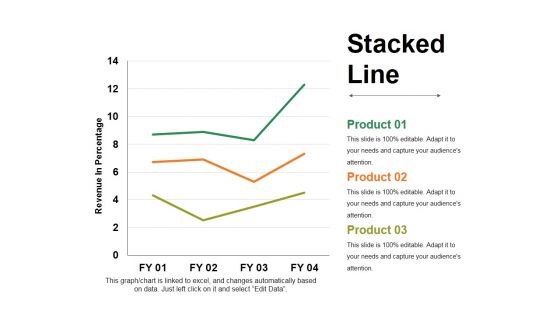
Stacked Line Ppt PowerPoint Presentation Ideas Design Inspiration
This is a stacked line ppt powerpoint presentation ideas design inspiration. This is a three stage process. The stages in this process are revenue in percentage, business, marketing, growth, strategy.
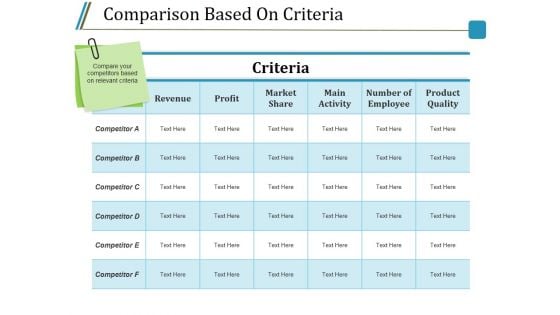
Comparison Based On Criteria Ppt PowerPoint Presentation Outline Pictures
This is a comparison based on criteria ppt powerpoint presentation outline pictures. This is a six stage process. The stages in this process are revenue, profit, market share, main activity, number of employee.
Comparison Based On Criteria Ppt PowerPoint Presentation Show Icon
This is a comparison based on criteria ppt powerpoint presentation show icon. This is a six stage process. The stages in this process are revenue, profit, market share, main activity, number of employee.
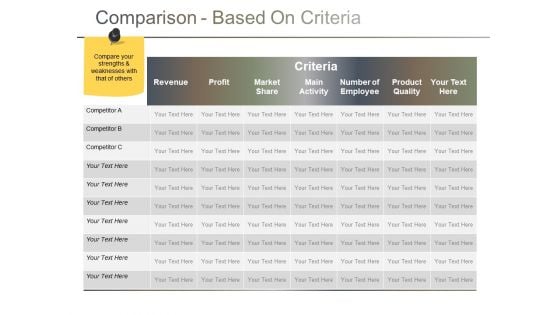
Comparison Based On Criteria Ppt PowerPoint Presentation Gallery Themes
This is a comparison based on criteria ppt powerpoint presentation gallery themes. This is a seven stage process. The stages in this process are revenue, profit, market share, main activity, product quality.

Comparison Based On Criteria Ppt PowerPoint Presentation Gallery Sample
This is a comparison based on criteria ppt powerpoint presentation gallery sample. This is a six stage process. The stages in this process are revenue, profit, market share, main activity, number of employee.
Comparison Based On Criteria Ppt PowerPoint Presentation Icon Example Introduction
This is a comparison based on criteria ppt powerpoint presentation icon example introduction. This is a six stage process. The stages in this process are criteria, revenue, profit, market share, main activity.

Comparison Based On Criteria Ppt PowerPoint Presentation Show File Formats
This is a comparison based on criteria ppt powerpoint presentation show file formats. This is a six stage process. The stages in this process are revenue, profit, market share, main activity, number of employee.
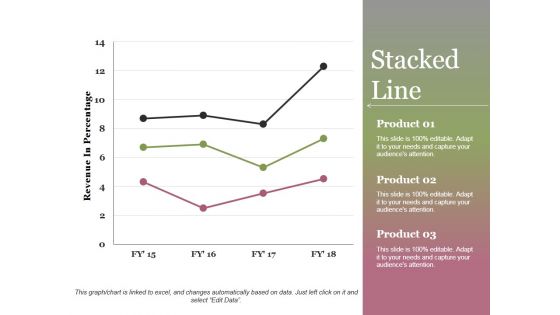
Stacked Line Ppt PowerPoint Presentation Show
This is a stacked line ppt powerpoint presentation show. This is a three stage process. The stages in this process are revenue in percentage, product, stacked line, growth, success.
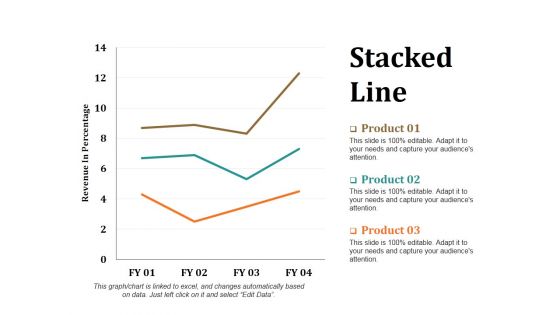
Stacked Line Ppt PowerPoint Presentation Layouts Portrait
This is a stacked line ppt powerpoint presentation layouts portrait. This is a three stage process. The stages in this process are revenue in percentage, stacked line, product, growth, success.
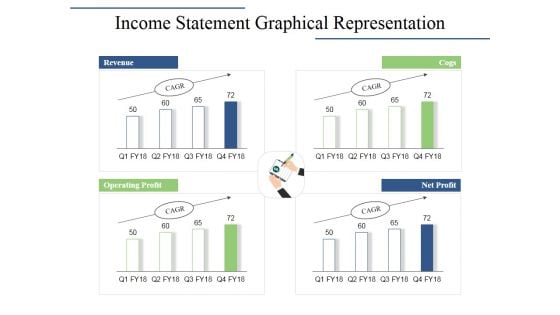
Income Statement Graphical Representation Ppt PowerPoint Presentation Infographics Layouts
This is a income statement graphical representation ppt powerpoint presentation infographics layouts. This is a four stage process. The stages in this process are revenue, cogs, operating profit, net profit.
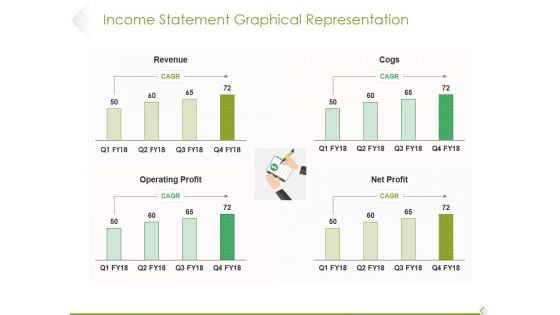
Income Statement Graphical Representation Ppt PowerPoint Presentation Infographic Template Influencers
This is a income statement graphical representation ppt powerpoint presentation infographic template influencers. This is a four stage process. The stages in this process are revenue, cogs, operating profit, profit.

Stacked Line Ppt PowerPoint Presentation Outline Inspiration
This is a stacked line ppt powerpoint presentation outline inspiration. This is a three stage process. The stages in this process are revenue in percentage, product, growth, business, success.
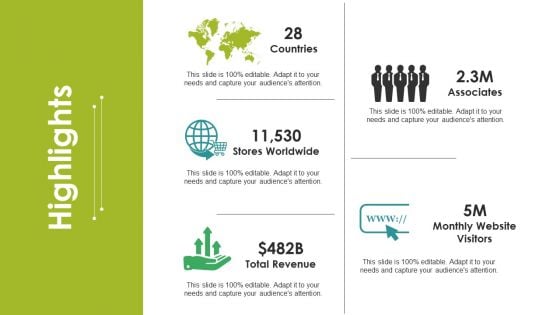
Highlights Ppt PowerPoint Presentation Infographic Template Outline
This is a highlights ppt powerpoint presentation infographic template outline. This is a five stage process. The stages in this process are stores worldwide, countries, total revenue, associates, monthly website visitors.
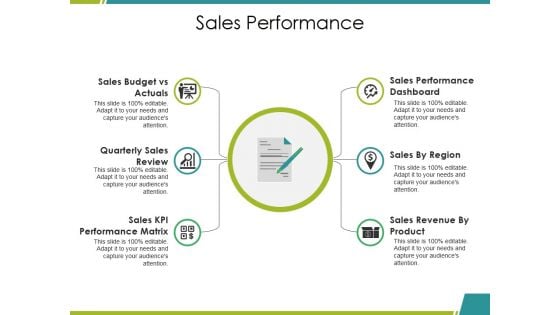
Sales Performance Ppt PowerPoint Presentation Pictures Format Ideas
This is a sales performance ppt powerpoint presentation pictures format ideas. This is a six stage process. The stages in this process are quarterly sales review, sales by region, sales performance dashboard, sales revenue by product.
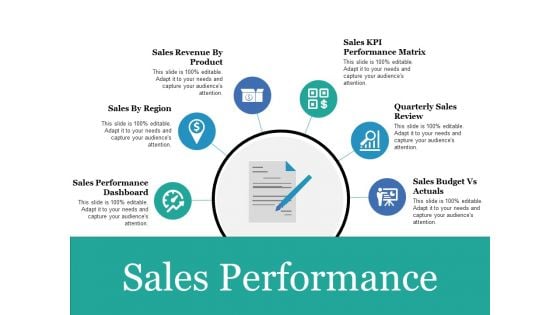
Sales Performance Ppt PowerPoint Presentation Portfolio Show
This is a sales performance ppt powerpoint presentation portfolio show. This is a six stage process. The stages in this process are sales performance dashboard, sales by region, sales revenue by product, quarterly sales review, sales budget vs actuals.
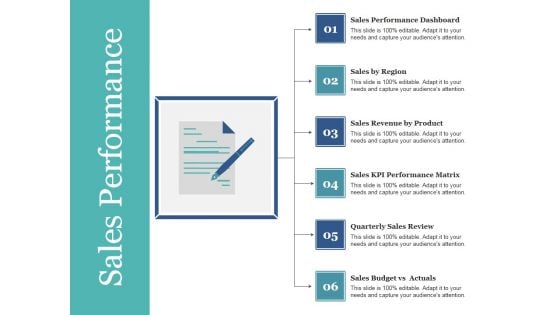
Sales Performance Ppt PowerPoint Presentation Summary Influencers
This is a sales performance ppt powerpoint presentation summary influencers. This is a six stage process. The stages in this process are sales performance dashboard, sales by region, sales revenue by product, sales kpi performance matrix, quarterly sales review.


 Continue with Email

 Home
Home


